William Ward, April 18, 2019
The world is drowning in articles about catastrophic sea level rise (SLR), reminding us that if the ice sheets melt, 260 feet of water will flood our coastal cities. We know that sea level today is 20-30 feet lower than it was at the end of the last interglacial period 120,000 years ago. We also know that sea level has risen 430 feet since the end of the last glacial maximum 22,000 years ago. Research shows this rise was not monotonic but oscillatory, and during periods over the past 10,000 years, sea level has been several meters higher than today. So, evidence supports the possibility of higher sea levels, but does the evidence support the possibility of catastrophic sea level rise from rapidly melting ice?
In this paper, basic science is used to show that catastrophic SLR from melting ice cannot happen naturally over a short period. Additionally, humankind does not possess the capability to melt a large amount of ice quickly even through our most advanced technology. This news should relieve the public, which is routinely deceived by reporting that misrepresents the facts. The public is susceptible to unnecessary alarmism when melt rates and ice-melt masses are presented without perspective and juxtaposed against claims that scientists are worried. This paper uses the same facts but places them in perspective to show that catastrophic risks do not exist.
Ice Sheets Melting: Deceptive Reporting
The growing alarm over melting ice sheets is directly attributable to deceptive reporting. The sheer number of reports inundates the public with an incessant message of angst. A single scientific study can be the source for headlines in hundreds of news articles. With social media repeating the news and the subsequent chorus of lectures from celebrities and politicians, we find ourselves in the deafening echo chamber of Climate Alarmism. However, it is a mistake to assume the real risks are proportional to the frequency or intensity of the message.
The primary problem is that the news writers do not have the scientific background to report on the subject responsibly, and therefore they routinely corrupt and distort the facts. Take for example an article in Smithsonian dated September 1, 2016, entitled “Melting Glaciers Are Wreaking Havoc on Earth’s Crust.” The first two sentences of the article read:
“You’ve no doubt by now been inundated with the threat of global sea level rise. At the current estimated rate of one-tenth of an inch each year, sea level rise could cause large swaths of cities like New York, Galveston and Norfolk to disappear underwater in the next 20 years.”
A sea level rise rate of one-tenth of an inch per year yields 2 inches of SLR in 20 years. Topographical maps show the lowest elevations of these cities are more than ten feet above sea level. No portion of these cities will disappear underwater from 2 inches of SLR.
The news writers seem obligated to pepper the facts with their own opinions such as “… climate change is real, undeniable and caused by humans.” It is often difficult for the reader to discern the facts from the opinions. However, even the facts become troubling because they consist of numbers without the perspective to understand their significance and are wrapped in existential angst. Consider the following excerpt from a June 13, 2018 article in the Washington Post, entitled “Antarctic ice loss has tripled in a decade. If that continues, we are in serious trouble.”
“Antarctica’s ice sheet is melting at a rapidly increasing rate, now pouring more than 200 billion tons of ice into the ocean annually and raising sea levels a half-millimeter every year, a team of 80 scientists reported… The melt rate in Antarctica has tripled in the past decade, the study concluded. If the acceleration continues, some of scientists’ worst fears about rising oceans could be realized, leaving low-lying cities and communities with less time to prepare than they had hoped.”
As reported, the reader assumes a melt rate that has tripled must be dire, and billions of tons of melting ice must be extreme. However, this perception changes if the facts are analyzed to provide perspective. An analysis shows that the original annual melt rate of 1.3 parts-per-million (ppm) has increased to nearly 4 ppm over 26 years. The news writer failed to inform us of these facts which provide perspective. The new melt rate is analogous to losing 4 dollars out of 1 million dollars. Losing slightly less than 4 parts in 1 million each year means that it will take over 250,000 years to melt entirely. No natural process is static, so we should expect variation over time. Most change is cyclical. Sometimes the ice is increasing and sometimes it is decreasing. The average person’s body mass fluctuates by 20,000 to 40,000 ppm each day. By comparison, Antarctica varying by 1-4 ppm over a year should be considered rock-solid stability in the natural world.
Ice Sheets Melting: What Happened Over the Past Century
Antarctica holds 91% of the world’s land ice, Greenland 8%, and the remaining 1% is spread over the rest of the world. Therefore, by understanding what is happening to the ice sheets in Antarctica and Greenland, we understand what is happening to 99% of the world’s land ice.
NASA is a good source for research about what is happening in Antarctica. However, two NASA agencies have recently published studies with conflicting conclusions. The Goddard Space Flight Center recently published research concluding Antarctica is not contributing to SLR. According to the study, snow accumulation exceeded ice melting, resulting in a 0.5-inch sea level reduction since 1900. Contrarily, the Jet Propulsion Laboratory (JPL) reports that the rate of Ice loss from Antarctica has tripled since 2012 and contributed 0.3 inches to SLR between 1992 and 2017. To cover the worst-case scenario, we can analyze the JPL study and provide the perspective to understand their results.
Over 26 years, Antarctica’s average annual mass loss was less than 0.00040% of its total. If Antarctica were a 220 lb man, his mass loss each year would be 0.4 grams or about eight tears. (Eight human tears weigh about 0.4 g.) At this alarming rate that makes our most elite climate scientists worried, it would take 250,185 years to melt all of the ice. It would take over 1,000 years of melting to yield 12 inches of SLR from Antarctica if we ignore natural variability and the cyclical nature of ice volume and assume the melt rate continues uninterrupted.
The best information we have about Greenland comes from a study in the journal Nature, estimating Greenland’s ice losses between 1900 – 2010. Using current ice volume estimates from USGS, we calculate the ice mass in 2010 was between 99.5% – 99.8% of what it was in 1900. Ice melt from Greenland in the 111 years contributed 0.6 – 1.3 inches to SLR. It would take over 1,300 years of melting to yield 12 inches of SLR from Greenland if we ignore natural variability and the cyclical nature of ice volume and assume the melt rate continues uninterrupted.
The average annual inland temperature in Antarctica is -57 °C and most coastal stations average -5 °C to -15 °C. The much talked about Western Antarctica averages several degrees below 0 °C. Southern Greenland does experience summer temperatures above 0 °C and seasonal melting. Northern Greenland stays below 0 °C even in the summer months, and the average annual inland temperatures are -20 °C to -30 °C. The temperatures in Greenland and Antarctica are not warm enough to support significant rapid ice melt. In the past century, we have 1 °C of retained atmospheric heat, and enough heat exchanged with ice in Greenland and Antarctica to raise sea level by 0.9 – 1.6 inches. Despite all of the reports in the media to the contrary, we have no real observations of any ice melt crisis. The past 111 years have been remarkable because of ice stability – not because of ice melting. We are 19 years into the 21st century with no evidence supporting an outcome much different from the 20th century.
Ice Sheets Melting: The Process
The lifecycle of an ice sheet begins as snow. Snow falls in the higher elevations and over time it compacts and becomes ice. The ice thickness in Antarctica is over 12,000 feet in the center of the continent and over 9,000 feet over most of East Antarctica. The force of gravity initiates a thousand-year journey where the ice flows from its heights back to the sea. At the end of this journey, when its weight can no longer be supported by the sea, it “calves” and becomes an iceberg. Some icebergs can float around Antarctica for over 30 years before fully melting. So, young ice is born inland from snow, and old ice dies near the coast from seasonal melting or after drifting for years as an iceberg. This process is the natural cycle of ice and not one which should create panic. During some periods we have more snow accumulating than ice melting, such as the period between 1300 CE and 1850 CE, known as the “Little Ice Age.” During other periods we have more ice melting than snow accumulating, such as the Medieval Warm Period and our present time.
In our present time, sunlight alone is insufficient to cause significant changes to ice sheet mass. Sunlight must act in concert with other effects such as cloud cover, water vapor and other “greenhouse” gasses such as CO2. Regardless of the mechanisms, the Earth system must do two things to melt more ice: 1) retain more heat energy and 2) via the atmosphere, transport this heat to the poles and transfer it to the ice. Additional heat energy in the system cannot melt ice unless this transport and transfer happen.
Ice Sheets Melting: Conservation of Energy
A 2007 study by Shepherd and Wingham published in Science shows the current melt rate from Greenland and Antarctica contribute 0.014 inches to SLR each year. For perspective, the thickness of 3 human hairs is greater than 0.014 inches. The results align reasonably well with the other studies mentioned. Despite the minuscule amount of actual SLR from melting ice, NOAA and the IPCC provide 21st century SLR projections that range from a few inches to several meters. The wide range of uncertainty leads to angst about catastrophe; however, the use of basic science allows us to provide reasonable bounds to the possibilities.
Before the start of the American Revolution, Scottish scientist Joseph Black (and others) solved the mysteries of specific heat and latent heat, which gives us the relationship between heat energy, changing states of matter (solid/liquid) and change of temperature. Equations 1 and 2 give us the mathematical relationships for specific heat and latent heat respectively:
(1) E = mc∆T
(2) E = mL
Where E is thermal energy (Joules), m is the mass (kg), c is the “specific heat” constant (J/kg/°C), ∆T is the change in temperature (°C), and L is the latent heat constant (J/kg). Specific heat is the amount of heat energy that we must add (or remove) from a specified mass to increase (or decrease) the temperature of that mass by 1 °C. Latent heat is the thermal energy released or absorbed during a constant temperature phase change. If we know the mass of the ice, water or atmosphere, it is easy to calculate the amount of energy it takes to change its temperature, melt it or freeze it.
Understanding that energy is conserved when melting ice, the equations above can be used to calculate the temperature effects that must be observed in the oceans or atmosphere to support an ice melt scenario. We can provide reasonable bounds and reduce the uncertainty.
See the reference section at the end of the paper for all sources and calculations.
Key #1: Importance of the Latent Heat of Fusion
It is essential to understand the latent heat of fusion because of the enormous amount of heat energy that is required to change the state of H2O from solid to liquid. Figure 1 shows the specific heat and phase change diagram for water. The blue line shows the temperature of water in °C (y-axis) plotted against the change in thermal energy in kJ/kg (x-axis). It shows how temperature and energy are related as we go from cold solid ice to boiling liquid water. The average annual inland temperature of Greenland is -25 °C and this is the reason for Point 1 on the line. If we start at Point 1 and progress to Point 2, this shows how much heat energy must be added to change the temperature of 1kg of ice from -25 °C to 0 °C. It is important to note that at Point 2, the ice is still 100% solid at 0 °C.

Figure 1: Water Phase/Specific Heat Diagram
The diagram reveals something interesting about the behavior of water. As we progress from Point 2 to Point 3, the water undergoes a phase change from solid to liquid. There is no temperature change as the ice becomes liquid water; however, a large amount of heat energy must be added. The energy that must be added to change the phase of water from solid to liquid is the latent heat of fusion. For melting ice, temperature alone does not inform us about what is happening to the system. To assess ice melting, we must understand the net change of energy. Whether we melt 1kg of ice or the entire ice sheet in Greenland, using Equations 1 and 2, we can easily calculate the energy required to do so. Going from Point 1 to Point 3 requires 3.86×10⁵ Joules of energy for each kg of ice mass warmed and melted. For simplicity, we call this quantity of energy “E.”
Figure 1 also shows what happens as we move from Point 3 (0 °C liquid seawater) to Point 4 (seawater starting to boil at 100 °C). It takes a measure of energy “E” to move between Points 3 and 4, just as it does to move between Points 1 and 3. Therefore, as shown in Table 1, the energy required to melt the ice is equivalent to the energy required to heat the meltwater to a boil at 100 °C. (Note: the fresh water from the ice is assumed to flow to the oceans.)
| Energy to melt 1kg of polar ice from -25 °C to 0 °C water | <– Is Equal To –> | Energy to raise the temperature of 1kg of seawater from 0 °C to 100 °C |
Table 1: Relating Energy Between Polar Ice Melt and Boiling Water
Key #2: Total Energy Required to Melt the Ice Sheets
Using Equations 1 and 2, we calculate that the total heat energy required to melt the ice sheets entirely is 1.32×1025 J. This value can be given perspective by calculating the increase in ocean water temperature that would result from adding 1.32×1025 J of heat. We know that deep ocean water below the thermocline is very stable in temperature between 0-3 °C. 90% of the ocean water mass is below the thermocline. The thermocline and surface layer above contains the ocean water that responds to changes in atmospheric heat, whether that be from seasonal changes or climate changes. Therefore, if we constrain the 1.32×1025 J of heat energy to the upper 10% of the ocean mass, we calculate the temperature increase would be 25.6 °C, assuming equal heat distribution for simplicity of analysis. This increase would make the surface temperature of equatorial ocean water close to 55 °C, similar to a cup of hot coffee. Polar seas would be perfect for swimming at nearly 25 °C. According to NOAA, over the past 50 years, the average ocean surface temperature has increased approximately 0.25 °C.
Another way to give perspective is to calculate the increase in atmospheric temperature that would result from adding 1.32×1025 J of heat to the atmosphere. First, we must understand some related facts about the atmosphere. Heat energy must be transported by the atmosphere to the polar regions, or no ice can melt. However, the atmosphere’s capacity to store heat energy is extremely low compared to the energy required to melt all of the ice. The ice sheets contain more than 900 times the thermal energy below 0 °C as the atmosphere contains above 0 °C, and therefore the atmospheric heat energy must be replenished continuously to sustain ice melting. Melting polar ice with heat from the atmosphere is analogous to filling a bathtub with a thimble. The low specific heat of air is one reason the atmosphere lacks heat carrying capacity. The other reason is its low mass.
Figure 2 shows the vertical profile of the Earth’s atmosphere. The red line in Figure 2 shows the temperature of the atmosphere in °C (x-axis) plotted against the altitude in km (y-axis). 75% of the mass of the atmosphere is contained in the Troposphere, where all life (outside of the oceans) exists on Earth. Figure 2 reveals that most of the atmosphere is far too cold to melt ice. We can ignore the Upper Thermosphere as the mass of atmosphere contained in that layer is negligibly small. Only the Lower Troposphere below 2.5 km altitude contains air at a warm enough temperature to melt ice. (See the region of the graph enclosed in the yellow oval.) 35% of the atmospheric mass exists below 2.5 km, and the average temperature is ~ 8 °C.

Figure 2: Vertical Profile of Earth’s Atmosphere
Using Equation 1 with E = 1.32×1025 J, the mass of the atmosphere below 2.5 km and solving for ∆T, we can calculate what the temperature of the air below 2.5 km would be if it contained the energy required to melt all of the ice. The atmospheric temperature would have to be 7,300 °C, which is 1,522 °C hotter than the surface of the sun. Life on Earth would be in jeopardy from the increased atmospheric heat long before all of the ice melted. While there are no plausible thermodynamic pathways to heat the Earth’s atmosphere to such temperatures, the calculations of energy required are accurate. According to NASA, the global average temperature over the past 50 years has increased approximately 0.6 °C.
Key #3: SLR From Incremental Atmospheric Heat Exchange with Ice Sheets
It is said, “you can’t have your cake and eat it too.” Similarly, you can’t have atmospheric heat and melt with it too. If the ice consumes heat, then the atmosphere cools. If the atmosphere retains its heat, then no ice melts. So, let’s examine some scenarios where we trade energy from the atmosphere with ice to see how much corresponding SLR we can get.
Using Equation 1, we can determine the change in energy for a 1 °C temperature decrease in the atmosphere below 2.5km. We can then apply this energy to the ice, assume maximum melting volume and translate that to SLR. For every 1 °C of atmospheric energy transferred to the ice, we get 0.4 inches of SLR. Some IPCC scenarios project a 4 °C rise in “global average temperature” in the 21st century, due to increased atmospheric CO2. An increase in temperature does not melt any additional ice unless the heat is transferred to the ice. If 4 °C of energy from the atmosphere is transferred to the ice, we get a corresponding 1.7 inches of SLR and an atmosphere that is 4 °C cooler. If we transfer all of the energy in the atmosphere above 0 °C to the ice, then we get 3.4 inches of SLR and a world where the entire atmosphere is at or below 0 °C. The global average temperature would be 6 °C less than the coldest experienced during the depth of a glacial period.
To raise sea level by 12 inches would require the atmosphere to heat up by 28 °C before exchanging that energy with the ice. As we would experience it, the atmosphere would have to heat up by some incremental value, then exchange that incremental value of energy with the ice, thus cooling the atmosphere, and then repeat this process until the 28 °C of atmospheric heat is consumed.
Key #4: Maximum Ice Melt Potential from Technology
Keys #1-3 don’t offer much to support the possibility of large quantities of ice being melted rapidly by natural causes. The next obvious question is, can humankind generate enough heat with our most advanced technology to melt a significant amount of ice rapidly?
The power of the atom is one of the most awesome powers humankind has harnessed. There are 8,400 operational nuclear warheads in the world’s nuclear arsenal, with a total yield of 2,425 Megatons of TNT. It is interesting to note that the energy contained in this nuclear arsenal is over 800 times the equivalent explosive power used in World War II. It is said that there are enough nuclear weapons to destroy the world a hundred times over. So, perhaps this is enough energy to melt the ice sheets entirely. For this exercise, we assume the nuclear weapons release their energy slowly – only fast enough to melt ice and no faster. For maximum melting, we evenly distribute all of the weapons in the ice. However, when we convert 2,425 MT to Joules, we get a number that is far below the energy required to melt all of the ice. The SLR we could get by using all of the world’s nuclear weapons for melting ice would be 0.002 inches. For reference, the diameter of a human hair is 2.5 times thicker than this. If we want all of the ice to melt, we need to duplicate each weapon more than 1,300,000 times. So, it looks like our current arsenal of nuclear weapons is no match for the ice.
What other sources of power does humankind have that could be used to melt a significant amount of ice? The annual global energy production of electric power is 25 petawatt-hours (25×1015 Whr) or 9×10¹⁹ Joules. If we could, through some advanced technology, transfer all electric energy generated over one year to heaters buried in the ice, and do this with no transmission or distribution losses, then how much ice could we melt? The answer is 0.02 inches of SLR (equivalent to 4 human hair diameters). This scenario would require that humans not use any electric power for that entire year, for anything other than melting ice. Humanity would have to forego the benefits of electric power for over 146,000 years to melt all of the ice, assuming static conditions in the ice.
Ice Sheets Melting: Analysis
Since 1900 we have 1 °C of retained atmospheric heat, and enough heat consumed by the ice sheets to produce 0.9 – 1.6 inches of SLR. From Key #3 we learned 1.7 inches of SLR results from trading 4 °C of atmospheric heat for ice melting. Therefore, as a worst-case approximation, if there had been no net ice melt since 1900, the atmosphere would have heated by approximately 5 °C. We can conclude that ice melting consumed 4 °C of heat, leaving the atmosphere with 1 °C of retained heat. We observed a 4:1 ratio of consumed heat to retained heat in the 20th century, worst case. For the best-case approximation, we use the lower estimate of 0.9 inches of SLR, which yields a 2:1 ratio of consumed heat to retained heat over the same period. In one of the more extreme scenarios, the IPCC climate model projects 4 °C of atmospheric temperature rise in the 21st century. For a 4 °C rise scenario, using the worst-case ratio of consumed to retained heat, we can estimate a 6.4 inch SLR over that period. In a more moderate scenario, the IPCC projects a 1.5 °C temperature rise. For a 1.5 °C rise, using the best-case ratio of consumed to retained heat, we can estimate an SLR of 1.4 inches. Unfortunately, none of the climate models have been able to predict the climate accurately, and none of them backtest successfully. We are one-fifth of the way through the 21st century and do not appear to be on course for the IPCC’s worst-case temperature projections. Therefore, it is reasonable to assume the results for the 21st century will likely be very similar to the 20th century, with 1-2 inches of SLR.
Detailed analysis of the claimed Earth energy imbalance is beyond the scope of this paper. The analysis presented here exposes the effects that must occur from an imbalance that leads to catastrophic melting. The ice must absorb large quantities of heat energy for sustained periods. Therefore, inland temperatures over Antarctica and Greenland would need to be maintained well above 0 °C for significant portions of the year. Atmospheric heat lost to the ice would need to be continually replenished to perpetuate the process. The oceans store heat energy, but the large mass of the oceans with the high specific heat of seawater blunts the possible effects from that energy. The energy that would raise the first 2.5 km of atmospheric air by 1 °C would raise the first 1,000 feet of seawater by only 0.0035 °C. The 2nd law of thermodynamics requires a temperature difference to transfer heat energy. Small increases in ocean temperature cannot lead to large movements of heat energy to an already warmer atmosphere. Finally, the system must transport more heat energy to the polar regions. In reality, the Earth maintains a very large temperature gradient between the equator and the poles. Our observations do not show gradient changes that would support significant additional heat transport. Without the increased energy storage and transport, and sustained polar temperatures well above freezing, catastrophic ice melt scenarios are not possible.
Ice Sheets Melting: Summary
Despite the overwhelming number of popular news reports to the contrary, studies of ice sheets melting over the past century show remarkable ice stability. Using the proper scientific perspective, analysis of ice-melt rates and ice-mass losses show the ice sheets will take hundreds of thousands of years to melt, assuming the next glacial period doesn’t start first. An application of basic physics shows that for every 1 °C of atmospheric heat exchanged with the ice sheets we get a maximum 0.4 inches of SLR and a correspondingly cooler atmosphere. Over the 20th century, we observed a worst-case 4:1 ratio of consumed heat to retained atmospheric heat. It is proposed that this ratio can be used to assess potential ice-melt related SLR for a hypothetical atmospheric temperature increase scenario over the current century. Using a reasonable range for all of the variables we can estimate an SLR of between 1.4 – 6.4 inches, but our current observations support the rise being toward the lower end of that range.
The atmosphere and oceans do not show the increase in energy necessary to cause catastrophic SLR from rapidly melting ice. Humankind does not possess the technology to melt a significant amount of ice because the energy required is enormous and only nature can meter out this energy over very long periods. With the proper scientific perspective about the amount of energy required to melt ice, it should be much more difficult for Climate Alarmists to scare the public with scenarios not supported by basic science.
References
NASA Study: Mass Gains of Antarctic Ice Sheet Greater than Losses: https://www.nasa.gov/feature/goddard/nasa-study-mass-gains-of-antarctic-ice-sheet-greater-than-losses
Ramp-up in Antarctic ice loss speeds sea level rise: https://climate.nasa.gov/news/2749/ramp-up-in-antarctic-ice-loss-speeds-sea-level-rise/?fbclid=IwAR2Vnkbxxa-NTU_v0lRUUGGDffMs4Q6BGvHX-KHzcHM7-q2B7IO59wCEiQc
Sea Level and Climate (Fact Sheet 002-00): https://pubs.usgs.gov/fs/fs2-00/
Spatial and temporal distribution of mass loss from the Greenland Ice Sheet since AD 1900: https://www.nature.com/articles/nature16183
Recent Sea-Level Contributions of the Antarctic and Greenland Ice Sheets: http://science.sciencemag.org/content/315/5818/1529
All of the constants and calculations are provided in the associated Excel file located here: https://wattsupwiththat.com/wp-content/uploads/2019/04/Ice-Atmosphere-Ocean-Energy-20190407-1-1.xlsx
Actual, real, climate science … going back to the fundamentals of thermodynamics.
if only this were taught in schools, and written up in the world’s media.
I forwarded this to AP science reporter Seth Borenstein. He toes the alarmist line in his coverage, which is very discouraging.
Pathetically, he’ll probably try to claim the models are correct, but the melting ice took the heat to the oceans.
Thanks to William Ward for putting this into perspective.
Alarmist Victoria Bell at the Daily Mail needs to be confronted. She writes, “Greenland’s ice is melting six times faster.” She does, however, comment that “Global sea levels could rise as much as 1.2 metres (4 feet) by 2300 even if we meet the 2015 Paris climate goals, scientists have warned.” Note 2300 AD – in 181 years time! Man’s ingenuity to cope with this kind of rise has been seen for many years in the dykes in the Netherlands – NO major flooding since 1953!
https://www.dailymail.co.uk/sciencetech/article-6950663/Greenland-ice-melting-six-times-faster-1980s.html
Michael in Dublin
Most numerically-handicapped wordsmiths don’t realize that if one multiplies a very small number by a single digit you still end up with a very small number.
A bit of a tautological statement. Innumeracy is defined as not understanding numerical concepts.
IMHO it ought to be as embarrassing as illiteracy. The publishers of the periodicals should be concerned that they are employing innumerates.
2300 – 2019 = 281 years. :p
Thanks, my slip up. This gives more support to the point I made. Meteorologist are hoping with the latest computers and software they will produce more accurate weather predictions – up to two weeks – but alarmists want us to trust their models about will happen decades and even longer into the future.
real science?
Rather pretentious calling this blog article a “paper” in a vein attempt to give it more credibility. It is not even in the format of a paper.
Calculating the temperature of the atmosphere to melt all the ice sheets is so silly and irrelevant, it’s not even worth reading further. No much real science going on here. Very disappointing. The title looked interesting.
Greg
Vain: : having or showing undue or excessive pride in one’s appearance or achievements : conceited
Vein: blood vessel especially : any of the tubular branching vessels that carry blood from the capillaries toward the heart
The response was basic. ‘Silly’ is the level of the alarmists who seem to believe that warm air over the oceans and Antarctica with a few watts of IR will result in Antarctica melting. Or perhaps you believe in the melting and SLR also and are disappointed to see it so simply refuted?
Who ever suggested that it was the heat capacity of the lower atmosphere which would melt Antarctica ?
That’s what is known as a straw man argument. It’s basically nonsense even if the “basic physics” is correct.
What I find unfortunate is that our host is allowing what used to be a very good technical site to be degraded by this kind easily debunked nonsense. Pretentiously calling it a “paper” was a red flag as to what to expect.
This paper makes perfect sense and is based on sound principles that most scientists and engineers should have been taught in their first year at university .
Melting ice requires a lot of energy and when both the Arctic and Antarctic are without sunlight for six months each year there is no heat in the intense cold dark atmosphere .
If you took the time to read and understand what has been put in front of you ,you would see the that accelerating sea levels are science fiction .
It just cannot happen .
Rising sea levels are a scare story.
It will not happen so get over it and find something else to annoy people with .
“vein attempt” ????? LOL
Some with nothing important to say like to nit-pick. Way too much of that occurs here.
Suffice to say, I disagree.
How might you re-write the article, to meet your standards?
Well, he’d need a box of Crayons to start…
So that is what is required for “science”?
Writing in proper “format of a paper”
Insult blog articles with words like “vein{sic} attempt” and “pretentious”
Sling insults based upon your personal opinion?
Especially when you haven’t bothered to read the article?
Happily, the article is all science and lacks those personal opinion slights so common in the imitation science conducted by climate scientists.
Salute!
You can not be serious, man.
The alarmists are claiming that 2 or 3 degrees is gonna melt all the ice, are they not?
Unless the warm ocean can reach high into the mountains, then what mechanism are they giving credit to?
—————-
I did see one thing I question, but somewhere in the “paper” Greenland and Antarctica melting had close to the same effect upon SLR. Maybe a typo?
Gums sends…
True, it is not just about the temperature of air. So many factors and increasing numbers of feedback loops all play a part. All of Earth’s energy systems are involved.
No they are not. Where did you read that?
Maybe that is something the author should have looked into before constructing his straw man that it was the heat capacity of the lower atmosphere.
For the record I doubt we will see more than 2 feet of SLR before the end of the century. One foot is more likely.
Salute Greg!
I admit to taking poetic license WRT all the ice melting. Good call, However, nothing close to what some “journalists” are cranking out in their rags. A few politicins as well.
I could not discern from the “paper’ an ice melting mechanism for the landlocked glaciers.. Some here are claiming that “pure” radiative effects will not warm up things as much as the IPCC and others are claiming. Hence my flippant remark about ocean heat affecting the inland ice being accululated from snow.
Gums sends…
Some so-called scientists have made ridiculous claims with regard to melting land ice, such as the guy in Australia who just a few year back claimed that Antarctica would melt away and there was nothing we could do to stop it, it was already locked in.
Other have claimed that the polar regions are the only place life will be able to survive in the near future.
Let’s not minimize the extent and level of ridiculousness that has been given voice to by alarmists, including some in important positions and with advanced degrees.
Ten years ago virtually the entire climate orthodoxy were making over the top claims about northern hemisphere winter snow, and Arctic sea ice.
Plenty of people have made plenty of incredibly dumb statements, and made them while asserting little if any uncertainty and without qualification.
https://wattsupwiththat.com/2015/04/11/claim-arctic-and-antarctic-will-melt-in-the-next-decade/
https://www.businessinsider.com.au/australian-scientists-say-antarctica-is-on-the-way-to-being-25-ice-free-2017-6
And beyond the statements from alarmist scientists have been the increasingly shrill and ridiculous statements from journalists and some politicians, which have been almost universally ignored by the mainstream climate science community.
IOW, there has been almost no vocal pushback when people who are not scientists have exaggerated and misconstrued the findings of actual scientists.
And silence is pretty close to consent.
Gums,
You said: “I did see one thing I question, but somewhere in the “paper” Greenland and Antarctica melting had close to the same effect upon SLR. Maybe a typo?”
See the studies cited as source material. The links are provided. Here is another link:
https://climate.nasa.gov/news/2836/antarcticas-contribution-to-sea-level-rise-was-mitigated-by-snowfall/
There are many studies. Some of the results are contradictory. For example, did Antarctica reduce SLR by 0.4 inches or increase it by 0.3 inches? You have to look at the time frames of each quoted estimate. Greenland was estimated to be between 0.6-1.3 inches over 111 years.
What’s vain (not vein) here, is Greg’s attempt to force the world into his narrow mold.
I see that Greg can’t address the CONTENT of the article, that contains numerous internal links to outside official sources, which is why he tried to denigrate it with a bogus argument about whether it is a paper or not.
Pathetic……
Greg:
1. Didn’t read the entire article.
2. Can’t spell “vain” in context.
3. “‘No’ much science going on here.”
(I think you meant “Not”).
4. Used two non-sequiturs.
5. Didn’t address a single point the article made.
Excellent job, Greg.
Seconded, Mr R!
Mr. Ward, I appreciate the clarity of this paper. Simple language, devoid of abbreviations (SLR is obvious in the context of this paper). This is the kind of paper one can take to the layman, and he can understand. While Greg derided discussion of atmospheric temperature melting the ice sheets, we’ve had to put up with the MSM comparing Hiroshima bombs to the heating of the atmosphere, and calving comparisons to Manhattan. This has scared some (Greg included, I believe) and useful to show how silly such comparisons are. This paper will be used by me in future discussions with people who need just a little more science to understand how silly this aspect of AGW is.
I bolded ‘paper’ because I knew it would irritate someone….
Greg,
It is rather sneering sophistry, calling this paper ‘pretentious’, in a vein (sic) attempt to give it less credibility. Helping people understand the importance of latent and specific heat calculations, as relates to solid (ice) and liquid water, is fundamental to understanding climate science, the importance of which apparently is something you abjur.
Setting aside your poncing petulance, I strongly urge William Ward to continue his excellent contributions here at WUWT.
I did not say the “paper” was pretentious, I said calling it a paper was pretentious. It’s a blog article.
You are free to comment if you see any errors or if you have a differing opinion. That is real science.
Thank you Greg.
I have always very high respect to persons who openly manifest their stupidity.
It´s much easier to estimate the level of conversation which maybe is understandable to you.
It would be insulting to compare you to my grandson who is five years old. But our second years school class eight year old is appropriate to define your ability to understand your reading skills.
You must try harder. If the title is interesting, why not waste some of your precious time to read the whole text?
Do you not understand that the whole topic is global warming? And obviously atmosphere is in the main role.
And the “sky is falling” Greg! It has to be, or you will have opened your mouth and removed all doubt!
Yo’re So Vein
By Carly Simon
You walked into the party
Like you were walking on a yacht
Your hat strategically dipped below one eye
Your scarf, it was apricot
You had one eye on the mirror
And watched yourself gavotte
And all the girls dreamed that they’d be your partner
They’d be your partner, and
You’re so vein
You probably think this song is about you
You’re so vein,
I’ll bet you think this song is about you
Don’t you?
Don’t you?
Oh, you had me several years ago
When I was still naive
Well, you said that we made such a pretty pair
And that you would never leave
But you gave away the things you loved
And one of them was me
I had some dreams, they were clouds in my coffee
Clouds in my coffee, and
You’re so vein
You probably think this song is about you
You’re so vein, you’re so vein
I’ll bet you think this song is about you
Don’t you?
Don’t you?
BTW, There are on-line scientific periodicals, such as PLoS ONE, published by well-known scientists. Not all scientific papers have to be printed on paper to be valid.
Although the author’s argument and numbers (e.g., 1.32 x10^25 J to melt all polar ice) seem very impressive, he does not mention the fact that amount of energy from the Sun is acquired by the Earth in only a few days. So the issue is not whether sufficient energy might be available over decades to melt substantial amounts of ice. The salient issue is the RATE at which energy could be transferred from around the Earth to the ice. On this point the author also does not mention that the oceans both receive a large portion of this solar energy and due to their greater mass and heat capacity are capable of moving more energy more quickly to the ice than can the air.
The greater concern of climate science is not about melting much of Antarctica’s ice directly, but warmer ocean currents undermining poorly grounded glacial terminals in West Antarctica(part of which is below sea level), followed by floating ever larger blocks of glacial ice northward for more rapid melting.
This is a complex scenario and every analysis should be critically viewed.
donb,
Thanks for your comments.
I address the rate by examining how much ice melted over the past 111 years and how much the atmosphere heated during that time. As Kevin Kilty pointed out in his comments, the energy from the Sun goes to keep the current temperature of the system. Despite all of the cries to the contrary, we have no observations of a significant ocean or atmosphere temperature rise, nor significant ice melting. There have not been substantial changes to the incoming solar radiation, so it is incumbent upon someone to explain how more ice will melt. The Earth has been processing that energy with specific effects, so what is going to cause different effects?
As I mention in the Analysis section, the oceans receive energy, but their mass and specific heat capacity mean that the water temperature will change little relative to how much the atmosphere’s temperature changes. The 2nd law of thermodynamics limits the effect of the small water temperature rise. Sure, “warmer” water can move towards the poles, but by “warmer” we are usually referring to 0°C or 1°C instead of -1°C. That energy has to move into the atmosphere to affect the ice. What is the mass of the atmosphere around the poles with this warmer temperature? It is a small fraction of the mass I used for my calculations.
What you mention about “poorly grounded” ice in the Western Antarctic – now referred to as MICI – Marine Ice Cliff Instability, is very poorly supported by science. We don’t have much more than the suggested possibility and recent studies I have seen cast doubt on those possibilities. What is proposed in the MICI threat is equivalent to suggesting that ocean waves lapping the coast of Charleston, South Carolina affect ice as far away as Jackson, Mississippi. The topic of MICI is too broad to address here, and there isn’t much information to analyze.
@Michael Irwin. Ward,
I suggest you over-emphasize average and bulk values in your examinations, and not enough the time and space variations that occur in energy delivered. For example, the Arctic zone experiences cycles (e.g. the AMO) which significantly vary the total energy carried there. NASA data from the AQUA satellite over 2003-2017 show that the Arctic has warmed by >1 deg-C per decade, Antarctic has cooled by >0.5 deg-C per decade, and the latitudes in between show almost no temperature trend. Ocean currents possessing very different temperatures do shift (e.g., ENSO events). If warmer ocean currents move into West Antarctica over a period of years and decades, solar insolation need not increase to increase incoming energy at west Antarctica and glacial melting. Such warmer ocean currents have been recently measured under ice shelves at West Antarctica. And the RATE of sea level rise apparently has risen and fallen several times over the past century (over ~zero mm/yr to > 3 mm/yr).
The important questions are: 1) What proportion of these effects are caused by a warming Earth, and 2) how much of such space and time variations in regional temperature are caused by natural processes versus a human cause. My point is that a bulk approach to Earth’s energy, as your offer, cannot differentiate between these two.
donb,
You said: “I suggest you over-emphasize average and bulk values in your examinations, and not enough the time and space variations that occur in energy delivered.”
I think you must misunderstand my method of analysis, which is not about emphasizing or de-emphasizing. My method of analysis utilizes the law of conservation of energy, a fundamental principle of physics/thermodynamics. I’m aware of AMO, PDO, ENSO, etc. All of the complex interactions of these cycles have a net effect over time. The results of all of these cycles over time are captured in my analysis.
You ask: “1) What proportion of these effects are caused by a warming Earth, and 2) how much of such space and time variations in regional temperature are caused by natural processes versus a human cause.”
All of our reconstructions of climate for the past few glacial-interglacial cycles shows that there is nothing unique or even remotely remarkable about our current climate. Our current climate is rather dull by comparison. Have you considered Dansgaard Oeschger Events, for example?
https://en.wikipedia.org/wiki/Dansgaard%E2%80%93Oeschger_event
Twenty-five times during the last glacial period the global temperature increased by 5-8°C in just a few decades. After an event, the temperature then slowly returned to glacial conditions. That makes 1°C in 100 years look very tame. If you have a good understanding of the past climate – even since the end of the last glacial maximum, then its not possible to be even slightly alarmed about our current climate unless willful delusion is involved. If scientists can’t figure out what is natural climate variation then how can they determine how much is caused by humans?
This truth is that we don’t have the instrumentation, data or knowledge to answer the questions you pose.
The polar ice sheet mass is remarkably stable. The junk-science news tells us the opposite. Even with it’s new highly accelerated melt-rate, Antarctica is stable to 4ppm/yr. Greenland is stable to 50ppm/yr. It is challenging to find laboratory grade instruments with this kind of stability! Nothing in nature is entirely static. It is just bizarre how people have been convinced that it ever was or is supposed to be static.
@Michael Irwin.Ward
You have not understood my point. Your calculations refer to the bulk Earth. But the Earth varies considerably in space and time in its temperature and other climatic conditions, and also in its rates of solar energy gain and energy loss. If Earth’s temperature were the same everywhere, with the same bulk energy as presently, then there would be no ice forming or melting anywhere. That is not the case. Ice tends to form when and where it gets colder and melts when it gets warmer. Thus, if the Greenland and Antarctic caps get warmer, because more energy is transported there than previously (still no bulk Earth energy change), whatever the mechanism, then glacier melting rate will increase. It is how energy is distributed and how that distribution changes that is critical. And incoming solar energy, considered over years of time, far exceeds energy changes in polar ice that would be required to increase their melting. Your bulk calculations of energy budget, no matter the thermodynamics, cannot show that.
donb,
You said: “Ice tends to form when and where it gets colder and melts when it gets warmer.”
Have you spent much time looking at temperature data for stations in Antarctica or Greenland?
I recommend this NASA site: https://data.giss.nasa.gov/gistemp/stdata/
Scroll to the bottom of that page and work with the interactive 3D Earth model. Each dot is a weather station. Click on a dot to see the annual mean temperature history for that station. Average inland temperatures in Antarctica are -30°C to -60°C. In Greenland, the average inland temperatures are -20°C to -30°C. It’s always cold enough inland to create ice. It is never warm enough to melt ice. How do you think you can melt ice with air when it is below 0°C?
The coastal temperatures around Antarctica are between -10°C to -15°C. Small increases in atmospheric temperature cannot cause melting in these areas. In the far northern Antarctic Peninsula temperatures average -5°C to -1°C. It is possible that a temperature increase of several degrees C average can cause melting in some areas, but the amount of ice exposed to those temperatures is small.
The northern Greenland coast averages -10°C to -15°C, so like Antarctica, small increases in atmospheric temperature cannot cause melting in these areas. The southern coast averages -5°C to 0°C. This area is more susceptible to melting from warmer air, but you have to consider the mass of air and amount of energy involved in the exchange.
Ice mass is lost not only from melting but also from evaporation and glaciers calving. Ice melts not just when the air temperature is above 0°C but when it is exposed to direct sunlight, even when it is very cold. But the higher latitudes don’t get much direct sunlight, especially during the hemispheric winter. Losing ice mass is not a sure indicator that the air temperature is “warm” or above 0°C. Ice mass loss can come simply because the amount of snowfall is less than the solar melting, evaporating and calving.
You said: “Thus, if the Greenland and Antarctic caps get warmer, because more energy is transported there than previously (still no bulk Earth energy change), whatever the mechanism, then glacier melting rate will increase.”
Once you become familiar with the temperatures that exist in both Greenland and Antarctica, you see that “becoming warmer” is not trivial. With no net (“bulk”) energy change, where is the heat to warm the ice caps going to come from? It has to come from somewhere else on Earth. As you consume heat to melt ice, that means somewhere else on Earth it will be getting correspondingly colder, as a function of E=mc∆T. The typical oversight that happens with the claims of potential ice melt (and the subsequent reporting about it) is to ignore the fact that melting ice consumes energy – and a lot of it.
There is no situation in which the conservation of energy is not operational. That point seems to escape you based upon what you say.
You said: “And incoming solar energy, considered over years of time, far exceeds energy changes in polar ice that would be required to increase their melting. Your bulk calculations of energy budget, no matter the thermodynamics, cannot show that.”
We must account for all energy that goes towards melting ice. The solar energy you mention is currently being consumed by something (or being reflected to space). It can’t be directed to melting ice without making that something else equivalently colder.
donb, I’m spending extra time on this because you are providing a perfect example of how the reporting on the subject is so misleading. The reporting tells us that “warming” has occurred in an area and the insinuation is made that the area represents the whole. The reporting doesn’t tell you that the temperature is still far below freezing or that the amount of energy supplied by the “warming” is incredibly small. The news writers are utterly oblivious to the volume of the ice and the amount of energy it takes to melt the ice. I recommend you go back and contemplate the law of conservation of energy in all of the scenarios that concern you.
“that amount of energy from the Sun is acquired by the Earth in only a few days.”
______________________________________________________
Not ‘acquired’. And not the whole story:
that amount of energy from the Sun is passing the atmosphere in diverging directions in “only a few” days. on daylight sides.
that same count of “few” nights the atmosphere passes energy / in diverging directions / to the unlit dark side of the outer solar space.
donb:
…”Although the author’s argument and numbers (e.g., 1.32 x10^25 J to melt all polar ice) seem very impressive, he does not mention the fact that amount of energy from the Sun is acquired by the Earth in only a few days.”
On the contrary, the article excellently refutes the ‘Anthropogenic” (man made) contribution to “Global Warming” (Climate change..whatever),
correctly demonstrating that mankind’s contibution to global energy is at least 6 orders of magnitude LESS than either the thermal capacity of the atmosphere, ocean or icecaps, let alone the supply of Solar energy.
Cheers
Mike
Greg said:
“Calculating the temperature of the atmosphere to melt all the ice sheets is so silly and irrelevant”
Some of us think that calculating CO2’s contribution to ice sheet melt approaches irrelevancy. It is refreshing to have an examination of energy exchange to put ice melt into perspective. Alarmists focus on temperature while energy should be the focus.
Mr. Ward noted that the energy required to convert ice at -25C to liquid water at 0C is about the same as to heat that same mass of water from 0 to 100C (Figure 1). An important energy factor he did not mention it that of vaporization. It requires about 5.4 times the energy to convert a unit mass of water to vapor as it does to heat the water from 0C to 100C. (clouds are very important in several ways)
Hello Farmer Ch E retired,
First, I’m wondering if your handle means you are a retired chemical engineer who now farms.
Regarding the latent heat of vaporization, from your comments, I’m pretty sure you understand I’m not converting any steam in my melting ice vs. boiling water comparison. I think you are saying that the latent heat of vaporization is important to cover as it relates to water vapor in the atmosphere. If so, I agree, but I didn’t include it for two specific reasons.
1) I couldn’t cover it without adding pages of text.
2) The effects factor into the overall assessment, or maybe better said the analysis captures the effect. The vaporization moves energy from the sea to the water vapor, and then to the atmosphere or land somewhere else. As it relates to the ice sheets, the vapor carries heat to the poles, but then it transfers it to the colder atmosphere, but due to the temperatures there, the water vapor converts to snow (which becomes ice). That heat eventually escapes to space. The analysis is for the net ice gain or loss, so this captures the net difference in energy through the process. I’m not aware of any measurable or predictable way to account for cloud formation or effects in the massive future ice melt scenario. Within a range of effect, I assume it is common between the last century and this century – so common to the scenarios, and therefore doesn’t need direct attention for a rough assessment.
My goal was to simplify the analysis to provide reasonable bounds to the outcome. Someone would have to show how other factors can significantly alter the rough bounds arrived at by the methods I used.
Mr. Ward – yes I’m a retired Ch E but no longer farm. Did grow up on a cattle & grain farm in MT and for 7-yrs, managed my father’s commercial cherry orchard after he moved out of state & was in his 80s. Thanks for your reply. My intent was to point out to Greg that considering energy was important and that adding vaporization to the equation complicates the energy balance significantly (as does sublimation). Fred Haynie makes a good point below.
Hello Farmer Ch E retired,
Thanks for your reply. I understand your point – and yes, Fred does make an excellent point as well.
Montana – so much land – so few people!
Too bad Greg took the approach he did. Maybe he had something valuable to say that would have challenged what I presented and we could have had a constructive discussion. I don’t see the point of engaging someone behaving like a troll.
From another retired Ch E.
When the Antarctic summer sun hits the kilometer thick ice, the ice at the surface vaporizes at the atmospheric frost point temperature. So it is the amount of water vapor in the air that is controlling the surface temperature, not CO2. You can confirm this by analyzing NOAA’s hourly met and CO2 data from their South Pole observatory.
Truly enjoyed the application of real, accepted science to these misunderstood issues. Thermodynamics indeed! Wish we had this article and its references in an easily distributed pamphlet to hand out every time I hear someone talk about SLR issues and the melting poles. Tie this analysis to the geological record of the earth and critical thinking and common sense can be unleashed on the planet!
Ice melting and sea-level rise has to be the lamest of the scare-mongering topics. Stick to increased tornadoes and hurricanes (neither are increasing). Increased earthquakes and tsunamis work too, except they have nothing to do w/climate, but still works w/the sycophants. Try asteroid strikes too — those are scary.
Some one please tell dear little Greta
Dear little Greta and her acolytes do feelings, not numbers.
Finally one UK government minister that is not enchanted by Greta the preindustrial little ice (age) princess
“Liam Fox, the international trade secretary, has been accused of legitimising climate change denial. He was criticised by Labour and the Lib Dems after he released a statement implying that scepticism about climate change being driven by man-made carbon emissions might be justified. Subsequently he said that he “respects” the scientific consensus on climate change. But his office was unable to confirm that he agreed with it.”
“during periods over the past 10,000 years, sea level has been several meters higher than today. ”
I did not realize this. What is the reference for this information. Thanks.
“several meters higher”
I don’t think really “short” periods of tsunamis or hurricane instigated tidal surges count.
Most of the last 10K years has been warmer than it is today. Presumably the sea levels would have been higher during those periods.
S. Geiger April 25, 2019 at 6:28 am
“during periods over the past 10,000 years, sea level has been several meters higher than today. ”
I did not realize this. What is the reference for this information. Thanks.
____________________________________________________
look for yourself:
the ancient port of roman empire is now 2 miles inland.
Since min. 2000 years sea level falls:
“Twenty miles southwest of Rome and now some two miles from the Mediterranean shoreline,
obscured by agricultural fields, woodlands, and the modern infrastructure of one of Europe’s busiest airports, lies what may be ancient Rome’s greatest engineering achievement, and arguably its most important: Portus. Although almost entirely silted in today, at its height, Portus was Rome’s principal maritime harbor, catering to thousands of ships annually. It served as the primary hub for the import, warehousing, and distribution of resources, most importantly grain, that ensured the stability of both Rome and the empire.”
____________________________________________________
You did not realize this. What is the reference for this information: Here’s to you, prego.
https://www.romanports.org/en/articles/ports-in-focus/181-portus-rome-s-imperial-port.html
Yeah, I cannot find any data to support this. What may be confusing is either the time period “last 10,000 years” or possibly confusing local sea level with global sea level.
If you go further back in time, you can find higher sea levels.
If you look at sea level at a specific place, you can also find higher sea levels – like around the Gulf of Mexico – but these could have been caused by ocean currents or the lowering of a land form.
If you look for global sea levels, I cannot find any period where there were higher GLOBAL sea levels than today in the last 10,000 years. Would also be interested in a reference if this is indeed not a mistake.
SEA LEVEL – HOLOCENE
https://www.researchgate.net/figure/A-Recent-sea-level-change-curves-1-Compton-2001-2-Martin-et-al-2005-3_fig6_253414593
https://www.researchgate.net/figure/The-eustatic-curves-of-Fairbridge-14-Shepard-41-and-Moerner-19-Purple-field-gives_fig4_227185974
Robert of Texas,
Thanks for your comments.
I just replied to S. Geiger with a link to 80 papers showing higher Holocene sea levels. Perhaps the moderators have to review the link before it shows up, but I assume it will post soon. All continents are represented in the various studies.
You said: “…confusing local sea level with global sea level.”
I think it is correct to say that sea level is always (by definition) local. The midpoint between high and low tide referenced to a fixed point on the land defines sea level. Changes to sea level at a location are a function of the land subsiding or rebounding, changes to the currents, thermal water expansion, shifting coastlines, and of course, additional water in the oceans from melted glaciers and groundwater.
When we discuss global sea level change, this refers to eustatic sea level change, which is the sea level that results from additional added water. There is not a single value that can be used for land elevation changes, thermal expansion, currents, etc.
I think there are a couple of ‘0’ missing.
S. Geiger

Yes, I questioned that when I saw it too.
This graph doesn’t provide much support for the claim:
“Several” is stretching things. There is good evidence that sea-level in the Pacific was 1-2 meters higher during the middle Holocene. The difference was apparently less elsewhere. There are lots of references, here for example:
https://agupubs.onlinelibrary.wiley.com/doi/pdf/10.1002/2014GC005272
I’ve read papers on archeological digs just north of the Gulf of Mexico that show the shoreline was 50 miles north of present day 4-6000 years ago, implying the sea level was 6 feet higher.
Query “Holocene Highstand”.
Richard T
OK, I did waste some time reading articles found with a search for “Holocene Highstand.” I didn’t find anything supporting “several meters.”
Hello Clyde – see the link I provided to S. Geiger, showing 80 papers with findings in support of my statement. What do you think?
Hi William,
Knowing you, I should have known that you had crossed your t’s and dotted your i’s. Thanks for the links. What I found interesting were the two articles suggesting an Antarctic highstand of 15 to 18 meters! This is so out of line with the other work that I’m suspicious that some sort of isostatic adjustment is in play there. But, in summary, there seems overwhelming evidence that the oceans were higher than currently during the last 10,000 years.
Hello Clyde,
It’s great to talk to you again. I know you are a geologist, so what I’m about to say is basic knowledge for you, but I mention it to fill out the discussion for others and to see if you have any interesting thoughts.
I think the entire subject of sea level, whether we discuss a period from10k years ago or present time, is full of complications. Isostatic rebound is one of them, and it affected the conditions 10k years ago and still today. I think a careful reading of each paper would be in order before we could understand how the results were arrived at. Did the authors ignore rebound or did they add-in a rebound compensation factor? With all of the land moving in different directions and rates it is rather tricky to get to the answer we need to know: how much water is entering the oceans and where is it coming from? Most of the “good” studies show 0.35mm/yr of SLR from glacial melt. The usually ignored component is groundwater. As you know, the groundwater mass is estimated to be 40% of the ice sheet mass. It isn’t frozen, and humans do pump a lot of it into the seas. The pumping causes the surrounding land to sink, changing sea level.
I don’t know if you saw my comments, but Nils-Axel Morner is an excellent single source for the subject of SLR. He points to Nyborg Denmark as the “hinge” (or fulcrum) during the last glaciation. North of this point the landmass depressed up to 1,500 feet under the weight of the ice sheets. South of that point, the land rose up a similar amount. For the past 20k years, this has been slowly returning to its “original” state. He claims Nyborg has been stable for thousands of years and therefore is the ideal reference for SLR. Using Nyborg as the reference, his analysis shows about 1mm/yr of eustatic SLR currently. The 1mm/yr being made up from melting ice and groundwater returning to the sea. The satellite data + the subsequent calculations give us 3.5mm/yr, which Morner dismisses.
Understanding all of this isn’t that difficult, but it takes a few minutes to wrap your head around it. Unfortunately, the public is just fed incorrect data, with wild unsupportable extrapolated futures based upon it. I mentioned the higher seas from 10k years ago to provide perspective. Higher seas were possible before human-generated CO2. Seas can rise *and* they can also fall significantly, both from eustatic effects and from cumulative effects (land, currents, thermal expansion, etc.). Even if we don’t have all of the exact answers, gaining perspective makes one more immune to Alarmists’ tactics.
Ps Clyde,
Now that I wrote it, I can’t find the references for the 1500 foot vertical displacement figure mentioned by me. It was not Morner, although you may think that based upon how I wrote it. It was a different source. I have seen figures from several hundred feet to 1500 feet for glacial related crust displacement. If you have better data or sources, then please share.
Again for perspective, understanding this displacement and subsequent rebound fills in the details of the picture – and shows us more thought has to go into SLR besides a number and a lot of hand wringing.
William
The only comment that I have is that I too believe that pumping aquifers is contributing to sea level rise, yet it is ignored generally.
[ https://www.usgs.gov/news/usgs-high-plains-aquifer-groundwater-levels-continue-decline ]
It is complex because the water from the aquifer isn’t just pumped into a river. It is used for irrigation and some of it migrates downward, but much of it gets vaporized through evaporation and transpiration. The water vapor typically precipitates out within a few days and some of it will be captured by the ground and plants downwind from where it first appeared. Rinse and repeat! Anecdotally, a now-deceased aunt and uncle once related to me that when they first moved to NW Nebraska, before pivotal irrigation became widespread, a cold glass of lemonade in the Summer would not ‘sweat’ noticeably. Sometime years later, the glass of cold lemonade would develop abundant beads of water. In the 1950s, everyone in Phoenix depended on ‘swamp coolers’ to cool their homes and even some cars. Today, refrigerative cooling is the standard, presumably because the humidity is now so high that evaporative cooling is no longer effective.
Now, I have long felt that adding water vapor to the air through irrigation (and building reservoirs with a large surface area), contributes ‘anthropogenic’ water vapor, with its potential for impeding IR up-welling. A meteorologist once told me that anthro’ water was unimportant precisely because it would precipitate out in less than a week. Were it a single pulse of WV, it is true that it would disappear quickly. But, what we are dealing with is continuous recharging of the water vapor from agricultural fields and reservoirs. So, I think that large-scale extraction of water from aquifers has two effects. It directly increases the volume of ocean water, and it contributes to warming, which causes thermosteric increase in the level of the oceans.
BTW, should you want to communicate privately, offline, feel free to contact me at “c underscore spencer123 at att dot net “.
Clyde
S. Geiger,
Thanks for reading the post and for the question. Here is a link to 80 papers showing Holocene sea levels several meters higher than today. The research covers every continent, so this appears to be a global phenomenon.
I have more sources of information on this if you are interested, but this should be enough for a first pass answer.
https://notrickszone.com/2m-higher-holocene-sea-levels/#sthash.eEWjhK2Y.dpbs
Thanks. As I mentioned, that is news to me (and quite surprising, IMO). I will look at the papers in the referenced articles.
Not all those 80 references are relevant. The ones from Norway, Denmark, Scotland, Ireland, New Foundland and of course Antarctica are affected by postglacial isostatic uplift. The majority are valid though.
If sea level was indeed several meters higher in the past 10k years, we should expect that large portions of land surface that are high and dry today, were under water at that time.
This includes large parts of places like Florida, and south Florida in particular.
I do not think there is any evidence that south Florida has been inundated by the ocean in the past several thousand years.
The evidence is fairly solid that the last time this happened was some 2,5-4.5 million years ago.
Biomes can be dated, species that are indigenous to an area, whether flora or fauna, give a fairly solid indication of the range of conditions and how long they have existed.
There are tree species that are native to only south Florida, and unless they migrated north and then back south, it is basically impossible for the area in which they exist to have been underwater since they are known to have diverged from related species in other parts of the region.
Fossil groundwater gives another indication of whether this could be the case.
Evidence is against “several meters” of high ocean in the Holocene, if one takes the word several to be more than a few and a few to be more than two.
One or two meters, very possibly, with one meter being easy to account for, but two stretching the possibility to breaking point.
One link to some evidence/backup for my above assertions.
Much such evidence exists:
https://www.tampabayfossilclub.com/cms-main.php?page=flStory
Hello Nicholas McGinley,
Thanks for your comments. Perhaps you missed the link I provided to 80 peer-reviewed papers claiming “2+ meter” higher sea levels over the past 10k years. One of the papers addresses the Carribean and Florida and claims ~+1m.
Khan et al., 2017 Caribbean, ~+1 m above present (rate: 1.09 meters per century)
https://www.sciencedirect.com/science/article/abs/pii/S0277379116303304
So your statement about 1m is on-target.
Being aware of isostatic rebound is critical. Florida was lifted out of the sea as the continent “tetter-tottered” under the weight of the glaciers. Land north of the fulcrum (Nyborg Denmark) was depressed several hundred feet (perhaps up to 1500 feet) under the weight of the glaciers. So, the issue of sea-level is a tricky one. Sea-level is a local measurement, and it is complicated by vertical land movement as much as changes to water mass in the oceans. As you mighth know, water in the oceans is not like water in a bucket; it doesn’t “seek its own level.” The rotation of the Earth, its oblateness, air and ocean currents, gravity wells, and thermal expansion contribute effects that mound up ocean water in some places. A rise of several hundred feet has been measured over long distances. All of this makes it very difficult to say conclusively what the sea level is or was.
The point to mention this in the intro was for perspective. Alarmists imply that the conditions on Earth were a stable paradise before humans coming along and upsetting the balance. This is not true. It is an important fact that sea level was higher in the past and that it was oscillatory. With that perspective, it is difficult to convince people that what is happening today is unprecedented and a crisis.
Perhaps not “the reference” but certainly a reference…http://www.soest.hawaii.edu/ericg/kap_paper.pdf
Another reference…
https://journals.sagepub.com/doi/abs/10.1177/0959683618777070
Brilliant article – thank you!
Full of simple one-liners that can be used in discussion with the Gretas, politicians and journalists of this world (before they seethe and call you a “science denier”).
What an excellent well reasoned article. Thank you very much.
I am humbled by the awesome power of the CO2 molecule, that even measured in ppm in the atmosphere can lead the atmosphere to transfer so much heat to the ice!
If the ice caps are in the process of melting, the rational approach is to adjust to the new sea levels, because building windmills, raising taxes, and enacting wealth transfers are not going to reverse whatever is driving the process. Fortunately, we have 250,000 years to move our cities inland.
Steve O : ” … the awesome power of the CO2 molecule, that even measured in ppm in the atmosphere can lead the atmosphere to transfer so much heat to the ice ”
And, as the story goes, the “heat” transferred to the ice via CO2 was emitted by the ice!
Or we have 3-5000 years to move people in the Northern Hemisphere, South, as the ice sheets grow and move with the advent of yet another ice age cycle! 🙂
Sea level IS rising at an average rate of maybe as much two millimeters per year since the early 1800s when the first tide gauges were installed. The water has to be coming from somewhere, and the ice caps and glaciers are probably the source.
“The water has to be coming from somewhere” assumes that the sea level rise must be due to adding water mass to the sea. But that might not be altogether true.
Sea level can rise if the average temperature of ocean water increases.
Sea level can rise if tectonic activity changes what we assumed to be the reference point.
Sea level rise due to increase in temperature is local. Local may be all of the tropical Pacific, but just because the tropics warm up doesn’t mean sea level in San Francisco, New York, or any other higher latitude location will see any rise because of it. But the indoctrinated news outlets lead you and other to believe exactly that.
“Climate Change” is full of beliefs that aren’t true and the Thermal Expansion meme is one of them.
Thanks for your reply.
+1
This showed up on my daily “Sea Level” Google News search this morning:
Antarctica’s Effect on Sea Level Rise in Coming Centuries
and it says:
There are two primary causes of global mean sea level rise – added water from melting ice sheets and glaciers, and the expansion of sea water as it warms.
No mention that it’s local. So the the indoctrinated news outlets are off the hook.
It is predominantly local. The sea is not as flat as people think. It is an equipotential surface. If the South Pacific warms and the surface rises a few millimeters this won’t show up as an equal sea-level rise in New York for example.
The reason: if a water pillar warms up it will become taller, but the amount of water and the pressure at the bottom will be unchanged. If the rise were to spread out laterally bottom pressure will decrease and water will pour in from the sides to replace the displaced water.
Note: the deep ocean water has a replacement cycle of 800-1600 years and is not affected by short-term climate changes.
Thanks for that comment; it’s a fact that I had failed to reflect on before.
And it reminded me that despite its editorial slant this site still does produce a few nuggets.
The 2 mm per year was mentioned in the paper.
Nobody denies this.
The article is talking about the amount of energy that would be needed to completely melt the Antarctic and Greenland glaciers.
Thanks for the comment. Our good friends on the left like to extrapolate out to 2100 so here’s what that looks like from some tide gauges:
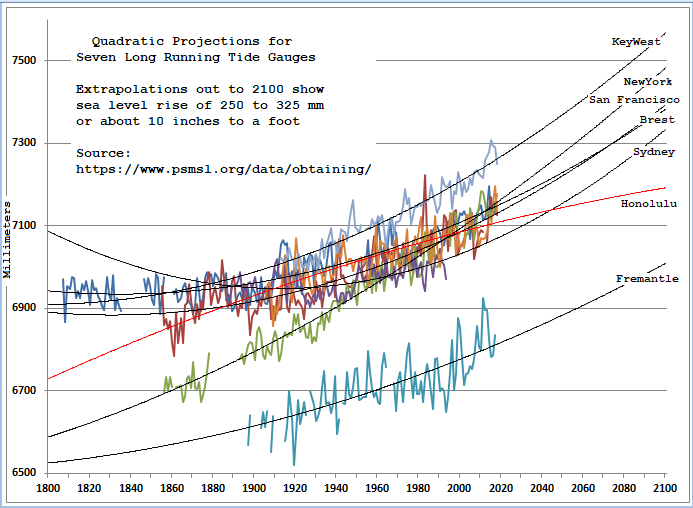
Extrapolations are real iffy out 80 years but ten inches to a foot is a whole lot less thanwhat the usual hysterical news report says.
There is no obvious reason to believe that a quadratic projection is better than a linear one. Have you verified that the correlation is significantly better? Inspection by eye suggests that it is not, except possibly for Sydney.
Hopefully Dave Middleton will weigh in on this, but there were long periods of earth history where sea level changed up and down by 70 meters or more, during periods when there is no evidence at all of continental glaciers. One can imagine storing quite a lot of water underground, but it is also likely the ocean basins change shape, and therefore volume, due to tectonic influences.
Over very long periods, on the order of tens of million years, tectonic changes such as the total length of mid-ocean ridges and the amount of underwater volcanism can change relative sea level by tens of meters. There is also evidence that parts or entire continents (e g Australia) can rise or sink by tens to hundreds of meters over similar intervals, though the mechanism is unclear.
Over shorter periods (tens of thousand to hundreds of thousand years) the only known mechanism is continental glaciers. Since there is good evidence for such changes during the Mesozoic it seems probable that there were continental glaciers at least intermittently in inland Antarctica even then. Note that Antarctic glaciation only becomes “visible” if the icecap reaches the coast and leaves traces in seabottom sediments. Inland Antarctica is geologically inaccessible (though there is morphological evidence for montane glaciation in the subglacial Gamburtsev Mountains).
There is actually one more, though infrequent, mechanism for rapid meter-level sea-level change through the desiccation/refill of a major inland basin. The only definitely known case of this is the Mediterranean during the Messinian, but it may have happened before, for example when the Atlantic ocean started to open.
Steve Case,
Sea level rise is a local phenomenon. I think this link might be helpful. It shows 375 long-term tide gauge readings that go from 2016 back to the start of the record for that location. You can see the changes to sea level are quite varied. Many stations show a long term decrease, and many show a long term increase. The slopes of the increase or decrease vary by location.
http://www.sealevel.info/MSL_global_thumbnails5.html
It takes more analysis to determine what is happening globally. The changes to land elevation, thermal expansion, changing wind and water currents, etc., need to be removed from the equation.
I value Dr. Nils-Axel Morners analysis, which concludes the eustatic rise is approximately 0.9-1mm/yr. As I showed in the paper, quoting NASA and others, the ice melt-related rise is approximately 0.35mm/yr. The balance is likely from groundwater. The Earth’s groundwater mass is 40% of the ice sheet mass. It easily explains the difference, and there are studies to support this.
https://www.waterworld.com/articles/wwi/print/volume-25/issue-5/groundwater-development-flow-modeling/groundwater-depletion-linked-to-rising.html
This paper really does put the “ice sheets are melting” into perspective for anyone who cares about this topic. Problem is, how many of the frightened people who are losing sleep and deciding to not have babies, will have the intellectual curiosity or interest to educate themselves ? Most would rather be led by the nose from “factoids” telling them we’re all facing imminent doom. Those who wish to learn about this whole CAGW movement will be grateful to have this increased knowledge. The challenge is to get this information into the mainstream conscience.
Been here, Did That too.
http://wattsupwiththat.com/2015/06/03/el-nino-strengthens-the-pause-lengthens/#comment-1953030
Couple of additional comments –
“Antarctica’s ice sheet is melting more than 200 billion tons of ice into the ocean annually
gagatonne mass = billion tonne (weight) of water has a volume of one billion cubic meters, or one cubic kilometer. Ice will have a slighly greater volume, but that 200 billion will when melted = 200 KM^2 of ice. Antarctica has between 26 and 30 million those KM^2 setting around.
And – reminding us that if the ice sheets melt, 260 feet of water will flood our coastal cities.
But using NASA’s calculations what would be the effect?
“(4) Calculate the sea-level-rise answers by dividing the water volumes determined in #3 by the global surface-water area determined in #1, thereby spreading the effect of the ice sheet’s water throughout the expanse of the Earth’s surface-water area. The answers are:
(a) (2,343,728 cubic kilometers)/(361,132,000 square kilometers) = 0.0065 kilometers = 6.5 meters for the Greenland ice sheet;
(b) (26,384,368 cubic kilometers)/(361,132,000 square kilometers) = 0.0731 kilometers = 73.1 meters for the Antarctic ice sheet;
(c) 6.5 meters + 73.1 meters = 79.6 meters for Greenland and Antarctica together.” 79.6m = 261.1549 Ft
http://pumas.jpl.nasa.gov/files/02_10_97_1.pdf
So by NASA reasoning we will get meters of sea level rise, but still have the same sized ocean (361,132 Km^2). No place gets drowned by the new rise, so why worry.
Wow, William Ward, great review! I’m sitting at my desk in Argentina, a cold rain is falling, and it’s snowing in the Andes, and reading your report makes me shiver involuntarily. It’s obvious you are intelligent, educated, and have a tendency to just blurt the truth out. Won’t work. AGW is the new religion and you can’t throw science at religion. Also you forgot to add in Davids amoeba farts.
I watched “Evolution” last night. Gives a whole new meaning to “amoeba farts”.
Hello Ron Long,
Getting your message from Argentina was great. Thanks for your kind words. Yes, AGW is the new religion. I prefer to call it CACA (Catastrophic Anthropogenic Climate Alarmism). It is fitting.
I see my role as providing sound counter arguments so Skeptics can become Rejectors and Believers can become Skeptics. For those who lash themselves to visions of a nightmarish future, we can’t force them to wake up. But we need more powerful counter-arguments to prevent the AOC’s of the world from weaving us into their nightmare with more taxes, regulations and government control. I’m not sure if AOC means anything to you in Argentina, but I’m sure you have similar characters to contend with.
Amazing that they can so accurately measure that much ice.
The equivalent of my doctors scale, measuring my weight with in a .4 gram.
Some great Radar up there. No change in crt. drift.
A radar that is able measure with in, what, 1/10,000 inch from 20 plus mile.
Did they ever find MH370?
Carl and all,
Yes, exactly. NASA and JPL forgot the error bars. Just how were these measurements from orbit over 150 miles away calibrated? I am not from Missouri, but you still have to show me.
Thanks for that thoughtful analysis, which even I as a layman could easily follow. When the state of Greenland’s ice mass is mentioned I always think of two recent stories I have read.
One is about a cold war-era military installation built below the surface of the ice. The other is about a squadran of World War II planes that was forced to land on an ice field on Greenland in the 1940’s. In both cases hundreds of feet of ice has grown over both sites… in a space of 60 to 80 years or so.
That tells me that, at least in those two locations on Greenland, the ice has grown significantly during a period when the alarmists say it should have been melting dramatically.
Neither of those is evidence that the glacier has grown.
The way glaciers work is that snow falls on the top and ice gets squeezed out at the bottom. As a result snow on the surface gradually moves down until it gets to the region where ice starts moving horizontally.
Anything on the surface will get carried down along with this snow/ice.
MarkW
Plus, ice can and will deform plastically when loaded with something of greater density. There is the old trick of passing a wire through a block of ice by hanging a weight on a wire loop passed around the block.
Your example is due to regelation, not plastic deformation. And plastic deformation of ice only works at high pressures. That is why crevasses never go right through a thick glacier. The deeper parts deform plastically instead.
Besides which the top 50-100 meters of a glacier is now, not ice.
I stand corrected.
Point taken, but the growing depth of the ice does affect the “ice mass balance” on Greenland, which affects the rate of sea level rise. The ice on Greenland began as water vapor in the atmosphere, which began as water in the oceans.
“The way glaciers work is that snow falls on the top and ice gets squeezed out at the bottom. As a result snow on the surface gradually moves down until it gets to the region where ice starts moving horizontally.”
That is only true close to the ice divide. Elsewhere surface ice/snow also moves horizontally
I’ve noticed a couple of things that seem to have escaped most “experts”.
1) Ocean temperature rise seems to greatly outpace atmospheric temperature rise. How is this possible? If increased heat retention (presumably due to increased CO2 concentration) is the primary driver of climate change, how is water temperature increasing faster than air temperature? Is it because the solar energy is being absorbed directly into the ocean, suggesting that we have increased solar activity? Or possibly that a warmer atmosphere is “giving up” more heat to the ocean due to a warmer water cycle (hot rain)?
2) Why is geothermal energy being ignored when discussing ice losses? Greenland and Antarctica are both extremely active areas of volcanic activity. How much of the ice melt is due to heat from below, vs heat from above?
3) Are we seeing real temperature rise, or simply increased monitoring, at increasingly precise measurements? Looking at my local weather history, there is a natural rise and fall of temperatures over the last 130 years of records, but there doesn’t seem to be any discernable long-term trend upward. I wonder how many long-term records in individual locations are showing the upward trend, vs an “offset” due to the increasing weight of newer monitoring stations essentially driving up the average.
Honestly, if a layman like myself can see this, it would mean that either:
A) These considerations are already accounted for, and we simply don’t hear about them,
or
B) I really am the smartest guy in the room.
(I’m guessing “A”, but dream of “B”!)
What’s your take on this?
Answer to B; No!
1) Ocean temperatures have not risen as you claim. NOAA’s attempt to claim ocean temperature increase depended upon their converting °C inputs into joules.
* i) Because using joules masks that much of the alleged temperature measurements were within instrument error ranges.
* ii) Because temperatures expressed as joules are in much larger numbers. Similar to expressing the height of the Statue of Liberty in microns.
* iii) Because joules are an improper measurement for ocean temperatures. “It is equal to the energy transferred to (or work done on) an object when a force of one newton acts on that object”. Oddly, joules would be a proper measurement unit for melting ice into sea water.
2) Got direct observation numbers for geothermal energy at Antarctica?
3) Welcome to the world of climate urgency temperature measurements. Many stations worldwide do not show a temperature increase slope. Urban areas and airports do. Plus the climateers use the temperature increases at previously unmeasured temperature areas like the Arctic or Antarctic to calculate their global anomaly. Which also ignores that hottest days do not show temperature increase. Instead the temperature increases are nights, especially winter nights. A temperature increase better explained by increased water vapor than CO₂.
Your “noticed a couple of things” appears to be based on something other than anything contained in the article presented above.
Actually, a joule or newton-meter (N/m) is defined as the work done by a force of 1 newton displacing a mass by 1 meter.
Salute!
Did not Dr Pielke Sr always promote the joules versus the “degrees” for ocean heat content and transfer mechanisms?
I do not understand how to explain an energy or work unit to my friends versus “ it is gonna be 5 degrees hotter!”
Gums asks….
Ocean temperature was largely unknown until 2004 when the Argo buoys were launched. The Argo buoys originally showed cooling ocean temperatures, but now the data has been “adjusted.” There has been very little if any change in ocean temperatures. Where are you getting your news?
Where do you get the numbers that suggest the ocean is warming faster than the air?
The claims that I have seen are that the air has warmed about 0.7C over the last 150 years and that the oceans have warmed about 0.04C over the last 20 or 30 years.
Based on NOAA data, the 2017 average global temperature across land and ocean surface areas was 1.51°F above the twentieth-century average of 57.0°F. That’s 58.51°F…say 59°F. “Up to 90 percent of the warming caused by human carbon emissions is absorbed by the world’s oceans, scientists estimate.”
Okay. Suggested experiment: The long term global average surface temperature of the oceans is 60.9°F. Fill up your bath tub with water at that temperature. Adjust the thermostat to 59°F. Close the door. Measure the temperature of the water the next morning.
Finally, some sensible and logical use of the data, proving, once and for all, the=at we have nothing to fear, except fear, itself! THANK you!
Sea Level rise, as you mentioned, is only partly driven by ice melt, and probably would be slightly higher if atmospheric temperature changed 1.5 degrees C or whatever over the rest of the century.
Heat of fusion is a good thing to remind people who are anxious about the ice sheets melting, though.
Here is an excellent YouTube video about sea level rise in the Pacific Ocean. Karl-Axel Mörner has a presentation at the EIKE Climate conference november 2018 in Germany. His study has not been made by data from the satellites but from being on the Islands in the Pacific Ocean.
Here is a YouTube video on sea level rise in the Pacific Ocean.
https://m.youtube.com/watch?v=Z8g0aUm16FU&list=PLL4Ne3bkwWloJ0BCAiftwm7jTwh8iahoV&index=8
Louis,
Thanks for the Nils-Axel Morner video. I’m a huge fan of his work. He is the authority I turn to for SLR science sanity.
Here is another of his earlier videos. I have not yet watched the one you provided so I’m not sure how much overlap there is. But for those who like to learn and collect information here it is:
https://youtu.be/poZ0pEOtFYM
“The primary problem is that the news writers do not have the scientific background to report on the subject responsibly, and therefore they routinely corrupt and distort the facts.”
The primary problem is that writers treat the subject like supermarket tabloids. They are in the business of selling fear and anger
True. They never “routinely distort and corrupt the facts” in the direction of less alarmism. The tells me there is an agenda.
How can “E” be equal for melting and vaporization when the latency of vaporization is 6.67 times higher than the latency of fusion?
I think you misread.
Comparison was for the amount of Energy necessary to melt the ice with the amount of energy necessary to raise the temperature of the ocean to 100C. No discussion was made for vaporization of the water
Because you have misunderstood the presentation. The two “E”‘s are equal for melting the ice and bringing it to the boiling point, not converting it to vapor.
Thanks.
With some relief I can report that the energy of fusion is roughly but not exactly equal to the energy to warm after melting to 100C (without vaporization). If they were exactly equal, something very fundamental would be implied.
You may also be ignoring the energy used to warm the ice from -25°C to 0°C. That would make it a little less “rough”.
Hello Gordon,
Thanks for the opportunity to clarify. This information is also shown in the Excel file, available at the link provided in the paper.
Energy to warm 1kg of ice from -25°C to 0°C (no melting):
E = mc∆T
E = 1kg * 2,108J/kg/°C * 25°C
E = 5.27×10^4J
Energy to melt 1kg of ice from 0°C solid to 0°C liquid:
E=mL
E = 1kg * 3.34×10^5J/kg
E = 3.34×10^5J
(Putting it together) Energy to warm *and* melt ice from -25°C to 0°C liquid
E = 5.27×10^4J + 3.34×10^5J
E = 3.86×10^5J
Energy to heat seawater from 0°C to 100°C (with no steam produced). Note this is SEA WATER – not fresh water. The meltwater runs to the sea, so seawater is used for this reason. The specific heat of seawater is slightly less than pure water.
E = mc∆T
E = 1kg * 3,850J/kg/°C * 100°C
E = 3.85×10^5J
The difference is 0.01J between the scenarios.
To be more exact, 1kg of ice at -24.4°C is equal to the energy to raise 1kg of seawater from 0°C to 100°C.
Since we are just looking at general concepts for perspective, I thought the convenience of a nice round number (-25 vs. -24.4) was acceptable, considering the rounding did not enhance my case. A small amount of steam can be created with the energy to melt ice at 25°C, but mentioning this makes it more complicated with little benefit to the point.
The relative humidity at the interface between water or ice and air will nearly always be 100%. In other words, the air temperature and dew/frost point are the same. The dew point changes little with distance from the surface. So dew/frost point is controlling surface temperature where water is present, not CO2. Basic science like in this article.
Excellent use of perspectives by William Ward to put the hysteria in perspective.
OMG, the thickness of four hairs is double the thickness of two! That’s an increase of 100% or 200% of the original thickness.
There are 10,000 BBs in the back of a pick-up truck. There were originally about 3 ‘red’ ones a 150 years ago and now there are 4 ‘red’ ones. Can’t you see that that the number of red BBs has increased 33% and is causing catastrophic changes? Similar to CO2, the tires will soon be exploding under the tremendous additional load and heat. 😉
Years ago I saw a video very similar to the ball bearings in the truck bed but using rice. It really gave you a sense of perspective.
Our shop uses 1 RCH = .0015″ but now we are splitting hairs.
Substitute CO2 in equation 1 and explain why when thermodynamics says the energy can be of any form climate science says that if IR is involved the temperature will be higher. Climate science wants to augment equation 1 with the forcing equation.
CO2’s mass coupled with its specific heat prevent an increase in temperature in atmosphere as concentration increases. Anthony’s experiment shows that.
If climate science is correct the specific heat of air must have changed as the ppm of CO2 has gone up.
Just heard the new AGW screen star Greta Garbage has said,
“I want to be alone”
Great article, it is a shame none of the Greens will read it and even if they did, they would not understand the scientific principles involved.
That was a real treat to read.
Thanks, Anthony, for posting the article.
And thank you, William Ward, for a great exposition of what needs to happen for the sea level to change. I liked how you went through it all taking small bites at a time. Very nicely done.
A bright middle-school student and the average high-school student should have no trouble following your explanations. There is no math “left to the student as an exercise” and you’ve included several familiar comparisons (thickness of human hair, temperature of sun surface, etc.) to make it easy for anyone to understand the numbers you are using. I’m bookmarking this one.
Now if we could just get the kids to put down their smart phones and game controllers….
Thank you, H.R., and thanks to CTM and Anthony (and nameless others) for the opportunity and the support to review the work.
Thank you, I learned a lot from this article.
I also thank you, William Ward. I too learnt lot from this paper.