From Dr. Roy W. Spencer’s Blog
March 7th, 2019 by Roy W. Spencer, Ph. D.
SUMMARY: Evidence is presented that an over-correction of satellite altimeter data for increasing water vapor might be at least partly responsible for the claimed “acceleration” of recent sea level rise.
UPDATE: [03/18 Dr. Spencer contacted me this am to notify me of this update] A day after posting this, I did a rough calculation of how large the error in altimeter-based sea level rise could possibly be. The altimeter correction made for water vapor is about 6 mm in sea level height for every 1 mm increase in tropospheric water vapor. The trend in oceanic water vapor over 1993-2018 has been 0.48 mm/decade, which would require about [6.1 x 0.48=] ~3 mm/decade adjustment from increasing vapor. This can be compared to the total sea level rise over this period of 33 mm/decade. So it appears that even if the entire water vapor correction were removed, its impact on the sea level trend would reduce it by only about 10%.
I have been thinking about an issue for years that might have an impact on what many consider to be a standing disagreement between satellite altimeter estimates of sea level versus tide gauges.
Since 1993 when satellite altimeter data began to be included in sea level measurements, there has been some evidence that the satellites are measuring a more rapid rise than the in situ tide gauges are. This has led to the widespread belief that global-average sea level rise — which has existed since before humans could be blamed — is accelerating.
I have been the U.S. Science Team Leader for the Advanced Microwave Scanning Radiometer (AMSR-E) flying on NASA’s Aqua satellite. The water vapor retrievals from that instrument use algorithms similar to those used by the altimeter people.
I have a good understanding of the water vapor retrievals and the assumptions that go into them. But I have only a cursory understanding of how the altimeter measurements are affected by water vapor. I think it goes like this: as tropospheric water vapor increases, it increases the apparent path distance to the ocean surface as measured by the altimeter, which would cause a low bias in sea level if not corrected for.
What this potentially means is that *if* the oceanic water vapor trends since 1993 have been overestimated, too large of a correction would have been applied to the altimeter data, artificially exaggerating sea level trends during the satellite era.
What follows probably raises more questions that it answers. I am not an expert in satellite altimeters, I don’t know all of the altimeter publications, and this issue might have already been examined and found to be not an issue. I am merely raising a question that I still haven’t seen addressed in a few of the altimeter papers I’ve looked at.
Why Would Satellite Water Vapor Measurements be Biased?
The retrieval of total precipitable water vapor (TPW) over the oceans is generally considered to be one of the most accurate retrievals from satellite passive microwave radiometers.
Water vapor over the ocean presents a large radiometric signal at certain microwave frequencies. Basically, against a partially reflective ocean background (which is then radiometrically cold), water vapor produces brightness temperature (Tb) warming near the 22.235 GHz water vapor absorption line. When differenced with the brightness temperatures at a nearby frequency (say, 18 GHz), ocean surface roughness and cloud water effects on both frequencies roughly cancel out, leaving a pretty good signal of the total water vapor in the atmosphere.
What isn’t generally discussed, though, is that the accuracy of the water vapor retrieval depends upon the temperature, and thus vertical distribution, of the water vapor. Because the Tb measurements represent thermal emission by the water vapor, and the temperature of the water vapor can vary several tens of degrees C from the warm atmospheric boundary layer (where most vapor resides) to the cold upper troposphere (where little vapor resides), this means you could have two slightly different vertical profiles of water vapor producing different water vapor retrievals, even when the TPW in both cases was exactly the same.
The vapor retrievals, either explicitly or implicitly, assume a vertical profile of water vapor by using radiosonde (weather balloon) data from various geographic regions to provide climatological average estimates for that vertical distribution. The result is that the satellite retrievals, at least in the climatological mean over some period of time, produce very accurate water vapor estimates for warm tropical air masses and cold, high latitude air masses.
But what happens when both the tropics and the high latitudes warm? How do the vertical profiles of humidity change? To my knowledge, this is largely unknown. The retrievals used in the altimeter sea level estimates, as far as I know, assume a constant profile shape of water vapor content as the oceans have slowly warmed over recent decades.
Evidence of Spurious Trends in Satellite TPW and Sea Level Retrievals
For many years I have been concerned that the trends in TPW over the oceans have been rising faster than sea surface temperatures suggest they should be based upon an assumption of constant relative humidity (RH). I emailed my friend Frank Wentz and Remote Sensing Systems (RSS) a couple years ago asking about this, but he never responded (to be fair, sometimes I don’t respond to emails, either.)
For example, note the markedly different trends implied by the RSS water vapor retrievals versus the ERA Reanalysis in a paper published in 2018:

The upward trend in the satellite water vapor retrieval (RSS) is considerably larger than in the ERA reanalysis of all global meteorological data. If there is a spurious component of the RSS upward trend, it suggests there will also be a spurious component to the sea level rise from altimeters due to over-correction for water vapor.
Now look at the geographical distribution of sea level trends from the satellite altimeters from 1993 through 2015 (published in 2018) compared to the retrieved water vapor amounts for exactly the same period I computed from RSS Version 7 TPW data:
 The geographic pattern of 23-years of sea level rise from satellite altimeter data looks similar to the pattern of water vapor increase (percent per decade), suggesting cross-talk between the water vapor correction and sea level retrieval.
There is considerably similarity to the patterns, which is evidence (though not conclusive) for remaining cross-talk between water vapor and the retrieval of sea level. (I would expect such a pattern if the upper plot was sea surface temperature, but not for the total, deep-layer warming of the oceans, which is what primarily drives the steric component of sea level rise).
Further evidence that something might be amiss in the altimeter retrievals of sea level is the fact that global-average sea level goes down during La Nina (when vapor amounts also go down) and rise during El Nino (when water vapor also rises). While some portion of this could be real, it seems unrealistic to me that as much as ~15 mm of globally-averaged sea level rise could occur in only 2 years going from La Nina to El Nino conditions (figure adapted from here) :

Especially since we know that increased atmospheric water vapor occurs during El Nino, and that extra water must come mostly from the ocean…yet the satellite altimeters suggest the oceans rise rather than fall during El Nino?
The altimeter-diagnosed rise during El Nino can’t be steric, either. As I recall (e.g. Fig. 3b here), the vertically integrated deep-ocean average temperature remains essentially unchanged during El Nino (warming in the top 100 m is matched by cooling in the next 200 m layer, globally-averaged), so the effect can’t be driven by thermal expansion.
Finally, I’d like to point out that the change in the shape of the vertical profile of water vapor that would cause this to happen is consistent with our finding of little to no tropical “hot-spot” in the tropical mid-troposphere: most of the increase in water vapor would be near the surface (and thus at a higher temperature), but less of an increase in vapor as you progress upward through the troposphere. (The hotspot in climate models is known to be correlated with more water vapor increase in the free-troposphere).
Again, I want to emphasize this is just something I’ve been mulling over for a few years. I don’t have the time to dig into it. But I hope someone else will look into the issue more fully and determine whether spurious trends in satellite water vapor retrievals might be causing spurious trends in altimeter-based sea level retrievals.
In Climate Science these days, when you read “Correction” or “Adjustment”, you need to understand the words “Fraud” or “Misrepresentation”.
Dr. Spencer does corrections and adjustments.
Therefore…
Steven Mosher .. .at 11:57 pm
Dr. Spencer does corrections and adjustments.
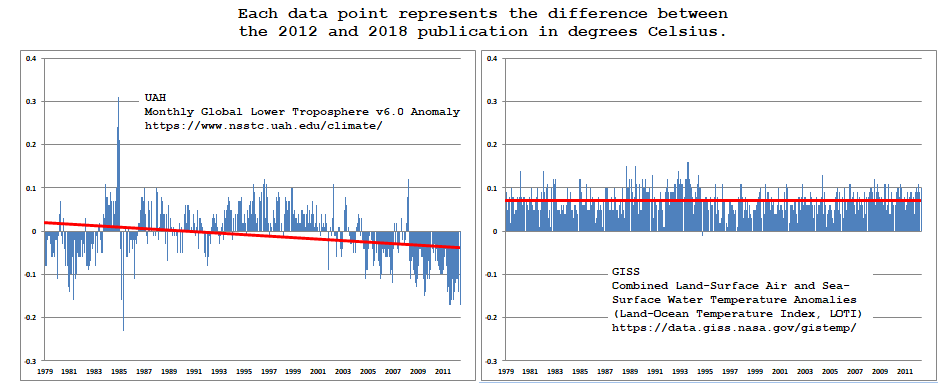
Dr. Spender’s UAH does indeed make changes, not to sea level but to global temperature. Here’s a direct apples to apples comparison of UAH changes to GISSTEMP changes:
Your thoughts on the difference between the two would be most welcome.
Is there a water vapor correction to the ” temperature ” readings ?
Same bias ?
So GISS have added almost 0.1 deg C to the last 40 years Since 2102. Just as well since the “warming” was a bit unscary. Can you post how much they save cooled the early 20th c. by , we can then add to the two and see where the real “man made ” warming originates.
Greg @ur momisugly 12:13 pm
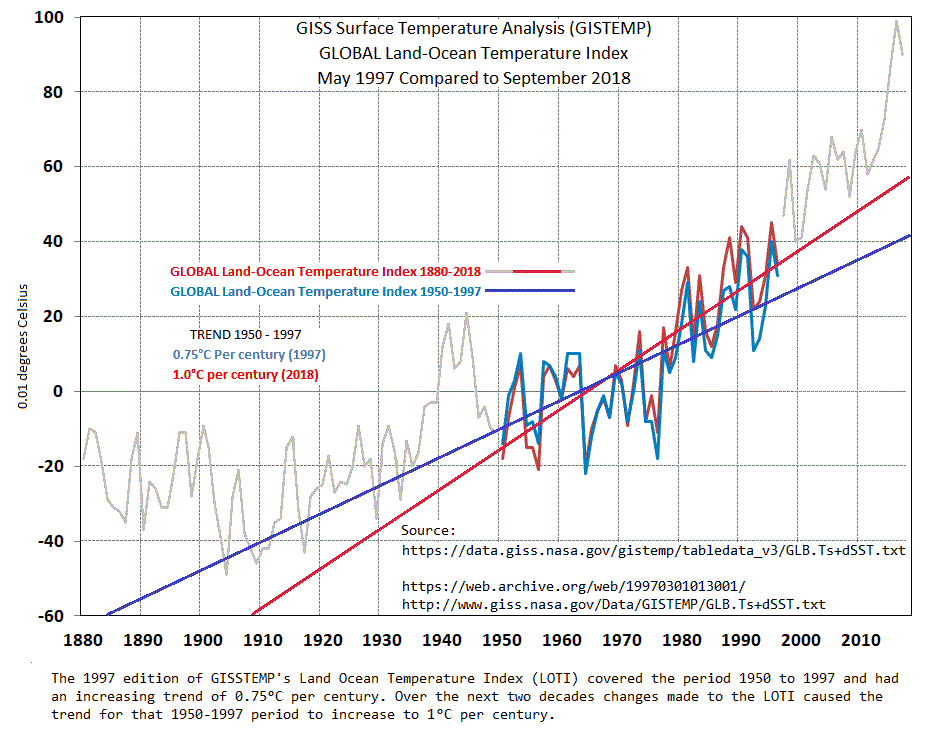
So GISS have added almost 0.1 deg C to the last 40 years Since 2102. Just as well since the “warming” was a bit unscary. Can you post how much they save cooled the early 20th c. by[?]
Sure:
Here’s how all the changes since 1997 have affected the ’97-’18 timeline:
About a third of all the monthly entries since 1880 are changed on every monthly update. A rough estimate would be that GISSTEMP has made nearly 100,000 changes to the monthly entries since 2002.
…he shows all his work and shares the algorithms as well. So others can see if it makes sense.
I see that Steve is still trying to push the nonsense that if some adjustments are valid, then all adjustments must be valid.
SM, are you implying that ANYONE here us saying ALL adjustments are bad?
The first problem is the opaque and openly activist group doing the altimetry work at C.U Bolder.
They now refuse to give the non “inverse barometer” corrected data. They add in a “correction” for allegedly deepening ocean basins giving sea levels which are floating phantom-like above the waves. This discrepancy gets larger every year.
When I questioned this they told me it was that they want MSL to be and “indicator” of global warming. So they have abandoned even the pretense that it is what it claims to be : sea level.
Even the suggestion that you can measure sea level to sub-millimeter precision from low orbit by looking at the TROUGH of the swell, is a joke. The have no ground zero data calibration, they just tweak the various model adjustments until they get an answer which fits their expectations ( or objectives ).
I stopped taking satellite altimetry seriously as soon as I looked into how it was done , how they stitched and altered previous mission data together and found the attitiude of the group by directly communication with them.
This is not science, it is yet more “save the world” activism.
“Even the suggestion that you can measure sea level to sub-millimeter precision from low orbit by looking at the TROUGH of the swell, is a joke.”
If global average winds decrease, as could happen if the poles warm, would ocean swells be reduced some giving a false sea level increase as measured by satellites? The wave troughs would become shallower.
They do claim to account for the fact they are measuring the trough. But that is where all the art of choosing the right model and parameters comes in. Just like the GCMs, you can get the result you want / need.
Since they are activists not honest brokers I have no confidence in what they do. Thus I had to write that off as yet another dataset that we are unable to get any useful info from.
Sad but the list is long.
“the claimed “acceleration” of recent sea level rise”
Not sure how “acceleration” of sea level rise got to be evidence of human cause when acceleration of sea level rise is normal in interglacials. If surface temperature is above freezing and constant the rate of SLR will be constant. If the temperature is rising the rate of SLR will rise ( acceleration). How does that prove human cause?
To prove human cause it must be shown that the rate of SLR is related to the rate of emissions such that a reduction in the rate of emissions will attenuate the rate of SLR.
https://tambonthongchai.com/2019/02/20/csiroslr/
https://tambonthongchai.com/2018/12/05/attenuate-slr/
If the temperature is rising at a constant rate, steric sea level rise should do the same, NOT accelerate. The reason they want to find an acceleration is that could be used to imply GHG effect detected in the oceans. If the rate of sea level rise has been constant since before the end of the 19th century, it is a big problem for the alarmist AGW campaign.
There are so many assumptions, ‘paramaters’ and ‘adjustments’ needed to guess the sea level by looking at the reflection from the trough of the swell that you end up finding and accepting what you set out find.
That is why they have their thumb on the scales to get the expected ( required ) result.
They do make the claim of acceleration – “Global sea level rose about 8 inches in the last century. The rate in the last two decades, however, is nearly double that of the last century and is accelerating slightly every year.”
https://climate.nasa.gov/evidence/
I was replying to Chaamjamal
since he does not seem to understand how one relates to the other.
Chaamjamal has a valid point. Acceleration proves nothing. Sea level during inter glaciation will speed up and slow down according to historic proxy measurements. Chaamjamal’s statistical tests are worth looking at. They show human emissions have nothing to do with sea level rise. No correlation. Without correlation you cannot have causation.
SM, are you implying that ANYONE here us saying ALL adjustments are bad?
If acceleration proves human cause which humans caused acceleration in the Eemian & in the Younger Dryas? Sea level rise and both acceleration and deceleration of sea level rise are normal in interglacials as are a lot of other things that climate science wants us to fear.
https://tambonthongchai.com/2019/02/20/csiroslr/
Rise or fall depends on location (Countries With Sea Level Change – 2).
Like real estate … location, location, location …
NOAA states that global sea level rise shown by tide gauges is 1.7mm/year, or 6.7 inches per century. NASA satellite records since 1994 indicates the rate is now 3.2mm/year, still only 12.6 inches per century but almost double the tide gauge records. My observations of hundreds of tide gauge records on the NOAA Sea Level Trends website (https://tidesandcurrents.noaa.gov/sltrends/sltrends.html) finds that they are predominantly from 0 to 3 mm/year, and that the graphs thoughtfully provided by NOAA for each station depict straight lines with no signs of acceleration of sea level rise after 1980 – or before 1980, for that matter. In the San Francisco Bay Area the newspapers frequently have articles about an expected sea level rise of five feet in the 21st Century. To accomplish such an increase, the rate of sea level rise must immediately leap to over 18mm/year and stay at that level for the next 82 years. Each year that passes at the 1.7mm/year rate means that at some point before 2100 there will have to be a rate of sea level rise not seen since the end of the last glacial period when sea level was 400 feet lower and mile-thick ice caps covered Canada and large areas of Eurasia. Nowhere, including in satellite measures, is there any indication of this occurring. Sea level has been rising steadily and moderately since the end of the Little Ice Age (1850) with no catastrophic consequences in the past and none foreseen that adaptation can’t control.
“NOAA states that global sea level rise shown by tide gauges is 1.7mm/year”
CSIRO global estimate is 1.6mm/year but let’s not get too picky here although one of the oldest tide gauges in the SH at Port Arthur in Tasmania only shows 0.85mm/yr between 1847 and 2000-
https://www.cmar.csiro.au/sealevel/sl_hist_few_hundred.html
Double 1.6mm for the global average doesn’t seem plausible for satellite altimetry but we seem to have a lot of faith in high tech nowadays vs the old KISS principle.
Willis Eschenbach cites Church and White data that says 1.6 mm/year overall from 1880 to 2014 (with satellite assistance from 1993 afterwards), and 1.5 mm for the 21 year period from 1972 through 1992 inclusive.
Also, he uses tide gauge data alone to show acceleration by .76 mm/year from the 1972-1992 period of 21 years to the 1993-2013 period of 21 years. (As opposed to acceleration by 2.1 mm/year of satellite data is used.)
Donald. Willis is showing a trend of sea level rise of 0.76mm/year (three inches per century), not acceleration.
https://wattsupwiththat.com/2018/12/17/inside-the-acceleration-factory/
Willis concludes his article: “And this makes it very likely that Church and White are manufacturing sea level acceleration where none exists … bad scientists, no cookies.”
Jeez, the number of folks who do not even understand what acceleration means and think it can be measured in inches/century.
I guess they must think you get tickets for accelerating faster than 50 mph.
Michael Combs: Figure 6 in this article shows .76 mm/year as the trend difference of 1993-2013 minus 1972-1992 according to tide gauges.
I am aware that Willis E. said “manufacturing sea level acceleration where none exists”. I wonder why he would say “none” after demonstrating sea level rising .76 mm/year faster in 1993-2013 than in 1972-1992 according to tide gauges. He demonstrated that 1.34 of claimed 2.1 mm/year acceleration (of 1993-2013 trend over 1972-1992 trend) is unsupported by tide gauges.
Greg. Acceleration means increasing the rate, not maintaining the rate. In physics, it is “the rate of change of velocity per unit of time.” Maintaining a speed (or rate of rise) is not acceleration. Jeez, the number of folk that don’t understand simple concepts in physics.
Another source of sea level rise data show that sea level has risen at a rate of from 1.3 to 2 mm/yr for the past 6,000 years and that there are starts and stops in the process. Overall, the measured rate (from the changes in coastal bog elevations) has an accuracy of about +/- 1 meter over the full period, or about +/- 0.17 mm/yr. See “A Search for Scale in Sea-Level Studies, Larsen et. al, Journal of Coastal Research, July 2006. It seems that where ever one looks, real measured sea level rise is exceedingly constant, has been so for millennia, and remains constant to this day.
That’s 6 inches of difference across a ten year period. Regardless of rise and fall of land levels at different point around the globe, 6 inches of water over the entire surface of the world’s oceans should be readily detectable.
Are they even looking? It staggers me the extent to which the fix is in on this whole scam.
It would seem that if the SLR from satellite microwave altimeters are over-correcting for water vapor, then the very same result should apply equally to coastal tidal gages, particularly tide gages in areas subject to wind patterns of onshore breezes. Such tidal gages would have essentially the same water vapor concentrations in the overlying air as over the open oceans.
So consequently, are the sat altimeters measuring the elevation of the locations of known tidal gages? If so, does the sat altimetry for the land surface show the same pattern as for the maritimesat altimetry nearby? If not, then the over-correction for water vapor should be in question.
Consequently it is necessary for the sat altimetry to include known locations of tidal gages to use as a comparison, if not correction factor. Any gages that are rising tend to reduce measured SLR and gages that are subsiding tend to increase measured SLR.
Bottom line is that we know that tidal gages are potentially affected by land uplift and subsidence, and therefore may not be accurate gages of absolute SLR in their local area … and such gage elevation change seems to at least theoretically explain the wide variations in tidal-gage measured SLR that should be eliminated by using sat altimetry, as long as the correction factors for water vapor aren’t biasing the results.
More data needed!
I’m 99% sure that the water vapor correction under discussion is part of the tropospheric delay correction applied to the satellite radar altimeter signal. Tidal gauges measure sea levels directly and don’t use a radio signal propagated through the atmosphere and thus don’t need (and mostly couldn’t use) a water vapor correction. Caveat: A few gauges actually do use a local radio altimeter instead of a float and stilling well. But I don’t think they bother with a water vapor correction because their signal path is very short. If they do make a water vapor correction, they probably base it on humidity measured at the gauge.
Michael Combs
“NOAA states that global sea level rise shown by tide gauges is 1.7mm/year, or 6.7 inches per century. NASA satellite records since 1994 indicates the rate is now 3.2mm/year, still only 12.6 inches per century but almost double the tide gauge records.”
Aren’t you comparing apples with oranges here?
The NOAA / CSIRO rise trend of 1.7 mm / year is valid for the entire period of observation processed by CSIRO, i.e. 1880-2015. That published by NASA refers to the period 1993-2015.
Here are the trends I obtained from Excel two years ago for CSIRO data (mm/y):
– 1880-1920: 1.31± 0.03
– 1920-1950: 1.52 ± 0.04
– 1950-1980: 1.50 ± 0.04
– 1980-2010: 2.39 ± 0.04
and
– 1993-2013: 3.56 ± 0.06
So you can see that for their common period, the CSIRO data had a much higher trend than that of the satellite data. And I’m sure this will be exacerbated a bit when I add the new data for 2013-2015.
Commenter Olof R is probably right when he writes that the satellite altimetry is biased low.
Here is a graph comparing the two series (in 2017):
https://drive.google.com/file/d/1p9_mHft8ziE8REL_tKtDKhMtI3gX3Xdc/view
Look at the 3rd order polynomials.
Then of course there are the known accuracy errors in the satellite altimeters.
First, it looks to me the over-estimation of TPW by RSS might have begun shortly in 1995 (relative to the ERA-re-an).
Curiously, IPCC SAR report came out February 1995 (see IPCC link below that gives a Feb 1995 date).
note: The final, full glossy version of the SAR report came out in 1996.
SAR,Chapter 7, SLR said the following on SLR:
[my added bold]
from: https://www.ipcc.ch/site/assets/uploads/2018/02/ipcc_sar_wg_I_full_report.pdf
see page 363, Summary.
That second bullet in the SAR Chapter on SLR probably didn’t make Vice President Al Gore too happy. So maybe the “exact timing” of the onset of an acceleration was March 1995?
The RSS TPW discrepancy that the ERA Reanalysis paper (published in 2018) is maybe just a Marmion artifact*????
Note:
* a Marmion artifact: “Oh! What A Tangled Web We Weave When First We Practice To Deceive”
Isn’t there an El Nino/La Nina signal in the Eastern Pacific tidal gauges along the West Coast of the US?
I’m the wrong person to ask that question.
All I know is the US West Coast has a significant tectonic uplift signal of ~1mm/yr that offsets much or all of the SLR due to actual ocean surface rise. Until the Cascadia Fault ruptures in a massive 9.0 mega-quake and the plate relaxation drops the Seattle waterfront into Puget Sound.
All I know is the US West Coast has a significant tectonic uplift signal of ~1mm/yr
Only North of the Mendocino triple-point where the Gorda Plate, North American Plate, and Pacific Plate meet. South of there, the West Coast tracks along within 100-200km of the junction of the Pacific and North American Plates. The actual junction is the San Andreas fault system which is a right lateral fault with almost completely horizontal motion. The San Francisco tide gauge is pretty close to the fault. It was operating during the 1906 earthquake. You can’t see any vertical jump at all at the time of the quake.
North of Cape Mendocino, you’re right. The tidal gauges in Oregon and Washington are surely showing too little Sea Level Rise. That’ll fix itself someday. Jerry Brown, et. al. will probably blame THAT on climate change also.
To Lee: The known errors in satellite altimeters should have been already taken into account. It is the ‘unknown’ errors which cannot be taken into account. Didn’t some wise person remark about known unknowns and unknown unknowns?
Yeah. Those 33-42 mm inaccuracies really help to pin down a postulated 3 mm rise.
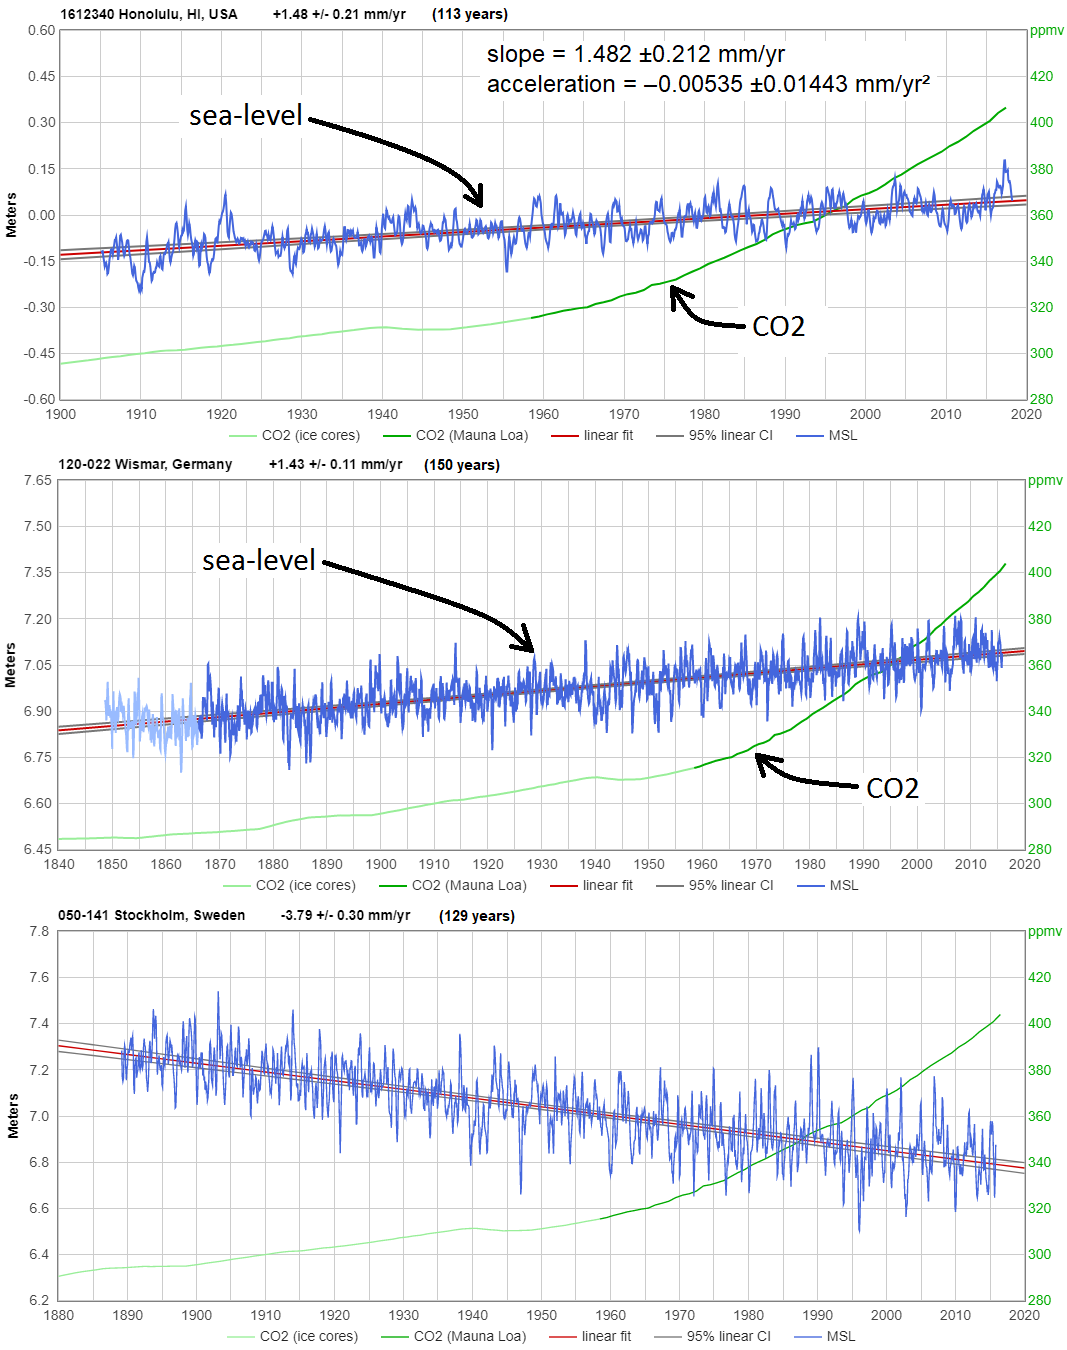
A graph from Sweden might be one piece in the puzzle .
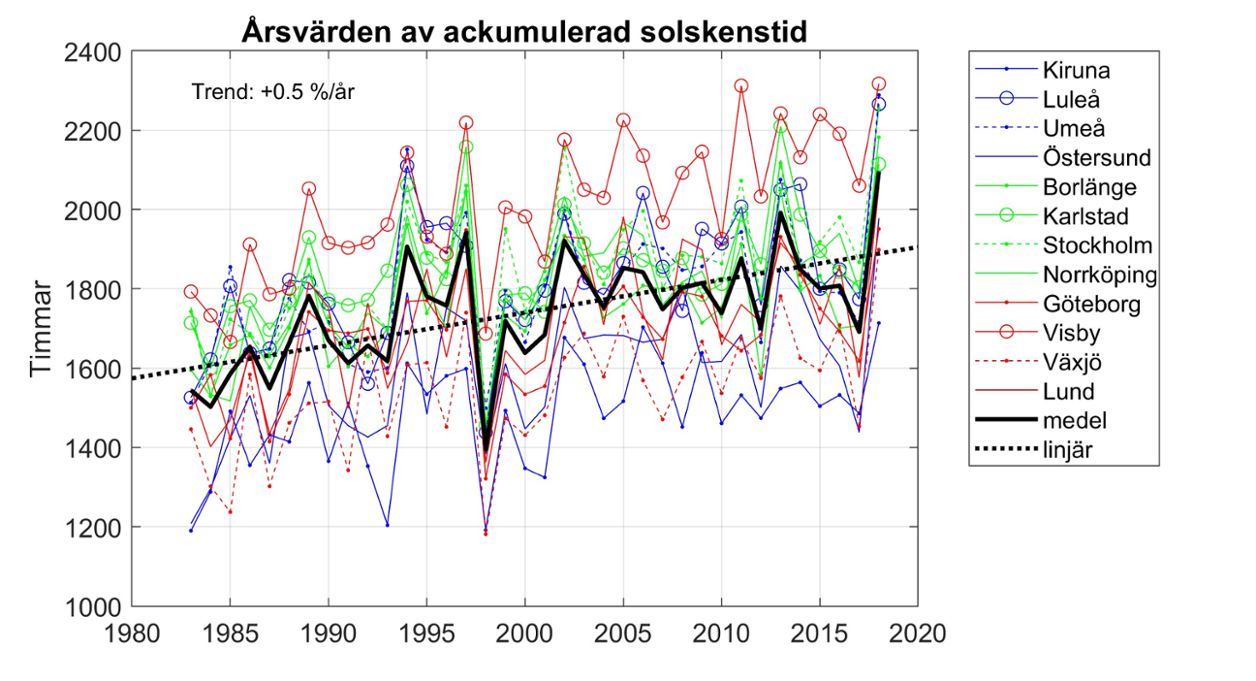
Number of sun hours has increased by 17% since 1983-that is less clouds that covers the sun and less water vapour in the air.
+1000
As Dr Spencer pointed out about a decade ago, it only takes a change of about 2% in global cloud cover to produce a similar “forcing ” as attributed to CO2.
CO2 must be slowing the daytime rotation of the Earth!!!
Is there anything it can’t do?
Yes, but the Earth is going to get unstuck from the CO2 and instantaneously jump forward 1/24th of a rotation on March 10.
The whole of Western Europe has received more sun over the last 10/20 years. Almost every month here in the Netherlands has above average sunshine duration(hours of sunlight). One of the reasons is the average is taken from 1980-2010. This includes the darker 80’s. When we poluted the air much more and clouds could form easier. The other reason is completely unknown. I don’t think cleaner powerplants could account for it all. Seems unlikely, but who knows. What I do know is that when the 80’s are removed from the 30 year average then the warming will officially stop in whole Western Europe. No more ‘last month was above average’.
More sunlight = warmer sea. Our weather comes from the sea.
Jeroen
“What I do know is that when the 80’s are removed from the 30 year average then the warming will officially stop in whole Western Europe.”
It’s a bit off topic to discuss here about sunshine and reference periods, but I had some fun to verify that you are simply wrong with your assumption.
I generated two anomaly times series of the NL data out of NOAA’s GHCN daily dataset
ftp://ftp.ncdc.noaa.gov/pub/data/ghcn/daily/
the one wrt the mean of 1981-2010 (A), the other wrt that of 1991-2010 (B).
Linear estimates in °C / decade:
-1901-2018:
— A: 0.13 ± 0.01 | B: 0.15 ± 0.01
– 1979-2018:
— A: 0.44 ± 0.06 | B: 0.49 ± 0.06
I had some idle time today, and made two graphs out of that to make the tiny trend difference visible:
1901-2018:
https://drive.google.com/file/d/100SOMNSUcvn_Nad1F-eoP8qmSvBqgrdF/view
1979-2018:
https://drive.google.com/file/d/161gVJ7JPvP5x9k1qxhTJH03HC947w3-a/view
Het spijt me echt, mijnheer.
Wait… less clouds only mean the air temperature fell to dew point less often. That could mean what you said it means, or it could mean the air actually warmed while atmospheric water vapor (measured by mass of water/cu ft of dry air) remained constant. Or some combination(s) of factor(s) in between. And AFIK we don’t have the measurements to determine which. I keep seeing “estimated TPW” and such, when all they can say with certainty is they just don’t know.
I take it that you don’t get even remotely as good data over land.
That’s unfortunate. SuomiNet works with GPS to give an almost real-time 3D image of atmospheric water over most of the continental US. If you could get decent satellite data over land, comparing the two might be a good calibration source.
SuomiNet uses a large number of GPS receivers to basically do computed tomography against GPS signals to extract to delay do to water vapor for fairly small atmosphere cells. I don’t know how many receivers are needed to get a lower resolution, but I’m wondering how well you could do by equipping the TAO buoys with appropriate GPS receivers.
++PLS
TAO buoys are anchored to the seabed with a long tether. So they wander around over about a several kilometer radius circle. The attempt to measure a reliable TPW signal delay against the random wandering uncertainty of the buoy in its true position of the platform would make the TPW result highly uncertain.
Good grief. I don’t understand much of this but what the hell is wrong with using a stick the ground? Oh sorry that’s what tide gauges are. Silly old low tech me.
Bruce Clark
The God of technology must be appeased.
Except when it doesn’t agree with alarmists.
…what…is wrong with using a stick the ground?
Compare the tide record from San Francisco’s Golden Gate with the record from Alameda, directly across the bay. Clearly, the sticks in the ground move up and down with the rising/falling land. In theory, satellite measurements may give results that can distinguish the two motions.
Golden gate and other tide gauges in the area, and throughout the US, are equipped with GPS elevation sensors that are very accurate and clearly show the difference between the two motions. No need for more satellites.
And the satellite altimetry absolutely has a valuable purpose, but if it’s cumulative finding is in strong disagreement with the average of all the world’s tide gauges then something is wrong.
Didn’t you see Gilligan’s Island? Gilligan moved the sticks, which convinced the professor that the island was sinking (or sea level was rising)
The professor was wrong.
Presumably if sea levels continue to rise at 3.5mm/year in the middle of the oceans and only 1.7mm/year on average at the coast, ships will soon need to use extra fuel to haul themselves up as they leave port, but on the plus side, they’ll be able to kill their engines and coast downhill into harbour. /sarc
“Especially since we know that increased atmospheric water vapor occurs during El Nino, and that extra water must come mostly from the ocean…yet the satellite altimeters suggest the oceans rise rather than fall during El Nino?”
The question is, where does the increased atmospheric WV fall in order for it to reduce SL?
In a LN, warm waters concentrate in the west Pacific with the land mass of northern Australia to receive it as rainfall and remove it from the equation for a time.
In an EL, warm waters flow east and WV has the vastness of the Pacific to precipitate back into direct.
https://phys.org/news/2013-08-global-sea-dampened-australia.html
“No other continent has this combination of atmospheric set-up and topography,” Fasullo says. “Only in Australia could the atmosphere carry such heavy tropical rains to such a large area, only to have those rains fail to make their way to the ocean.”
I have heard that Fasullo story before. The water taken out of the ocean for the surface to dip by almost 10 mm in altimetric sealevel during the 2011 La Nina was all dumped on Queensland and retained there. Hm. Queensland occupies 1.8 million km square, that is 0.6% of the size of the oceans. The idea implies that 1.6 meters of rain fell over the whole of Queensland. In reality less than 10% of its area was inundated, so 16m must have fallen there. Really?
“The 2011 La Niña was so strong that it caused global mean sea level to drop by 5 millimeters (0.2 inches), a new study shows. Since the early 1990s, sea level has been rising by about 3 millimeters (0.1 inches) per year, satellite data show. But between the beginning of 2010 and the middle of 2011, sea level fell by 5 millimeters (0.2 inches).
https://phys.org/news/2012-10-la-nina-global-sea.html
https://agupubs.onlinelibrary.wiley.com/doi/full/10.1029/2012GL053055
It appears they might be checking the horse’s teeth at the wrong end.
See my comments on Dr. Spencer’s original posting here:
http://www.drroyspencer.com/2019/03/is-satellite-altimeter-based-sea-level-rise-acceleration-from-a-biased-water-vapor-correction/
“Biased water vapor correction” (BWWC) represents a fascinating insight, Dr. Spencer!
By now, most people engaged in looking at the satellite sea level problem agree that, in fact, there is a problem. After a quarter-century of satellite data analysis, three things are obvious.
The first, on the plus side, is that satellite readings accurately reflect Real world events, such as the anheric water acquisition of Australian aquifers in the 2010-2011 period. The worldwide drop in sea levels was accurately recorded by both altimeter and tide gauge Records.
Second, also on the plus side, is that altimeter readings from 1993 to the present, exhibit linearity, essentially over the entire period. This conforms to tide gauge readings too.
The third, on the negative side, show satellite data Analysis basically doubling the actual sea level rate of rise over the entire span. BWWC must be looked at as a possible source of reportage that is beginning to border upon ludicrous. Coding errors attempting to reconcile radars lacking the ability (from a resolution standpoint) to make precise measurements by more than an order or two of magnitude are another possibility that needs detailed attention. Both deserve intensive investigation, and they deserve it soon.
Your contribution to this problem is sincerely appreciated!!!
Reply
Nate says:
March 7, 2019 at 7:16 PM
‘The third, on the negative side, show satellite data Analysis basically doubling the actual sea level rate of rise over the entire span.’
How do you know that? Where do you find the ‘actual’ rate of rise?
Measurements, including this one, are all we have to determine ‘actual’ rate of rise.
Reply
tomwys says:
March 8, 2019 at 2:18 AM
I have found many tide gauges in tectonically inert places on the globe – places that neither subside nor uplift, and those with greater than a 100 year record and 10 year GPS validation show a steady, linear (unchanging in rate) 1 to 1.4mm/yr non-accelerating rise. This is where you can “…find the ‘actual’ rate of rise” as you requested.
Go to the bottom of the Media Page on the colderside.com website for the EIKE presentation in Munich this past November, for some more detail, particularly on the coding issue. Yet BWWC is a realistic alternative too to “explain” the doubling (including GIA) problem.
PS The great Swedish oceanographer Nils Axel-Mrner has confirmed likewise!
tomwys
You said, “The worldwide drop in sea levels was accurately recorded by both altimeter and tide gauge Records.” Do you (or other readers) know if there was a concomitant increase in surface salinity recorded as the evaporation increased?
So the sea rises by the thickness of a coin every year. I feel the terror growing through my veins.
So you should as the terror lurks everywhere – https://en.numista.com/forum/topic40376.html
Open and shut
I believe that Dr Spencer is confused
Passive microwave instruments have very little in common with the active radar measurements of sea level in Jason/Topex/Poseidon etc.
The radar signal ( travelling with the speed of light) may be slowed down by extra atmospheric mass ( e g by increased vater vapour), but a longer time for the signal to bounce back should be interpreted as a (spuriously) lower sea level.
And water vapour trends from the Pinatubo cooling influenced 1993 to the Super el Nino 2015, what on earth would that have in common with sea level change, since the steric changes as Dr Spencer himself admits are small?
You appear to be the confused one.
Dr Spencer made clear that the issue is not that “a longer time for the signal to bounce back should be interpreted as a (spuriously) lower sea level” but that the correction for this spuriously lower level may be overdone, resulting in the opposite.
Really?
It’s quite obvious that Dr Spence is totally clueless regarding if and how the radar measurements are adjusted for change in water vapor. He can’t even make a sanity check of how much the introduction of x amount of water vapour delays the radar signal and the possible error it would introduce in the sea level readings..
Spencer doesn’t even know if RSS column water vapor in any way is used for correction of sea leve measurements. He can’t demonstrate that RSS column water vapor has a larger trend than other indices during the era of satellite sea level mesurements 1993-2018.
I checked with ERA5, the latest state of the art reanalysis from ECMWF.
The column water vapor trend 1993-2018 for oceans 60N-60S is 0.53 kg/m2/ decade in ERA5, and 0.41 in RSS.
Hence, it looks like RSS underestimates the column watet vapor trend, which according to to the totally unproven speculative Spencer ” chain-of-evidence” means that the satellite sea level measurement are biased low..
Olof R: “may be slowed down by extra atmospheric mass ( e g by increased vater vapour)”
Since dry air average molar wt is about 29.00 (N2 is 28.01, O2 is 32.00, Ar is 39.88), and water vapor is only 18.02, the average molar wt for moist air decreases as the water vapor increases. It is 28.86 at 1% water vapor and 28.64 at 3%, so there is less mass in more humid air.
I have no idea how this affects the apparent radar path length, but more water vapor and less mass seems to imply a higher speed of light.
Yes, water vapour has a lower refractive index than air, and thus allows a higher speed of light.
Thus, If water vapour replaces air in the atmospheric column, the sea level reading will be biased high.
If the water vapour is added to the column the sea level reading will be biased low.
Presumably if sea levels continue to rise at 3.5mm/year in the middle of the oceans and only 1.7mm/year on average at the coasts, ships will soon need to use extra fuel to haul themselves up as they leave port, but on the plus side, they’ll be able to idle their engines and coast downhill into harbour. /sarc
[Moderation-triggering word from earlier post replaced!]
The ocean thus fills its basin with a convex meniscus?
That sounds like something you should see a doctor about.
It’s due to the gravitational pull of the satellite passing overhead pulling more easily on deep water so naturally the shallow water tide gauges need to be adjusted up before adjusting further for the reverse meniscus with all the sunscreen on the rocks and sand of course. Seems you’re completely out of your depth with pier reviewed Greenology and we have the offshore wind turbine effect at the ready for any future skeptical shenanigans.
If you claim that you can measure sealevel from satellites to an accuracy of a fraction of a mm then you imply that you know the position of the satellite to an accuracy even better. Is such an accuracy possible given all kinds of low level effects affecting the orbit such as atmospheric drag, gravity anomalies because of mountains underneath, magnetic effects induced by variations in solar wind, and so on?
What also plays a role is that the weather below, apart from the varying water vapour content discussed by the author, is the actual atmospheric pressure which varies by some 5% between high and low pressure systems and can thus induce a bias in the estimated pathlength.
Are all such effects corrected for? Are we sure the sign of each such correction is correct? (such mistakes have happened before). The only way to find out is to inspect the signal processing and analysis software in great detail. But where can one find such information?
E J Zuiderwijk
The altitude of the satellite is calculated (estimated) from a gravity model that is a smoothed generalization of the unevenly distributed mascons. Gravity models are regularly revised. I’m not confident that all the necessary satellite altimetry corrections are done with sufficient precision to claim sub-millimeter accuracy.
The simple answer is, if the ‘measurements’ support climate doom then there no issue at all, however if they do not, they there is clearly a need for adjustments. That is after the standard technique used in other areas of ‘measurements ‘ where the type of ‘luck’ that would see you banned from the tables of Vegas , is also seen when it comes to ‘need’ to make adjustments to both past and current temperature measurements.
If the discrepancy had been on the low, no-cause-for-alarm side, you can be sure that every detail of the hardware and software would have been put under the microscope until some “error” had been found and addressed. With the discrepancy being on the high side, this provides a marvellous opportunity to splice one data set onto another to manufacture some scary acceleration, enables alarmingly large future sea level rise predictions, and (perhaps cynically, however that’s where we are now) makes it less likely to merit significant investigatory effort.
Up until 1995 satellite altimetry data was calibrated against GPS located tide gauges. Was this stopped? The acceleration, I believe, started after this time. But I’ve never seen either a calibration paper or any announcement regarding calibration since …
One problem with trying to calibrate satellite altimetry against tide gauges is that satellite altimetry cannot measure sea-level at the coasts, and tide gauges can’t measure sea-level anywhere else.
One of the sites was an oil platform. Not far enough offshore IMHO so did not have multiple data points both sides. But since satellite approached from open ocean side had clean data at the platform.
I don’t know the answer to this interesting question, but the celebrated “acceleration” in sea-level rise “measured” by satellite altimetry is clearly dubious.
Nerem et al 2018 claimed to have discovered “acceleration” in the satellite altimetry sea-level data. But when you read the details you discover that the “acceleration” they found was created by slowing the rate of rise of sea-level rise “measured” by Topex-Poseidon prior to 1998. They “fixed” 20yo data, thereby creating the appearance of acceleration when the early Topex-Poseidon data is compared against the newer satellites’ data (even though the new Jason-3 measurements show little sea-level rise, so far). Here’s a graph by Steve Case:
http://sealevel.info/what_nerem_2018_did_to_create_acceleration_steve_case02.png
Activists at NASA heavily promote the dubious Nerem claim with material like this article and video. NASA’s site doesn’t support posting comments, but they posted the video on both Youtube and Facebook, which do support posting comments. That doesn’t do much good, however, because on both YouTube and Facebook, comments on the NASA video are selectively shadowbanned, which prevents correction of the misinformation in the video.
The satellite altimetry had previously been measuring substantial deceleration. But that problem was fixed by Cazenave et al 2014, which explained away the declining trend in the rate of sea-level rise “measured” by satellite altimetry. They managed to massage the data until that embarrassing decline had almost entirely disappeared. (Does that remind you of anything?)
Here are two pairs of graphs from the paper, each with “before” and “after” versions, showing how they “corrected” the work of five different satellite altimetry analysis groups, to almost completely eliminate the decline, which all five groups had measured:
http://sealevel.info/nclimate2159-f1_large_trimmed1.png
http://sealevel.info/nclimate2159-f2_large_trimmed1.png
Even those revisions were small compared to the enormous revisions in ENVISAT measurements, up to a decade after it was “measured.”
What the numerous large revisions in satellite altimetry measurements of sea-level (and their inconsistency with the coastal measurements) demonstrates is how malleable and unreliable the satellite altimetry “measurements” of sea-level are, compared to tide gauge (coastal) measurements:
https://sealevel.info/MSL_global_thumbnails5.html
The science is far from settled
Doesn’t a lens of warm water in a big ocean expand and it is therefore less dense than the colder water beliw and around it. Hence the warm water floats in or on the cold in exactly the same way ice does, without affecting the water level along the coast or at the edge of your glass of gin and tonic. Hence there is no reason to expect global ocean averages and coastal averages to be the same.
Water follows the usual behavior of density being inverse of temperature until you hit 4°C. That’s where the relationship inverts. Until the surface waters reach 39.2°F, what you describe is not happening. If you look at the global sea surface temperatures, you have to go below about -50°S latitude or above 45°N latitude to find those kinds of temperatures. At least as of today.
You are exactly correct, Tim Crome. Changes in ocean surface water temperature & density have a strictly local effect on “sea-level.”
If you warm a section of the ocean’s surface layer, it will rise up, in place, just as happens if you freeze a section of it. The lower the density the higher the sea-level. But that water doesn’t “run downhill” and affect sea-level far away.
Along the boundaries of the warm section there will be a slight more-or-less rotational flow, a mixing action between the warm and cold waters. The warmer water flows away from the warm section at the surface, and the cooler return flow is toward the warm section farther down. That slight rotational flow works to gradually spread the warm spot (as does normal ocean wind and wave action), but the flows to and from the warm section are balanced, so there’s no net flow of water away from the warm spot, and no effect on sea-level at distant tide gauges.
“Gradually” is the key word, though. If your warm spot is 1/3 the area of the Indian Ocean, the temperature-driven flows at its boundary have negligible effect on its size.
D.J. Hawkins, although fresh water has maximum density around 4°, the same is not true for seawater. As you lower its temperature, its density continues to increase even below 0°C, until it freezes. (I don’t know why.)
Thank you , I did not remember that.
Climate4you.com presents global water vapor data at differing altitudes from NOAA and the International Satellite Cloud Climatology Project sources. These data show that water vapor varies from year to year and in general has been declining. Perhaps the RSS sea level data are corrected with respect to what models say the water vapor should be rather than what it has been measured to be.
Great article Dr Spencer. It would nice to see a graph of the SLR calculation, but replace the satellite water vapor data with the ERA analysis and see if the trends more closely resemble the tide gauges. That would serve as yet another piece of evidence that your hunch is correct.