Public Release: 21-Jan-2019
Southwest part of the island could be major contributor to sea level rise
Ohio State University
COLUMBUS, Ohio – Greenland is melting faster than scientists previously thought–and will likely lead to faster sea level rise–thanks to the continued, accelerating warming of the Earth’s atmosphere, a new study has found.
Scientists concerned about sea level rise have long focused on Greenland’s southeast and northwest regions, where large glaciers stream iceberg-sized chunks of ice into the Atlantic Ocean. Those chunks float away, eventually melting. But a new study published Jan. 21 in the Proceedings of the National Academy of Sciences found that the largest sustained ice loss from early 2003 to mid-2013 came from Greenland’s southwest region, which is mostly devoid of large glaciers.
“Whatever this was, it couldn’t be explained by glaciers, because there aren’t many there,” said Michael Bevis, lead author of the paper, Ohio Eminent Scholar and a professor of geodynamics at The Ohio State University. “It had to be the surface mass–the ice was melting inland from the coastline.”
That melting, which Bevis and his co-authors believe is largely caused by global warming, means that in the southwestern part of Greenland, growing rivers of water are streaming into the ocean during summer. The key finding from their study: Southwest Greenland, which previously had not been considered a serious threat, will likely become a major future contributor to sea level rise.
“We knew we had one big problem with increasing rates of ice discharge by some large outlet glaciers,” he said. “But now we recognize a second serious problem: Increasingly, large amounts of ice mass are going to leave as meltwater, as rivers that flow into the sea.”
The findings could have serious implications for coastal U.S. cities, including New York and Miami, as well as island nations that are particularly vulnerable to rising sea levels.
And there is no turning back, Bevis said.
“The only thing we can do is adapt and mitigate further global warming–it’s too late for there to be no effect,” he said. “This is going to cause additional sea level rise. We are watching the ice sheet hit a tipping point.”
Climate scientists and glaciologists have been monitoring the Greenland ice sheet as a whole since 2002, when NASA and Germany joined forces to launch GRACE. GRACE stands for Gravity Recovery and Climate Experiment, and involves twin satellites that measure ice loss across Greenland. Data from these satellites showed that between 2002 and 2016, Greenland lost approximately 280 gigatons of ice per year, equivalent to 0.03 inches of sea level rise each year. But the rate of ice loss across the island was far from steady.
Bevis’ team used data from GRACE and from GPS stations scattered around Greenland’s coast to identify changes in ice mass. The patterns they found show an alarming trend–by 2012, ice was being lost at nearly four times the rate that prevailed in 2003. The biggest surprise: This acceleration was focused in southwest Greenland, a part of the island that previously hadn’t been known to be losing ice that rapidly.
Bevis said a natural weather phenomenon–the North Atlantic Oscillation, which brings warmer air to West Greenland, as well as clearer skies and more solar radiation–was building on man-made climate change to cause unprecedented levels of melting and runoff. Global atmospheric warming enhances summertime melting, especially in the southwest. The North Atlantic Oscillation is a natural–if erratic–cycle that causes ice to melt under normal circumstances. When combined with man-made global warming, though, the effects are supercharged.
“These oscillations have been happening forever,” Bevis said. “So why only now are they causing this massive melt? It’s because the atmosphere is, at its baseline, warmer. The transient warming driven by the North Atlantic Oscillation was riding on top of more sustained, global warming.”
Bevis likened the melting of Greenland’s ice to coral bleaching: Once the ocean’s water hits a certain temperature, coral in that region begins to bleach. There have been three global coral bleaching events. The first was caused by the 1997-98 El Niño, and the other two events by the two subsequent El Niños. But El Niño cycles have been happening for thousands of years–so why have they caused global coral bleaching only since 1997?
“What’s happening is sea surface temperature in the tropics is going up; shallow water gets warmer and the air gets warmer,” Bevis said. “The water temperature fluctuations driven by an El Niño are riding this global ocean warming. Because of climate change, the base temperature is already close to the critical temperature at which coral bleaches, so an El Niño pushes the temperature over the critical threshold value. And in the case of Greenland, global warming has brought summertime temperatures in a significant portion of Greenland close to the melting point, and the North Atlantic Oscillation has provided the extra push that caused large areas of ice to melt”.
Before this study, scientists understood Greenland to be one of the Earth’s major contributors to sea-level rise–mostly because of its glaciers. But these new findings, Bevis said, show that scientists need to be watching the island’s snowpack and ice fields more closely, especially in and near southwest Greenland.
GPS systems in place now monitor Greenland’s ice margin sheet around most of its perimeter, but the network is very sparse in the southwest, so it is necessary to densify the network there, given these new findings.
“We’re going to see faster and faster sea level rise for the foreseeable future,” Bevis said. “Once you hit that tipping point, the only question is: How severe does it get?”
###
Co-authors on the study include researchers from Ohio State, the University of Arizona, DTU Space in Denmark, Princeton University, the University of Colorado, University of Liége in Belgium, Utrecht University in the Netherlands, University of Luxembourg and UNAVCO, Inc.
From EurekAlert!
In the new era measurement system error can get you published.
“This is going to cause additional sea level rise. We are watching the ice sheet hit a tipping point.”
And…they missed the best line, which would have been “We are watching the ice sheet hit the fan.”
From reading all the comments above and some of the links, perhaps the lead in sentence should be:
Greenland was melting faster than scientists previously thought–
If anyone wonders why a study published in 2019 stops in 2012, the answer is here, in Figure 5:
http://polarportal.dk/fileadmin/user_upload/polarportal-saesonrapport-2018-EN.pdf
By the way, if this citation is correct:
“Whatever this was, it couldn’t be explained by glaciers, because there aren’t many there,”
Then this Beavis fellow is quite amazingly ignorant, because there are any number of glaciers there. Apparently he thinks that only tidewater glaciers, i e glaciers that reach the coast are called glaciers.
Also it is odd that he should be surprised that glaciers in SW Geenland retreat more than elsewhere, for this is the area with most ice-free country and the area where the ice-sheet has retreated most during past warmer periods (including the early Holocene). The area is in rain-shadow and there is a saddle between the northern and southern ice domes.
I can’t help wondering about how often these “climate science” innocents express amazement and alarm about things that have long been known and understood. Are they actually that ignorant, or is it all a sham?
Thank you for the link to that DMI PolarPortal report, tty. I hadn’t noticed that they’d posted it on their site. They were a lot quicker this time; the previous one didn’t go up until February 28.
http://polarportal.dk/en/news/news/end-of-the-smb-season-summary-2017/
Confirmed: that’s two glaciological years in a row with no net loss of ice mass from the GIS, compared to about 200 Gt net ice loss (equivalent to 0.55 mm of sea-level) in a typical year.
It’s hard to tell with only the abstract, but it sounds like they looked at data through 2014. (Still ridiculous for a paper published in 2019!) The abstract says, “In mid-2013, an abrupt reversal occurred, and very little net ice loss occurred in the next 12–18 months.”
If it is ridiculous or wrong in some way, does someone or yourself have a better paper to publish as a rebuttal?
I’ll just go with the satellite images showing Greenland covered with ice, ya know, actual evidence you can see.
Indeed. Start at Disko bay and follow the edge of the ice down to Cape Farwell, and count the outlet glaciers. I make it about 75, but it is not always easy to make things out.
No question, that something is happening “faster than we thought” adds urgency to their message.
But what it really says is that there “model” did not get it right.
It reminds of the great “Dot-Com” stock promotion that climaxed in March 2000.
The tout was that the earnings per share report was “higher than expected” and they would ramp the stock up.
Stock analysts would consult with the company spokesman and work out the earnings number.
This was then the “whisper number” and when the report was issued, of course, it was always higher than the “whisper”. The stock price, naturally, would jump.
My comment was that they learned to whisper in saw mill.
Same place where the global warmers learned their “science”.
What a promotion!
It’s always Worse Than We Thought.™
Of course, the press release didn’t link to the paper, so you can’t tell what data they analyzed. But I’ll bet they did not include the last two glaciological years, when Greenland lost no ice at all.
But “there is no turning back, Bevis said.” 😉
Thank you, Bart Tali, for finding the abstract:
Until the last two sentences, it sounds like they attributed the acceleration and then deceleration in GIS mass loss to NAO variations.
As for Dr. Bevis‘s “continued, accelerating warming of the Earth’s atmosphere,” that seems to be the product of fantasy. Here’re a couple of excerpts from a propaganda booklet on the NAS’s own web site, about the “slowdown” in warming:
Meanwhile, in the real world, sea level continues to fall in some places, and rise in more places, at rates not significantly different than they were 90 years and 105 ppmv CO2 ago. All that additional CO2, CH4, etc. has not had any measurable effect on sea-level trends.
https://sealevel.info/MSL_global_thumbnails5.html
More research with a small army of researchers from multi-national educational facilities.
What!? Are they selling options in order to fund the fees charged by publishers? And to fulfill university demands for published papers?
Looks to be 13 authors from a multiple institutions and organizations:
UNAVCO: “UNAVCO, a non-profit university-governed consortium, facilitates geoscience research and education using geodesy.”
“UNAVCO’s core sponsors are the National Science Foundation (NSF) and the National Aeronautics and Space Administration (NASA).”
DTU Space in Denmark: “Technical University of Denmark”,
“Space research and space technology
DTU Space explores the Earth, the solar system, and the universe. We map the Earth’s land, sea and ice masses; measure gravity and the magnetic field; and investigate the solar wind and space weather conditions and their impact on our climate and environment.”
Keep in mind that DTU has some interesting relationships:
“In a range of areas, DTU also handles Denmark’s monitoring and data collection obligations in relation to international treaties. This applies, for example, in the field of fishery, where DTU’s ongoing population measurements are incorporated into the preparation of the pan-European fishery policy.”
For the past 20 years, the United Nations Environment Programme (UNEP) has maintained its UNEP Centre at DTU. The DTU UNEP Centre handles scientific advice assignments that primarily centre on developing countries.”
Questions questions questions… Biased much?
Then to cap off suspicions”
Specious alarmism claim after specious alarmism claim.
It is called confirmation bias.
Don’t we have gravity measuring satellites that tell us the accumulation of ice in Greenland is rising rather than falling?
As you add more ice, it causes more ice to be pushed into the sea which leads to more melting, and there is no actual ice loss or required increase in temperature to cause this.
“–and will likely lead to faster sea level rise–”
“…which Bevis and his co-authors believe is largely caused by global warming,”
Key words, “likely” and “believe”.
This seems to be the latest, most up-to-date NAO graph, from UCAR (I blew this copy up to 200%):
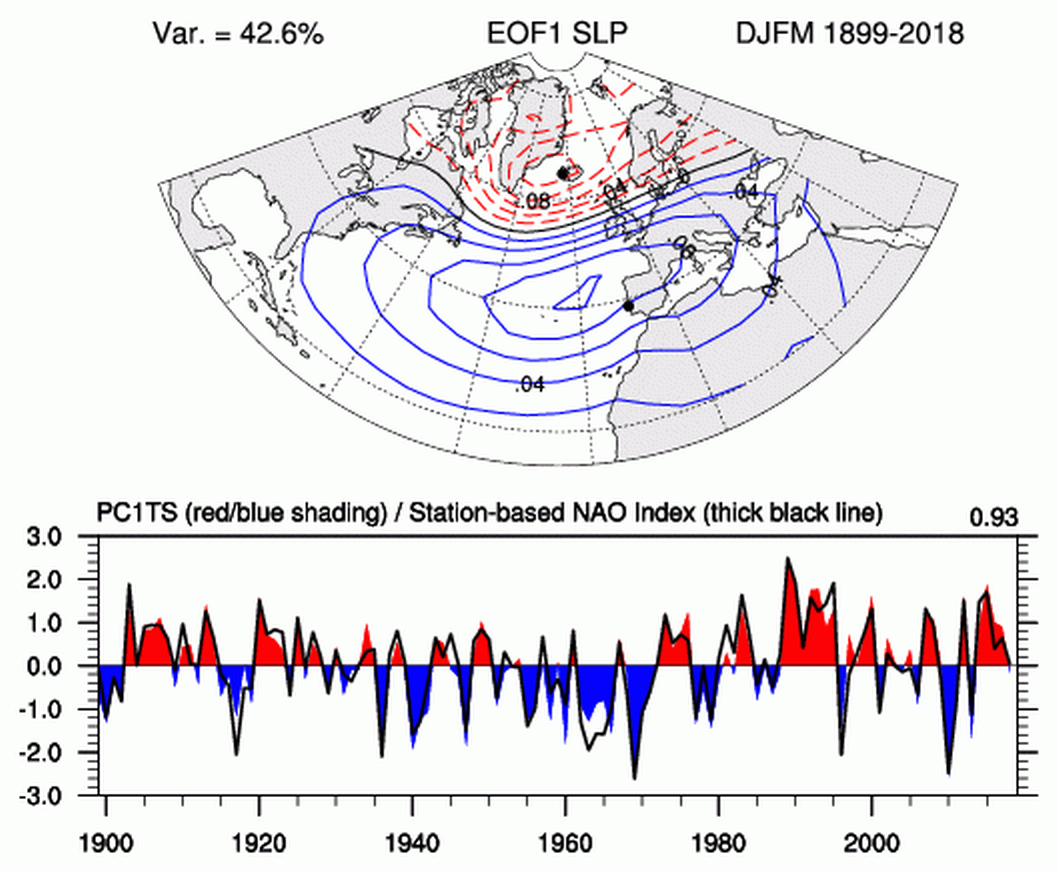
Source:
https://climatedataguide.ucar.edu/climate-data/hurrell-north-atlantic-oscillation-nao-index-station-based
It looks like the NAO went sharply negative around 2010, positive around 2015, and is back to neutral, now.
NOAA also has a graph of NAO, but it’s way out of date:
https://www.nefsc.noaa.gov/ecosys/ecosystem-status-report/climate-forcing.html
“The findings could have serious implications for coastal U.S. cities, including New York and Miami…”
See, even a fake dark cloud can have a silver lining.
Yes indeed,
“When combined with man-made global warming, though, the effects (of the NAO) are supercharged.”
“We are watching the ice sheet reach a tipping point.” etc. etc….
And the CAGW congregation swayed in ecstasy, …
“We believe! Wee Beelieve!!” The consensus congregation chanted as one unite voice.
Such is modern science with its projections of virtual reality visions and vistas, all rounded out with doom-laden fables and parables.
As usual, just follow the money. These papers can be understood by reading the headline and jumping to the last paragraph: since there are few monitoring stations in south wherever, they need to be “densified.”
In other words, SEND MONEY.
LMFAO! Densify! Hahahsa! Damn! Do they really have to make up new words for lying because they don’t want to be held accountable? Couldn’t they just say adjusted for accuracy like all the other climate “scientists”?
They really went there. I’ve been burned by stupid before but that really hurt.
At 280 gtpy it will be gone in the next 12,000 years or so unless the next glaciation cycle intervenes. This is what happens in interglacials. The OMG Greenland is melting Greenland is melting thing has been going on for decades. Here’s an short list of past hypes.
https://tambonthongchai.com/2018/12/21/eemian/
“The patterns they found show an alarming trend–by 2012, ice was being lost at nearly four times the rate that prevailed in 2003.”
Any guesses on what Greenland has been doing in the last 5 years that theese researchers do not want to talk about?
2007-2012 was the peak of the mini-Climate Maximum. We are headed down since then. The 2015-16 El Nino was the last hurrah. By 2030, Climate Science will be talking of Ice Ages again like 1975.
But then of course, the smart Climateers had banked-on a UNFCCC/IPCC kumbaya agreement reducing anthropogenic CO2 emissions before the global climate cycle turned, so that like they did with the 1980-90’s CFC-ozone hustle, they could claim credit for the result.
But anthro CO2 emissions for the next 20 years are going to keep going up and up, and temperatures are headed down.
Oooppps.
This is excellent news for all life on earth. I’ll drink to that!!
Was Waterworld footnoted?
Ice down in the southwest, up everywhere else.
http://www.climatedepot.com/2017/05/24/greenland-ice-mass-near-record/
I take my hat off to Bevis. Its a masterpiece of marketing.
Choose an arbitary data set and period that proves your narrative
Get it peer reviewed and published in a scientific journal.
Get an interview with a science-based electronic magazine and say things like “could” and “believe”
Get that quoted in national newspapers with a scary headline.
Amazing
The truth is out there, somewhere
“These oscillations have been happening forever,” Bevis said. “So why only now are they causing this massive melt?“
And what makes them think that this massive melt hasn’t been happening forever as well? Because it doesn’t appear in the data that only goes back to 2002?
another excellent analysis
https://notalotofpeopleknowthat.wordpress.com/2019/01/22/latest-fake-claims-about-greenland-ice-loss/
I can’t even read this stuff anymore. It is just a steady stream of garbage from these people.
https://gracefo.jpl.nasa.gov/resources/33/greenland-ice-loss-2002-2016/
“Research based on observations from the NASA/German Aerospace Center’s twin Gravity Recovery and Climate Experiment (GRACE) satellites indicates that between 2002 and 2016, Greenland shed approximately 280 gigatons of ice per year, causing global sea level to rise by 0.03 inches (0.8 millimeters) per year”
0.8 mm/y out of the current 3.0 mm/y Wowwwiiieee!!!!
https://en.wikipedia.org/wiki/Greenland_ice_sheet
“Analysis of gravity data from GRACE satellites indicates that the Greenland ice sheet lost approximately 2900 Gt (0.1% of its total mass) between March 2002 and September 2012. The mean mass loss rate for 2008–2012 was 367 Gt/year.”
In the ten years between 2002 and 2012 Greenland lost 2900 Gt which represented –
(0.1% of its total mass) (Yep, read the fine print.)
YES – AN ASTONISHING, NAY STAGGERING EVEN, ZERO POINT 1 PERCENT OF ITS TOTAL MASS!!!!!!!!
Are you effing kidding me? The uncertainty must be 10 times that much.
Who measures this crap and thinks the numbers have substance???
Probably those barely 20 millennials with their participation PhDs.