From Cliff Mass Climate and Weather Blog
Monday, December 24, 2018
Sad News: No More BLOB
A lot of folks are interested in the BLOB, the colorfully named area of warm water that periodically appears over the northeast Pacific. And there is major BLOB news…. it is gone. Let me describe the sad news.

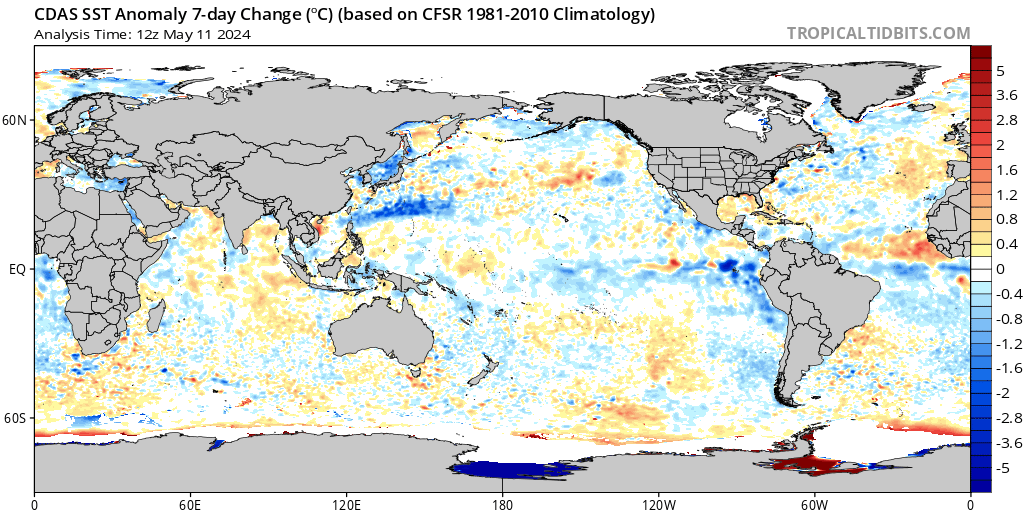
Starting the autumn, the BLOB was relatively weak. To illustrate, here is the sea surface temperature anomaly (difference from normal) for the end of October–as much as 2-3C warmer than normal! This was associated with an area of persistent high pressure over the northeast Pacific.

But compare that situation to two days ago. The BLOB is essentially gone, with an area of cooler than normal water developing. Only immediately along the coast is the water temperature slightly above normal.

What killed the BLOB? Persistent storminess over the northeast Pacific, something that is no surprise to the storm-battered residents of the Pacific Northwest.
Here is the proof: the anomaly of the mid-tropospheric (500 hPa) heights from normal for the last 30 days. Blue and purple indicate lower than normal heights, which is associated with more and deeper low-pressure centers, which in turn cause strong winds. A big area of lower heights (or equivalently pressure) was found over the NE Pacific.

HT/ John F. Hultquist
I was hoping he was talking about the green blob. Ah well.
Steve McQueen’s early big role.
Long live the Blob!
Expect 50+ explanations for the Blob’s demise, assuring us that it will return, stronger and more DEADLY than ever!
And both the absence and presence will be blamed on CO2.
While it is general Green policy to blame all weather events on increasing CO2, I can neither confirm nor deny the presence or absence of correlation between increasing CO2 and particular weather events.
Come on shrnfr, if you’re going to do a non-denial denial, get it right. 🙂
Sorry
Still understood that as well
The BLOB loves bowling alleys.
Unless my eyes deceive me – the weekly vs daily SST graphs have different base periods?
Likely makes no difference, but when you compare apples to oranges you can wind up looking a right nana.
So the blob is still there, hiding in the days either side. ? 😉
You really do look like a right nana, and haven’t debunked anything.
When I come across warmist garbage that compares 2 similar elements using different criteria I point it out, likewise when I come across more rational offerings that are still subject to differing criteria , I point it out.
What do you do? Only accept your favoured result?
fred250
I’m not a science heavyweight (my Ga Tech Physics is a little rusty) but as a (retired) CFO, I’m a financial number-game-playing black-belt.
In this specific instance, I would have preferred to have seen an apples-to-apples comparison. No disrespect to the author, but I’ve really had a belly full of mercury thermometers grafted onto tree rings grafted onto satellites mixed with random undisclosed cherry-picking.
Look at the sst charts at
https://www.ospo.noaa.gov/Products/ocean/sst/anomaly/
For comparison.
Holy cow! the NOAA site explicitly says no updates because the government is shut down.
When those guys come back to work (presumably with back pay), we’re liable to discover Arkansas is now under water and millions of “climate casualties” have been created.
“Unless my eyes deceive me – the weekly “………”To illustrate, here is the sea surface temperature anomaly (difference from normal) for the end of October”
“vs daily SST graphs have different base periods”……….”But compare that situation to two days ago. “
…yep
Nice. How much diff the base period does, and what are the conclusions?
I’m not really expecting the blob being a 1970’s vs 2000’s diff, but then again who said ocean was ready in 1980 with no more any long-time evolving?
So it looks as if California will have a wet winter, or at least not a drought.
NW including northern CA is going to dry out according to Joe Bastardi.
Already EXTREMELY wet here in the SF Bay Area. Obviously EXTREME weather … just as devastating as the EXTREME droughts … ohhhhhhhh mammmmmaaaaa …
However, those of us who are 4th generation Californians … call it … “normal”. However, it is really difficult to monetize normal.
I used to live in Concord, in the East Bay, so three straight months of rain in not unusual. Or a drought.
Agree, I lived in Concord one very wet winter back in the late 60’s and my neighbor told me that this was very unusual. I suppose now he might not have lived there long enough to see the cycles.
Kenji you forgot to include the word “UNPRECEDENTED.”
It sickens me when posters do not get the vernacular down.
Exactly … “unprecedented” … well unless you actually examine the historical precipitation records and patterns. And since nobody can be bothered with actually looking things up … the fake eco media just simply LIE. And if busted on their LIES …. they’ll simply blame it on “Big Oil”.
Or the ever popular “it’s worse than we though”
thought
Unprecedented Normality
Well, here in South London we have had unprecedented dryness.
Quite unprecedented, since at least Monday.
So, it really is worse then I thought.
Please send six-figure research cheques [Checks in the USA] for further research.
Thank you.
Auto
We’ll always have the black blob and even the green blight. So, persons and most people can take comfort in that.
Climate changes….. naturally.
Yes, sometimes recycles back and forth. Tough for those who don’t have a long memory or just look for justification of climate change caused by humans.
I guess now we’ll have to wait for the sequal ‘Son of Blob’.
… and then there’s Sponge Blob …
And for us oldsters in the US, Love That Blob.
I’m sure there were any number of pending papers linking the blob to climate change and tuning models so that they could reverse-predict its existence.
1993 UK Christmas No. 1 – this is the dangerous result when madness infects the crowds.
That is just plain sad and pathetic. My goodness. Not even a groan much less a laugh. Just plain awful.
Thanks and merry Christmas to you too 🙂
Gawwd … that’s even worse than the mock #1 Christmas song in the ubiquitous rerun film “Love Actually”
https://youtu.be/t_KI-mRyE_0
What genre is that? “International music”? “Post New Age”?
Good grief! What have I been missing all my life? (Thank goodness!).
Oh My. I couldn’t stop laughing. The sound of Blobby was just horrible, and the video appeared to be a send up of everything. I saw Richard Branson and ZZ Tops in there.
Wow, that video makes Donny Osmond & family look like geniuses.
It’s obvious. Its heat has not disappesred at all, it just went below. The ocean has eaten the heat again!
Nah, looks to me like to heat blob crawled under the North America continent and re-emerged off the west coast of Greenland.
Yes, it is indeed sad news – there will be so many people out of jobs now – the largest group being cartoonists.
Yes. the weather is getting very fickle these days.
Change in circulation in the stratosphere over the Bering Strait.

I’ve been commenting for the last ~2yrs on not just the disappearance of the big warm blob, but its replacement with cold blobs, not just at the location of the NW Pacific but in both hemispheres around the world.
There is an interesting psychological phenomenon going on here. People of the disastrous warming persuasion see the disappearance of the warm object, but dont notice the global attack of continent sized cold water blobs. These are the basis for an idea that, just like the effect of the hot blob, world temperature movements become decoupled from ENSO. Also, I disagreed with NOAA that another El Nino was in the offing for the new year. There just isnt enough warm water.
Maybe if we painted the elephants lime green, poachers qouldnt see them anymore.
Gary, No to hide the elephants we just need to paint their toenails red so they can hide in strawberry patches. Have you ever seen an elephant hiding in a strawberry patch? It works, doesn’t it?
Reed Coray
Never walk under a cherry tree!
WeatherBELL.com used the ocean sea surface anomalies of The Blob under Gulf of Mexico as a major driver (along with Modoki El Niño & cold northern Atlantic) to predict a colder January to March east of the Mississippi River like the winter of 2002 (which creates -EPO, -AO). The two Joes also state the MJO going into phases 1,2, and 8 and the upper stratospheric warming event as other major non sea surface temps as other factors to predict a US colder winter (opposite of the US GFS model warm prediction). I wonder if this disappearing Blob will change their prediction?
It will not change.
http://tropic.ssec.wisc.edu/real-time/mtpw2/product.php?color_type=tpw_nrl_colors&prod=namer×pan=24hrs&anim=html5
Where are you El Nino?
http://tropic.ssec.wisc.edu/real-time/mtpw2m/product.php?color_type=tpw_nrl_colors&layer=700-850&prod=midpac×pan=24hrs&anim=html5
It couldn’t possible be the changes in the upper atmospheres – which are electrical charged and respond to electromagnetic forces which are 10^39 stronger then gravity.
And even when the charge densities vary with the changing solar frequencies.
To consider any effect affecting the troposphere from anywhere above Mt Everest would contradict 19th century dogma, i.e., if one can can’t stand on it with thermometer in hand- it can’t possible impact the weather – short term or long term.
The loss of the BLOB (I have no idea why it is all CAPS) plus the on-going tropical ElNino creates a SST higher temp gradient, which will drive pressure and wind patterns this winter. Lots of West Coast storms will be strengthened considerably by this.
The climateers and propaganda outlets will if course blame mythical CC.
Show me where El Nino is seen in this animation?
https://www.ospo.noaa.gov/Products/ocean/cb/hotspots/anim.html
The current NINO 3.4 weekly SST departure is +1.0 deg C.
That will likely continue through the Spring 2019.
El Nino.
See more here:
http://www.cpc.ncep.noaa.gov/products/analysis_monitoring/lanina/enso_evolution-status-fcsts-web.pdf
Joel-san:
It looks like the 2018/19 El Niño has already peaked, with Niño 3.4 SST currently at just 0.67C and falling.
It’s already showing signs of breaking up and deep ocean temps are cooling.
With the 4 month lag, global temps will slightly rise through April 2019, and will then likely start falling slightly or remaining relatively static until a strong La Niña develops in 2020/21.
For some reason, NASA is predicting another El Niño developing at the end of next year, but I think that’s just wishful thinking…
Low pressure in Darwin is maintained.

El Nino usually peaks around Christmas. That is the reason it is called “the boy child” (=Christ).
Look at the temperature changes in the Eastern Pacific.

It is all caps because it is evil.
Current circulation in the lower stratosphere.
https://earth.nullschool.net/#2018/12/27/0000Z/wind/isobaric/70hPa/orthographic=-153.54,85.17,288
I think that Joe Bastardi once commented that there was something similar to this (deceased) warm blob back in the 1950’s. It persisted for a year or two before being slowly replaced by a cold blob. This presaged a 20-30 year period of cooling.
The Gulf Stream is slowing in the Atlantic and something similar could be happening in the Pacific. The world’s nonliny-chaotic ocean circulation system periodically undergoes a state transition. It’s changing to a “ground state” of reduced equator to pole heat transport and consequently, climate cooling. The blob was a temporary epiphenomenon of this state transition. Now the long term nature of the transition will become more clear.
Convincing. Thanks!
This was considered to be a contributor to the low arctic ice levels as warm water infiltrated the Arctic Ocean through the Berring Straights. It will be interesting to sea how the arctic ice responds, if this linkage is correct.
Alas poor Blob,it warmed us well.
Oh well prepare for those “unprecedentedly cold” winters,here in the High North.
Naturally it is only weather when the jet stream blows in from the west bringing ocean air over North America,so when there is no Blob we get cooler, but they will insist that is just “weather”.
Of course the next time the Blob sloshes across the Pacific it will be Global Warming once again.
From the short history of temperature at weather stations, we would expect a period of cooling,(if there is a cycle inherent in that 150 years.).
Now if the Blob is broken up, what effect might we expect as pieces of it roll east and then some roll north into the Bering Sea?
Yes the atmosphere is coupled with the ocean surface temperature.
However, the ocean drives the atmosphere more than the atmosphere drives the ocean surface temperature.
In any case, it is wrong to imply that atmospheric storminess made the BLOB smaller without noting that the arrow of causality may point the other way.
Also, the BLOB is still there. It is just smaller.
Sugar Bear for the win.
Intuitively, the BLOB would be a big patch of water that is measurably warmer than the waters surrounding it.
But that’s not necessarily what the SST anomaly charts above display. They show patches of water that are warmer/cooler than that same patch was during some previous 30-year ‘base period’ (1970-2000, 1980-2010 etc). It doesn’t necessarily mean the surrounding waters were warmer or cooler.
So, is there a formal (i.e. “scientific”) definition of the “Northeast Pacific BLOB”?
I think the 500 mb height anomaly chart (the last chart) is closer to my intuitive notion of a blob, in the sense that 500 mb height measurments can be interpreted as a crude kind of thermometer.
Increasing height is warmer and decreasing height is cooler than the water below (aka “BLOB”). The ‘standard’ height for 500mb is 5500 meters, so the purple areas are about 5400 meters, which is “measurably cooler” water. If we can find heights higher than 5500 meters (i.e. +100m anomaly), then perhaps we have proof of the BLOB’s existence. (Recall that height anomalies are reported in decameters (“dam”))
I agree: There is no blob if you look at the actual sea surface temperature maps.
I had noticed this from the get go.
There is no patch of warm water, only a patch of water than is warmer than the long term averages.
To me, if there is no blob of warm water, there is no blob…it is a mere statistical apparition…a ghost.