From the “snowfalls are a thing of the past” department, comes this bit of news that’s sure to be blamed on “global warming”.

Overview
The month of December is well underway and there have already been some impressive snow accumulations for the month in such places as the Upper Midwest, western US and, most recently, in a large swath from Texas to North Carolina/Virginia with the very latest major winter storm. As it turned out, the month of November ended up with the most snowfall ever recorded in North America during the satellite era which goes back to the 1960’s. Unusual cold for the month from Mexico-to-US-to-Canada contributed to this snowfall record in North America. The November snowfall extent in the Northern Hemisphere was the third highest ever recorded in the satellite era and continues an upward trend in recent years.

Snow cover anomalies for the month of November across the “Northern Hemisphere”; courtesy Rutgers Snow Lab</p>”>
Discussion
November’s average snow cover across North America was an estimated 5.24 million square miles, topping the previous November record of 5.11 million square miles set in 2014, according to data from the Rutgers University Global Snow Lab (GSL) dating all the way back to 1966. The US experienced cold and stormy weather and this resulted in some of the earliest snowfalls ever recorded in such places as Houston, Texas and Monroe, Louisiana. A major storm that impacted much of the I-95 corridor at mid-month resulted in New York City’s (Central Park) heaviest November calendar-day snow in 136 years and the earliest ever for a reading of 6 inches or more (6.4”) as well as a pair of days that failed to get above freezing (Thanksgiving Day and Black Friday). In addition, the 8.1 inches recorded in Allentown, Pennsylvania (Allentown Lehigh Valley Airport) was the heaviest November snowfall there since records began in 1944 (source EPAWA, twitter). The 1.4 inches of snow recorded at Reagan National Airport (DCA) in Washington, D.C. at mid-month was their first measurable November snow accumulation since 1996.

The last weekend of November featured a major snowstorm that pummeled the region from the central Plains to the Great Lakes and Chicago’s O’Hare Airport got off to its snowiest start to a winter season since the 1950’s with a foot of snow. In a typical year, it takes until the second week of January for O’Hare to receive that amount (according to weather.com). New England got hit very hard in late November with, for example, more than 19 inches recorded at Burlington, Vermont. Snow even returned to the state of California during the second half of November after an extensive dry spell ended with the onslaught of storms that moved in from the Pacific Ocean. Many spots in the Sierra Nevada Mountains ended up with 2 or 3 feet of snow in a late month storm that also produced heavy rainfall in coastal sections.
Story via Perspecta Weather, read much more here
And it continues, there’s quite a bit of snow in North America today.
| Area Covered By Snow Today: | 46.7% |
| Area Covered Last Month: | 24.5% |

Source: https://www.nohrsc.noaa.gov/nsa/
There is a lot of empirical evidence showing we’re heading into a new cooling period:
1) Norther Hemisphere Snow Extents increasing.
2) Greenland Land Mass increasing: NSIDC said 2017’s Greenland Ice Mass gain was a 1-in-100 year event. 2018 will also show a gain…. According to statistics, having two back to back 1-in-100-year events is a 1 in 10,000-year event..
3) Arctic Summer Ice Minimums haven’t significantly changed since 2007. Some CAGW alarmists predicted the Arctic would be “ice free” by the summer of 2012… not so much.
4) No statistically significant global warming since mid-1996, despite 30% of all manmade CO2 emissions since 1750 being made over the last 22 years…
5) According to NASA’s October 31, 2015 report, Antarctic Land Ice Mass has been increasing at 80~100 billion tons/year since satellite data started in 1992.
6) UAH6.0 global temps are currently well below all 105 CMIP5 model projections. The CMIP5 model average predicted global temps would be at +1.15C by now, but as of November 2018, the global temp anomaly is just 0.28C…
I think all these cooling events are being caused by:
1) An approaching 50-year Grand Solar Minimum event starting from 2020.
2) The PDO, AMO and NAO are either in–or soon will be soon–their respective 30-year ocean cool cycles. The last time this happened (1945~1978), global temps fell for 33 years. This also happened from 1880~1910, which also led to 30 years of global cooling.
On a side note, given the rapid increase of seismic activity around the world, I think a VEI5+ volcanic eruption will occur soon since the last one was in 1991 and these occur every 30 years or so, which will also generate a short-term global cooling spike.
Point (2)
Once in 10,000 years …
That’s the timescale of an interglacial.
Interesting times
Hi Samurai.
Good post. Hope we are both wrong.
Best, Allan
https://wattsupwiththat.com/2018/07/17/oddly-quiet-sun-3-weeks-without-sunspots/#comment-2407423
[excerpt]
I predicted that natural global cooling would commence by 2020 to 2030, in an article published 1Sept2002 in the Calgary Herald. I am now leaning closer to 2020 for cooling to start, possibly even earlier. I hope to be wrong. Humanity and the environment suffer during cooling periods.
I suggest that it is long past time for society to prepare for the possibility of moderate global cooling.
This would involve:
1. Strengthening of electrical grid systems, currently destabilized by costly, intermittent green energy schemes;
2. Reduce energy costs by all practical means.
3. Development of contingency plans for food production and storage, should early frosts impact harvests;
4. Develop contingency plans should vital services be disrupted by cold weather events – such as the failure of grid power systems, blocking of transportation corridors, etc.
5. Improve home insulation and home construction standards.
The current mania over (fictitious) catastrophic global warming has actually brewed the “perfect storm” – energy systems have been foolishly compromised and energy costs have been needlessly increased, to fight imaginary warming in a (probably) cooling world.
I suggest this is the prudent path for Western societies to follow. It has no downside, even if global cooling does not occur, and considerable upside if moderate cooling does commence.
Best, Allan
My friend is no longer at the EIA, so I sent the above note and this one to the White House.
Hope they read their mail… 🙂
https://wattsupwiththat.com/2018/11/17/will-the-snowiest-decade-continue/#comment-2521694
Prior to the record snowfall in the winter of 2014–15, Joe d’Aleo and I sent a written warning to my friend at the EIA, stating that the NWS weather forecast that EIA used was extremely in error, and warning of a very cold and snowy winter to come, especially for the Northeast Coast.
The EIA reran their lower 48 USA energy demand for that winter using Joe’s forecast and calculated an additional 11% total energy required for the winter months. The actual energy consumption were one percent lower than Joe’s forecast and 10% higher in the NWS forecast. That is a huge amount of energy.
I do not know what contingency the EIA uses, so I don’t know if we saved any lives. Nevertheless, I believe we did a good deed and we may have indeed significantly reduced human suffering.
In summary, if you want an accurate weather forecast, go to WeatherBell, not NWS.
Allan-san:
Excellent advice, Allan-san.
I share your concerns about the US electrical grid, which has been devasted by insane Leftist alt-energy policies and also generally poor maintenance of the grid.
The US electrical grid isn’t even protected from EMP surges, which will have horrific consequences when (not if) the next Carrington Event occurs.
I’m also concerned about cold-induced famines. During the Wolf Grand Solar Minimum (1280~1350), famines and exposure from brutally cold winters, late/early frost events, and shortened growing seasons wiped out 25% of Europe’s population, only to be followed by the Black Death (1352~55), which wiped out 50% of the remaining population.
I’m not sure what government measures can (or should) be taken to alleviate the effects of global cooling on crops, especially in Northern latitudes, although GMO cereal crops with shortened harvest times would help.
I do love the Immutable Law of Leftist Irony—policies designed to “Save the World” from the Global Warming Hoax may, ironically, actually lead to the needless deaths of millions during a global cooling event…
We live in interesting times, Allan-san.
Allan, Sam – IMO you are (unfortunately) both right. Also, it appears that warming might have ended around 2002 with the last el Nino temporarily interrupting the flat trend. The slope change from uptrend to flat trend shows in the UAH trend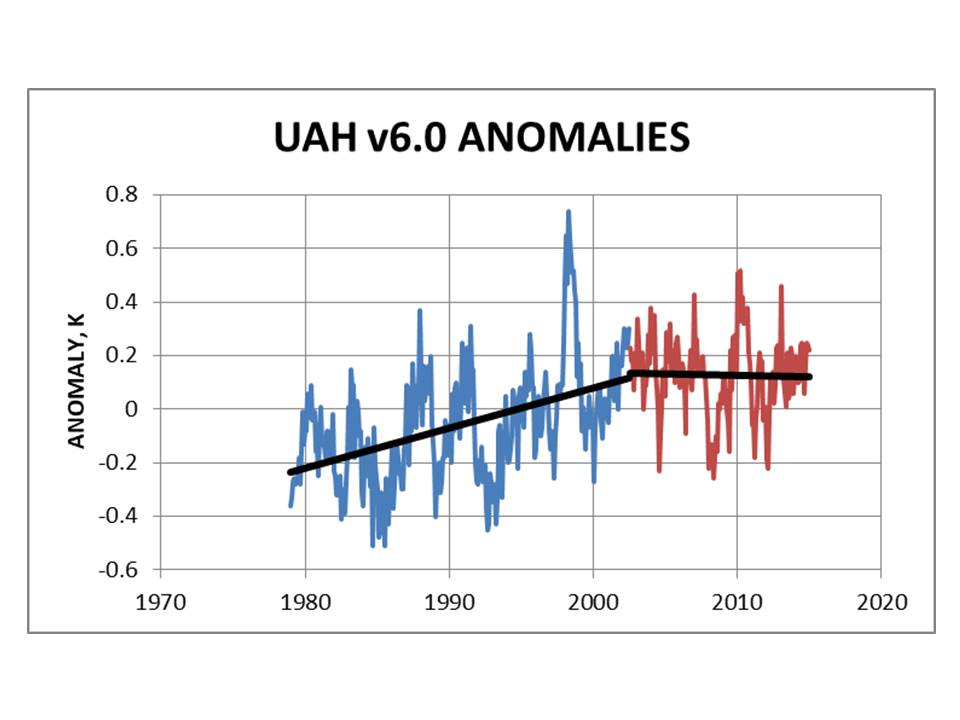 I agree the downtrend should be apparent soon. Based on some earlier work, I expect the downtrend to be about the same rate as the circa 1990 uptrend of only about 0.2 K per decade.
As to WV/precipitation, it correlates with irrigation increase so the precipitation trend is probably up to stay and we should enhance infrastructure to attend to it.
Hi Dan,
CAnnot find this recent NIAC report on threats to the grid.
Best wishes for the Holidays to you and yours,
Allan
Homeland Security Report: RE Electric Grid
https://thepoliticalinsider.com/homeland-security-report-terrorists-profound-threat-electric-grid/?utm_campaign=TPI_Afternoon_Newsletter_12_11_2018&utm_source=critcialimpact&utm_medium=email&utm_content=4f8aaf1fe29956bda6473c7b9fa19141&source=CI
By Daily Caller
Jason Hopkins on December 10, 2018
[excerpt]
A new government report warns that the United States would be woefully unprepared in the event of a catastrophic power outage, regardless of what the cause may be.
“The risk posed by a catastrophic power outage, however, is not simply a bigger, stronger storm. It is something that could paralyze entire regions, with grave implications for the nation’s economic and social well-being,” read a 94-page report prepared for the Department of Homeland Security in December. “Most importantly, the scale of the event—stretching across states and regions, affecting tens of millions of people — would exceed and exhaust mutual aid resources and capabilities.”
The analysis was conducted by the President’s National Infrastructure Advisory Council (NIAC), a group of senior executives who are involved in the operation and maintenance of critical infrastructure.
The NIAC found that the country’s current response plans for a “catastrophic” power failure — a widespread power outage that could arise without warning and last several weeks to several months — is not nearly adequate.
___________________
So let’s put a whole bunch of intermittent, destabilizing wind and solar at the far end of the grid – what could possibly go wrong. Other states have done it, right?
Let’s ask our friends in South Australia. Hello, South Australia? Hello? Hello? Hello?
Geez – there’s no answer…
So let’s put a whole bunch of intermittent, destabilizing wind and solar at the far end of the grid – what could possibly go wrong? Other states have done it, right?
Let’s ask our friends in South Australia. Hello, South Australia? Hello? Hello? Hello?
Geez – there’s no answer…
“Norther Hemisphere Snow Extents increasing.”
Is it?

4 of the last 10 winters had -ve anomalies….
You are aware that snow extent is not a proxy for temperature?
As in that extent increases at the margins where cold and warm air-masses meet.
and over a snow field T2 temps may vary between just above freezing to as low as minus loads.
As in warmer air is wetter and given a climate that has a -ve winter mean then even a 1 deg increase in temp of an air-mass near 0C would hold over 4% more precipitable water.
It appears to be melting quicker/earlier ….
https://climate.rutgers.edu/snow
“Greenland Land Mass increasing: ”

Again – is it?…
“Arctic Summer Ice Minimums haven’t significantly changed since 2007.”
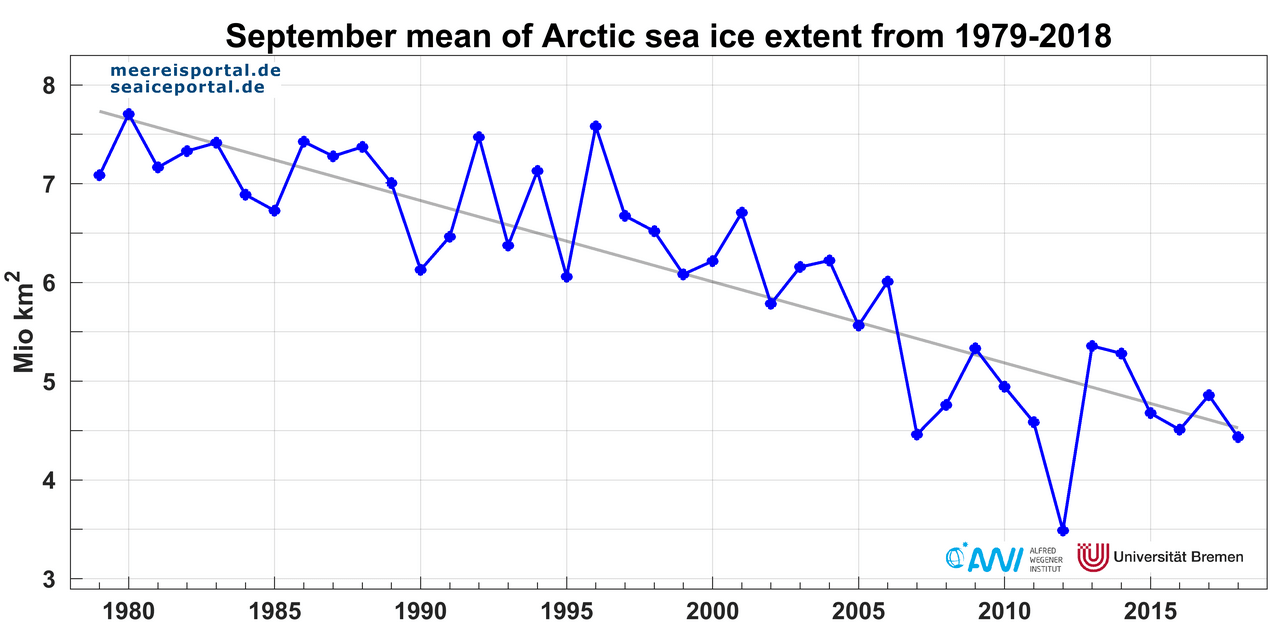
Except for 2012 that is – which as an enormous outlier would be difficult to beat in the short term – Still on trend of the long-term decline…..
However greatest warming is occurring over the Arctic in Winter – and we see that in the decline in max extent in March ….

“Some CAGW alarmists predicted the Arctic would be “ice free” by the summer of 2012”
No, one did – Wadhams. He isn’t the IPCC.

This is the IPCC projection ….
“No statistically significant global warming since mid-1996”
Just out and out blind denial ….
http://notrickszone.com/wp-content/uploads/2018/07/Temperature-UAH.png
” According to NASA’s October 31, 2015 report, Antarctic Land Ice Mass has been increasing at 80~100 billion tons/year since satellite data started in 1992.”
Has it?
This is more up to date ….
http://www.antarcticglaciers.org/2018/06/mass-balance-antarctic-ice-sheet-1992-2017/
http://cdn.antarcticglaciers.org/wp-content/uploads/2018/06/IMBIE-team-2018-figure-2.jpg
“UAH6.0 global temps are currently well below all 105 CMIP5 model projections”
UAH is a massive cold outlier that estimates (by virtue of an algorithm) the radiances meassued by a single instrument – the AMSU onboard NOAA15 – which both does not agree with it’s predecessor MSU before 1998 and does not agree with both RATPAC A sonde data and ERA5 reanalysis. Another “interpretation” of it comes from RSS and that is much closer to the surface record (which comes from thousands of sensors).
Additionally greatest warming is occurring nocturnally over land (under a surface based inversion) which the AMSU CANNOT measure.
https://drive.google.com/file/d/15gUj5AcD-gAqJ4HVYXu_3xYvUtwBvtOO/view
Anthony-san:
1) Since the PDO entered its 30-year cool cycle, Norther Hemisphere snow extents have been increasing.
2) NSICD reported Greenland’s Land Ice Mass increased 46 billion tons in 2017, and about 20 billion tons in 2018.
3) Of course after NASA’s 2015 ICESAT report showing Antarctic Land Ice grew at 80 billion tons/year since 1991, they’d come out with a “new and improved version” that miraculously shows just the opposite… How convenient..
3) UAH is the only valid global temp dataset remaining… The others have added so much heat to raw temp data, they’re now rubbish. BTW, the UAH6.0 dataset match almost perfectly with radiosonde global temp dataset; HADCRUT, GISTEMP and RSS certainly don’t.
The 2012 Arctic summer low was caused by the strongest and longest Arctic cyclone in 50 years, not CO2 induced warming…
There wasn’t a global warming trend from mid-1996 to mid-2015:
http://www.woodfortrees.org/plot/uah6/from:1996.6/to:2015.7/plot/uah6/from:1996.6/to:2015.7/trend/plot/esrl-co2/from:1996.6/to:2015.7/normalise/trend/plot/esrl-co2/from:1996.6/to:2015.7/normalise
The 2015/16 warming spike anomaly was caused by the 2015/16 Super El Niño event, not CO2 induced warming…
Low temperatures (C) in the south of the US, as on December 11.

El Niño does not help.
https://www.longpaddock.qld.gov.au/soi/
Hudson Bay frozen already.
http://masie_web.apps.nsidc.org/pub/DATASETS/NOAA/G02186/plots/4km/r10_Hudson_Bay_ts_4km.png
I knew.
I am puzzled as to why north America is mostly affected by the cold. And not Europe.
Look at the vertical component of the geomagnetic field. During the minimum solar period, the circulation coincides with the field lines.
http://www.geomag.bgs.ac.uk/images/charts/jpg/polar_n_z.jpg
Look at the temperature distribution in the lower stratosphere.

I’ll make the same comment that I make when the alarmists go on and on about heat records.
Basically, the record doesn’t go back all that far.
Of course this be down the AGW , you can frankly ask is anything not down to AGW, or claimed to be ?
Uhmmm,,,
Just don’t say that. “All-Time Record?'”
Earth goes back a LOT longer than records of snowfall.
Just do not say that, makes us all look like idiots, starting to agree with Mosher the Skeptic of Skeptics, demanding better science…