And What Have the Average Temperatures of Earth’s Surfaces Been Recently in Absolute Terms, Not Anomalies?
The answers may surprise you.
THIS POST HAS BEEN UPDATED. The update is near the end of the post.
Recently, the Intergovernmental Panel on Climate Change (IPCC) and the U.S. Global Change Research Program (USGCRP) have cranked up their alarmist propaganda, with the IPCC now pushing the goal of limiting global warming to 1.5 deg C above preindustrial global surface temperatures.
That, of course, initiates the title question, What Was Earth’s Preindustrial Global Mean Surface Temperature, In Absolute Terms Not Anomalies, Supposed to Be?
Four years ago, in the post On the Elusive Absolute Global Mean Surface Temperature – A Model-Data Comparison (WattsUpWithThat cross post is here), we illustrated and discussed the wide (3-deg C) span in the climate model simulations of global surface temperatures on an absolute, not anomaly, basis. Figure 1 below is Figure 5 from that post. In that post, we started the graphs in the year 1880 because the GISS Land-Ocean Temperature Index (LOTI) and NOAA NCDC (now NOAA NCEI) data started that year.

Figure 1
However, the spreadsheets I prepared for that post had the climate model hindcast outputs as far back as their common start year of 1861. (I say common start year of 1861 because the outputs of some models stored in the CMIP5 archive start in 1850 while others begin in 1861.) So I couldn’t use the climate model outputs stored on that spreadsheet for this post.
Note: The IPCC’s new definition of preindustrial, as stated in their Changes to the Underlying Scientific-Technical Assessment to ensure consistency with the approved Summary for Policymakers:
The reference period 1850-1900 is used to approximate pre-industrial global mean surface temperature (GMST).
It’s odd that the IPCC selected those years when not all the climate models used in their 5th assessment report (those stored in the CMIP5 archive) for simulations of past and future climates extend back to 1850. Some only extended back to 1861. Then again, no one expects the IPCC to be logical because they’re a political, not scientific, entity.
Luckily, the ensemble members that meet the criteria of this post do extend back to 1850. So we’ll use the ensemble member outputs for the full IPCC-defined preindustrial period of 1850 to 1900 for this post.
ACCORDING TO THE CMIP5-ARCHIVED CLIMATE MODELS THERE’S A WIDE RANGE OF SIMULATED PREINDUSTRIAL GLOBAL MEAN SURFACE TEMPERATURES
The source of the outputs of the climate model simulations of global mean surface temperature used in this post is the KNMI Climate Explorer. Specifically, as a pre-qualifier, I used the outputs of the simulations of Surface Air Temperatures (TAS) from 90S-90N from the 81 individual ensemble members. From those, I identified the ensemble member with the warmest global mean surface temperature for the preindustrial period and the ensemble member with the coolest global mean surface temperature for the same period. For those who wish to confirm my results, the coolest (lowest average absolute GMST for the period of 1850-1900) is identified as IPSL-CM5A-LR EM-3 at the KNMI Climate Explorer, and the warmest (highest average absolute GMST for the period of 1850-1900) is identified there as GISS-E2-H p3. The average global mean surface temperatures for the other 79 ensemble members during preindustrial times rest between the averages of the two ensemble members.
The outputs of the simulations of global mean surface temperature from those two (the warmest and coolest absolute temperatures) ensemble members for the preindustrial period of 1850-1900 are illustrated in Figure 2, along with their respective period-average global mean surface temperatures for the IPCC-defined preindustrial period of 1850 to 1900 (dashed lines).

Figure 2
As noted at the bottom of the illustration, The Scientists Behind the CMIP5-Archived Models (Used By the IPCC for AR5) Obviously Believe Earth’s Preindustrial Average Surface Temperature Should Be Somewhere Between 12.0 Deg C and 15.0 Deg C. The modelers at the Goddard Institute for Space Studies (GISS) and at the Institut Pierre-Simon Laplace (IPSL) would NOT have archived those models if they hadn’t believed they were of value.
AND WHAT HAS BEEN THE AVERAGE GLOBAL MEAN SURFACE TEMPERATURE FOR THE PAST 30 YEARS?
On their data page here, for converting their anomaly data to absolute global means surface temperatures values, Berkeley Earth lists the factor (14.186 deg C) that is to be added to their annual global mean (land plus ocean, with air temperature over sea ice) surface temperature anomaly data. On the other hand, after discussing why it’s so difficult to determine the global mean surface temperature in absolute terms, GISS states on an FAQ webpage here:
For the global mean, the most trusted models produce a value of roughly 14°C, i.e. 57.2°F, but it may easily be anywhere between 56 and 58°F and regionally, let alone locally, the situation is even worse.
[SEE THE UPDATE NEAR THE END OF THE POST.]
So, for the purpose of this very simple illustration and comparison, and for the discussions it will generate, I’ve added 14 deg C to the annual GISS LOTI data available here, and added 14.186 deg C to the annual Berkeley Earth data. I also compared them to the 12.04 deg C to 15.05 deg C range of hindcast preindustrial global mean surface temperatures from the climate model ensemble members discussed earlier. See Figure 3. Not too surprisingly, the Berkeley Earth and GISS global mean surface temperatures, in absolute form, are very similar, with only a 0.1 deg C difference during the most recent 30-years.

Figure 3
As is plainly visible and as noted at the bottom of the illustration, The Most-Recent 30-Year Averages of Observed Global Surface Temperatures Have Not Yet Reached the Warmest of the Modeled Preindustrial Global Temperatures!
In other words, based on 30-year climatological averages, recent global mean absolute surface temperatures have yet to reach the high end of the range of preindustrial global mean surface temperatures as hindcast by the climate models used by the IPCC for their 5th Assessment Report. It could, therefore, be argued that recent global mean surface temperatures are still within the realm of preindustrial natural variability, regardless of the 1 deg C that the Earth’s surfaces have risen since pre-industrial times.
If you look closely at Figure 3, you can see that the Berkeley Earth data recently peaked in 2016 at slightly above the highest of the simulated preindustrial average temperatures…with the 2014/15/16 El Niño-caused “record high” of 15.1 deg C. On the other hand, the GISS data peaked just below in 2016, at a “record high” of 15.0 deg C.
[sarc on.] Oh, heaven forbid! Based on the Berkeley Earth data, Earth’s global mean surface temperatures are now starting to run a teeny bit higher than the range of pre-industrial average temperatures. What are we to do, other than sit back and enjoy the vacation from cooler temperatures? [sarc off]
One might suspect that a simple comparison like this is one of the real reasons why the primary suppliers of global mean surface temperature data do not furnish their data in absolute form. Thank you, Berkeley Earth, for sparking my interest. We discussed another possible reason in the post Do Doomsters Know How Much Global Surface Temperatures Cycle Annually?
DEAR TROLLS, IF YOU LINK THE FOLLOWING WEBPAGE FROM REALCLIMATE TO SUPPORT YOUR ARGUMENT, SOME READERS WILL LAUGH AT YOU
In an apparent response to the 4-year-old post linked earlier (here) and to Willis Eschenbach’s post CMIP5 Model Temperature Results in Excel at WUWT that followed a month later, just after those two posts, in 2014, there was a discussion at RealClimate of modeled absolute global surface temperatures, authored by Gavin Schmidt, the head of the Goddard Institute of Space Studies (GISS). Gavin’s post is Absolute temperatures and relative anomalies. (Archived copy is here, just in case.)
The following are a couple of quotes from Gavin’s post. First (my boldface):
Second, the absolute value of the global mean temperature in a free-running coupled climate model is an emergent property of the simulation. It therefore has a spread of values across the multi-model ensemble. Showing the models’ anomalies then makes the coherence of the transient responses clearer. However, the variations in the averages of the model GMT values are quite wide, and indeed, are larger than the changes seen over the last century, and so whether this matters needs to be assessed.
Needs to be assessed? A 3-deg C span in modeled global mean surface temperatures, which is “larger than the [1-deg C] changes seen over the last century”, hadn’t been assessed by 2014? Oy vey! As shown in the graph generated by the KNMI Climate Explorer in Figure 4, a similar 3-deg C spread in modeled absolute global surface temperatures existed in the models archived in CMIP3, which was used by the IPCC for their 4th Assessment Report published way back in 2007.

Figure 4
Note: For those questioning the coordinates listed in the above graph, the “-180-180E -90-90N” reads 180W to 180E, 90S to 90N. [End note.]
Second quote from Gavin’s post (my boldface):
Most scientific discussions implicitly assume that these differences aren’t important i.e. the changes in temperature are robust to errors in the base GMT value, which is true, and perhaps more importantly, are focussed on the change of temperature anyway, since that is what impacts will be tied to. To be clear, no particular absolute global temperature provides a risk to society, it is the change in temperature compared to what we’ve been used to that matters.
Implicitly assume! I love that. Makes me laugh. Such is climate science.
And I really enjoy, “To be clear, no particular absolute global temperature provides a risk to society, it is the change in temperature compared to what we’ve been used to that matters.” Maybe the IPCC, the USGCRP and mainstream media should take that quote to heart. Hmmm, I feel a new post forming as I write this. I’ll most likely post it in a few days.
And if those two quotes look familiar, I presented them in the December 2014 post Interesting Post at RealClimate about Modeled Absolute Global Surface Temperatures (WattsUpWithThat cross post is here.)
As with all my model-data presentations, I suspect there will be complaints by the usual whiners.
That’s it for this post. Have fun in the comments and enjoy the rest of your day.
UPDATE REGARDING THE 14.0 DEG C ABSOLUTE TEMPERATURE FACTOR ADDED TO THE GISS ANOMALIES
There was no specific time period listed in the GISS FAQ link (here), or in the quote from it, presented earlier in the post, that I provided for the 14.0 deg C factor to be added to the GISS LOTI data to produce global temperatures in absolute form. (Thanks, blogger Dee at WUWT.) The 14.0 deg C factor used to be (past tense) listed at the bottom of the GISS LOTI data page and they were referenced to the period GISS uses for anomalies, 1951-1980. But the 14.0 deg C (57.2 deg F) factor is no longer listed on that GISS data page. GISS removed it for some reason. But archived versions of that webpage still exist (example here). There you’ll find:
Best estimate for absolute global mean for 1951-1980 is 14.0 deg-C or 57.2 deg-F, so add that to the temperature change if you want to use an absolute scale (this note applies to global annual means only, J-D and D-N !)
[End Update.]
STANDARD CLOSING REQUEST
Please purchase my recently published ebooks. As many of you know, this year I published 2 ebooks that are available through Amazon in Kindle format:
- Dad, Why Are You A Global Warming Denier? (For an overview, the blog post that introduced it is here.)
- Dad, Is Climate Getting Worse in the United States? (See the blog post here for an overview.)
To those of you who have purchased them, thank you. To those of you who will purchase them, thank you, too.
Regards,
Bob
The best performing CMIP5 model was INMCM4. The latest version is INMCM5 preparing to qualify for CMIP6. There are descriptions of improvements made and as of last month, a new hindcast comparable to what is discussed above. As the image shows 7 model runs were averaged for comparison to HADCRUT4.
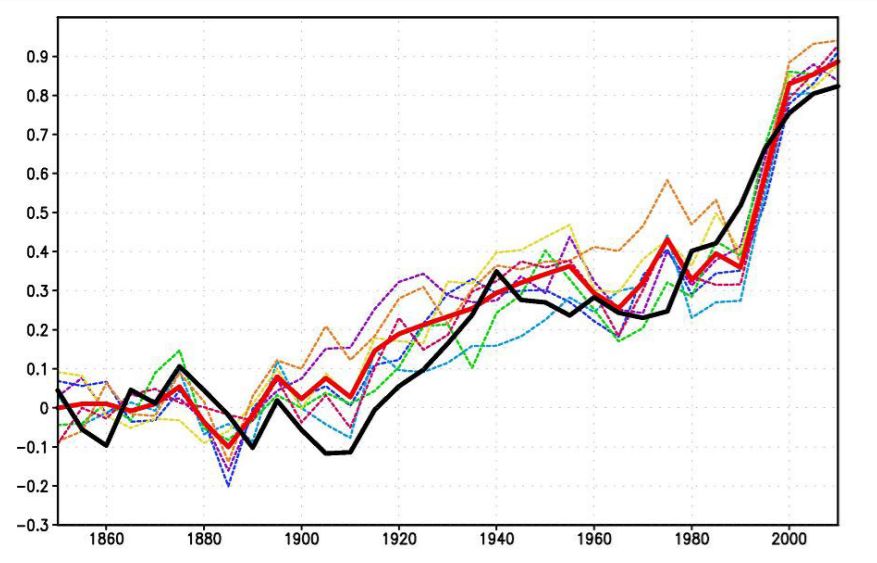
Figure 1. The 5-year mean GMST (K) anomaly with respect to 1850–1899 for HadCRUTv4 (thick solid black); model mean (thick solid red). Dashed thin lines represent data from individual model runs: 1 – purple, 2 – dark blue, 3 – blue, 4 – green, 5 – yellow, 6 – orange, 7 – magenta. In this and the next figures numbers on the time axis indicate the first year of the 5-year mean.
HADCRUT4 uses 12 monthly global averages for the period 1961 to 1990, with a resulting average annual mean of 13.97C.
More on INMCM5 at https://rclutz.wordpress.com/2018/10/22/2018-update-best-climate-model-inmcm5/
STUPID QUESTION: Does the phrase, “averaging model runs”, really make any sense ?
Isn’t an “average of model runs” just another absurdity ?
All of a sudden, it just seemed ridiculous.
False insight? or late-blooming glimmer of brilliance ?
Robert, when the runs are from the same model, each one is a scenario. The average is a better representation of the model’s behavior than a single run. Whether any of them will become reality is another question. The fact that the hindcast is realistic is encouraging. And as you say, HadCRUT4 is itself a proxy (estimate) of a fictitious GMT. But as R.G. Brown used to say, it’s the only game in town.
Ron, as noted in the second citation, the different model runs were based on different assumptions, e.g. ~60 year oscillations, etc. Averaging model runs with differing assumptions gives nonsense.
From Volodin et al. 2018
“Seven model runs were started with different initial conditions obtained from long preindustrial run, where all external forcings were prescribed at the level of year 1850. The length of preindustrial run was several hundred years, so upper oceanic layer was adjusted to atmospheric model conditions, but it is not the case for the deep ocean. A small trend of model climate is visible because of deep ocean adjustment to upper oceanic and atmospheric conditions – a common situation for simulation of historical climate with present day climate models. The obvious reason for multiple integrations is to separate the role of natural variability and external forcing in climate changes. When data of seven model runs are consistent with each other, then one can expect that the phenomenon of interest is a manifestation of (or response to) an external forcing. If there is a noticeable difference between different model runs, then a role of natural variability is crucial. To estimate statistical significance of near surface temperature trend, t-test at 99% level was used. Variance of 5 year means was calculated from 1200 years of preindustrial run.”
IIRC R.G. Brown made a post explaining why averaging the model runs was ridiculous and unscientific. I wish he still posted here. We was both objective and informative.
Regarding hindcasts: how can they be so accurate and their forecasts be completely inaccurate? On top of that what the hindcasts are matching is not an actual thing — it’s a construct. On top of that, we have no idea what the global temperature was in 1850, and certainly not accurately to 0.1 C.
Reg, R.G. Brown’s explanation of climate models is reprinted here:
https://rclutz.wordpress.com/2015/06/11/climate-models-explained/
He explained:
“Each model one at a time can have the confidence interval produced by the spread in long-run trajectories produced by the perturbation of its initial conditions compared to the actual trajectory of the climate and turned into a p-value. The p-value is a measure of the probability of the truth of the null hypothesis — “This climate model is a perfect model in that its bundle of trajectories is a representation of the actual distribution of future climates”. This permits the estimation of the probability of getting our particular real climate given this distribution, and if the probability is low, especially if it is very low, we under ordinary circumstances would reject the huge bundle of assumptions tied up in as “the hypothesis” represented by the model itself and call the model “failed”, back to the drawing board.”
“One cannot do anything with the super-average of 36 odd non-independent grand average per-model results. To even try to apply statistics to this shotgun blast of assumptions one has to use something called the Bonferroni correction, which basically makes the p-value for failure of individual models in the shotgun blast much, much larger (because they have 36 chances to get it right, which means that even if all 36 are wrong pure chance can — no, probably will — make a bad model come out within a p = 0.05 cutoff as long as the models aren’t too wrong yet.”
The first paragraph describes what INM is doing with a single model.
You have a point. Should we use of statistical methods when we handle a sample of man-made computer programs that depend on who are the men and how they programmed the models?
Because climate is a complex adaptive system its models are that too. They do not produce predictable outputs with even slightly varying inputs. Small change in the input parameters may result in very different results.
Consider a lottery machine. Physics is known but we can’t predict what balls will come out of it. After enough runs we can conjecture that we have only certain numbers in the machine (at least so far).
Of course we thrust that climate model runs are not cherry-picked for IPCC reports. Can I add some Russian models more to these reports.
I don’t think matching the HadCrut 4 is a very good result in terms of reality. 😉
It almost certainly says the model is not working well at all..
BTW, for those interested in the pre-industrial baseline, there is this graph:
https://www.eea.europa.eu/data-and-maps/indicators/global-and-european-temperature/global-and-european-temperature-assessment-8/image_xlarge
It shows what the Russians are showing. When you take 1850-1899 as “pre-industrial baseline”, the rise is about 0.8K.
Ron, the model overshoots the cool periods to clip the tops of the warm periods. Please note the 21st Century overshoot.
Dave, wait till you see the other ones.
And the IPCC AR6 will use them with no blushing.
Ron Clutz
That’s handy, because it makes it easy to answer Bob’s initial question “What was earth’s pre-industrial global mean surface temperature, in absolute terms not anomalies, supposed to be? At least according to HadCRUT4, which stars in 1850.
If the IPCC’s reference period for pre-industrial temperatures is 1850-1900, then you just need to calculate the average annual anomaly in HadCRUT4 for that period and add it to 13.97C. The HadCRUT4 anomaly average for 1850-1900 amounts to -0.30C; so the absolute ‘pre-industrial’ temperature was 13.67C, according to HadCRUT4.
The latest annual temperature anomaly in HadCRUT4 (2017) is 0.68C, which needs to be added to 13.97C (the 1961-1990 base), giving 14.65C in absolute values. According to HadCRUT4 then, global surface temperatures in 2017 were about 1.0C warmer than they were on average during the period 1850-1900. They’ll be a little lower this year; around 0.9C warmer.
If I recall correctly HADCRUT4 was a revision to ‘better’ take account of ship measurements of sea temperature made when the TEAM were beginning to get concerned about the pause.
The problem is that before 1920 there was all but no ship measurements of ocean data particularly in the SH. In fact Phil Jones in the Climategate emails was quite candid when he remarked that most of the data below the tropics and between the Antarctic is simply made up.
Given that it is crazy to consider that we have global data going back to 1950, and we ought to limit consideration solely to the Northern Hemisphere where there is better coverage.
If one is going to use a HADCRUT reconstruction, HADCRUT3 is likely to be better when considering the 19th century.
From your INMCM5 link (my caps):
“…When compared to the INMCM4 surface temperature climatology, the INMCM5 shows several improvements. Negative bias over continents is reduced mainly because of the increase in daily minimum temperature over land, which is achieved by TUNING the surface flux parameterization…”
How many times do people insist there’s no “tuning” of parameters in the climate models to the past? LOL.
“The 14.0 deg C factor used to be (past tense) listed at the bottom of the GISS LOTI data page and they were referenced to the period GISS uses for anomalies, 1951-1980. But the 14.0 deg C (57.2 deg F) factor is no longer listed on that GISS data page. “
That right there deserves a post of its own.
Hi Anthony.
What’s also curious is the Wayback Machine archive. The Wayback Machine won’t allow access to the archived GISS LOTI data in 2013, 2014 or 2015, but it will allow access to that data in 2017 and 2018. I had to retrieve a copy of the older data from ArchiveToday:
https://archive.is/7sTCC
BTW, you’ll love my next post on the two CMIP5 ensemble members used in this post, comparing them to the Berkeley Earth data on a monthly basis, in absolute form. What I found is remarkable. I couldn’t make it up.
Cheers,
Bob
I look forward to reading it.
Drive on, Bob Tisdale, drive on!
Thanks for all your fine work. I’m glad you’re back.
Err, lost me there, Bob. The variability of a model, the variability of the nature, and the model spread are all different animals, so I guess you should not add therefore there.
Your point shortly could be – the models don’t agree on T, and have a ±.5% spread, larger than the warming deemed dangerous by some.
Also, Bob isn’t comparing recent global surface temperatures with ‘pre-industrial natural variability’ here; he’s comparing them to model outputs that included the pre-industrial period. Hind-cast models, not global surface temperature records.
Bob:
I did some rough scaling on your figure 1. As far as I could disentangle the different models, the difference in global average temperature between 1880 and 2018 varied from +1.1° to +1.9°C, and seemed to gravitate towards an average of +1.5°C.
Does this mean we’re already at the dreaded 1.5° tipping point, the point of no return? Does this mean there’s no point in worrying about it or blogging about it any more? Does it mean that the end of life on earth is absolutely guaranteed to happen in the next decade or so?
Or perhaps not.
I have been working with Earth’s energy balance. In my presentations as well in other presentations, the LW radiation emitted by the Earth’s surface is about 396 W/m2. It means a black body temperature about 16.0 degrees. Temperature 14 C gives about 385 W/m2. There is a problem. Maybe I have been working too much on this issue but I believe that 16 C is close to the right value. So, I believe.
But you cannot assume anything about a black body, the Earth is far from that! Also there is a thermodynamic problem with the “black body” model, see http://vixra.org/pdf/1502.0007v2.pdf and a you tube video showing the experiment to prove it!
C an we get away from Models, what about the written records which go back some 300 0 years in say China. Water freezes and is observed. A long period of no rain is also recorded . Heat while not actually measured was noted and a estimate can be made from what written about it.
Church records exist in Europe prior to the MWP. Research can show a lot, far better than guesses via models.
MJE
Even though I wrote about models, the radiation value 396 W/m2 has been also confirmed with the direct global observations. If the value of 396 W/m2 is not correct, then the outgoing LW radiation value of 240 W/m2 is also difficult to explain.
Bob there certainly doesn’t seem to be any CAGW to be found in your post. But Bob what about the Vinther et al 2006 Greenland study ( note Jones and Briffa listed as co authors) using instrumental data from the late 18th century until the then present day.
Certainly doesn’t seem to be any CAGW there either if you look at their Table 8 of the study. Anyway what will happen when the AMO changes back to the cool phase or has that started in 2015 as some scientists have asked recently? Here’s the link. So Bob what do you make of this very long Greenland instrumental record and the decade by decade table 8? I can’t find any post 1950 warming that seems to point to any scary CAGW, but perhaps I’m missing something?
https://crudata.uea.ac.uk/cru/data/greenland/vintheretal2006.pdf
If everything’s made up of atoms in the periodic table.
https://www.youtube.com/watch?v=J2K3mAKr67U
and the electron Bohr model has been replaced by the electron cloud model. Then how big is the electron cloud that surrounds and formed Earth??? Electrons are what the space between atoms is (air), If you put electrons under pressure they will create heat “T” as they resist from being forced together.
https://www.youtube.com/watch?v=zYS9kdS56l8
https://www.youtube.com/watch?v=zYS9kdS56l8
I see the electrons as the ether, plasma or whatever you care to label the soup proton and neutrons (mas) float around in.
Only if you are prepared to compare apples with political history.
To be sure that no human caused global warming has been included one should go back 20k years to the coldest part of the last ice age which is definitely “pre industrial” . Of course 1.2 degrees C more than that value has been exceeded more than 15k years ago and yet the effect has been catastrophic. The previous ice age ended.
“To be clear, no particular absolute global temperature provides a risk to society, it is the change in temperature compared to what we’ve been used to that matters.”
Thats makes everthing ok then, because everone who was alive in 1900 is dead anyway
Global surface temperature 13.9 to 14°C as defined by IPCC NOAA NASA at pre-industrial level is meaningless.
Surface temperature changes with elevation above MSL and spatial location of latitude.
ICAO defined surface temperature for standard atmosphere at sea level as 15°C (59°F or 288.15K). Used in aviation universally.
This is what climate researchers should also use for surface temperature reference. But AGW Climate fanatics won’t use it because it will not show any warming and 1.5 degree increase will not ring doomsday bell for 2030 and beyond.
Again.
lobal surface temperature 13.9 to 14°C as defined by IPCC NOAA NASA at pre-industrial level is meaningless.
Surface temperature changes with elevation above MSL and spatial location of latitude.
ICAO defined surface temperature for standard atmosphere at sea level as 15°C (59°F or 288.15K). Used in aviation universally.
This is what climate researchers should also use for surface temperature reference. But AGW Climate fanatics won’t use it because it will not show any warming and 1.5 degree increase will not ring doomsday bell for 2030 and beyond.
Again.
Global surface temperature 13.9 to 14°C as defined by IPCC NOAA NASA at pre-industrial level is meaningless.
Surface temperature changes with elevation above MSL and spatial location of latitude.
ICAO defined surface temperature for standard atmosphere at sea level as 15°C (59°F or 288.15K). Used in aviation universally.
This is what climate researchers should also use for surface temperature reference. But AGW Climate fanatics won’t use it because it will not show any warming and 1.5 degree increase will not ring doomsday bell for 2030 and beyond.
Edited comment.
Global surface temperature 13.9 to 14°C as defined by IPCC NOAA NASA at pre-industrial level is meaningless.
Surface temperature changes with elevation above MSL and spatial location of latitude.
ICAO defined surface temperature for standard atmosphere at sea level as 15°C (59°F or 288.15K). Used in aviation universally.
This is what climate researchers should also use for surface temperature reference. But AGW Climate fanatics won’t use it because it will not show any warming and 1.5 degree increase will not ring doomsday bell for 2030 and beyond.
Bob Tisdale:
You wrote “If you look closely at Figure 3, you can see that the Berkeley Earth Data recently peaked in 2016 slightly above the highest of the simulated pre-industrial average temperatures,…with the 2014/2015/2016 El Nino-caused “record high” of 15.1 deg. C.”
The cause of the El Nino was an approximately 30 Megaton drop in anthropogenic SO2 aerosol emissions between 2014 and 2016, which partially cleansed the atmosphere, allowing sunshine to strike the Earth’s surface with greater intensity, causing increased surface warming.
The very strong 1997-1998 El Nino was due to a reported 7.7 Megaton decrease in SO2 aerosol emissions between 1997 and 1998, due to Clean Air efforts.
The temperatures shown in your Figures 2 and 3 are simply reflective of changing levels of SO2 aerosols in the atmosphere, of either volcanic or anthropogenic origin.
The gradual rise in average global temperatures since 1975 have been due to decreased levels of anthropogenic SO2 aerosol emissions in the atmosphere due to Clean Air efforts, from a peak of 131 Megatons in 1975, to 101 Megatons in 2014 (and to about 71 Megatons in 2016).
This on top of Earth’s natural recovery from the Little Ice Age cooling of ~.05 deg. C per decade, from 1900-present.
Bob, it is obvious that the control knob for Earth’s temperatures is simply the amount of SO2 aerosols in the atmosphere. Add them, and it cools down. Decrease them, and it warms up.
Your thoughts on on this?
I’ve also (recently) become curious about the effects of a reduced atmospheric aerosol load due to the clean air act and etc. The attribution question is still very much in doubt based on the two competing physical processes (i.e. radiative forced warming vs aerosol forced cooling). The aerosol factor is one of the tuning parameters in the models (as I understand it), and given the potential magnitude of the forcing, it seems like we might inadvertently be contributing to warming by cleaning up our atmosphere.
rip
ripshin:
Your statement that “we are inadvertently …contributing to warming by cleaning up our atmosphere” is absolutely correct.
In fact, it is not a “contribution to warming”, but the actual CAUSE of all of the anomalous warming that has occurred since 1975, apart from temporary effects due to volcanic activity.
Radiative-forced warming, if it exists, is so small that it is undetectable. On the other hand, the relationship between decreased SO2 aerosol levels and increased anomalous temperatures is ~.02 deg. C. of temp. rise for each net Megaton of decrease in global SO2 aerosol emissions. The same relationship exists for increased SO2 aerosol emissions, which causes cooling.
“Specifically, as a pre-qualifier, I used the outputs of the simulations of Surface Air Temperatures (TAS) from 90S-90N from the 81 individual ensemble members.”
First mistake.
Steven, I’m looking at this NOAA and NASA joint report for 2017:
https://www.google.ie/url?q=https://www.giss.nasa.gov/research/news/20180118/NOAA-NASA_Global_Analysis-2017.pdf&sa=U&ved=2ahUKEwjb-7mPg_feAhVN3KQKHT9mANQQFjAKegQIARAB&usg=AOvVaw0xln7gzRmIO9ZWkDAC-5tn
NASA states that:
“2017:
0.9°C / 1.6°F
above 1951-80
average”
But the average temperature isn’t supplied.
Therefore any claimed “departure” from it has no context and in isolation is akin to statistical noise.
NOAA provides the following similar statement in the same document:
0.84ºC / 1.51ºF above 1901-2000 average; 3rd warmest year of record
Again the average that is being referred to is not published, which renders contextualising any departure from it impossible.
It is clear that there is an unwillingness to publicly state what this average being written about is alleged to be.
At a time when we constantly hear appeals to urgently adopt measures (which themselves, according to the UNIPCC) will cause “unprecedented changes to all aspects of society” in order to attempt to limit warming to less than a rise of 2°C above an obviously constantly hidden figure, do you agree that it doesn’t serve policy makers or the electorate by having a situation where it appears that nobody can say what the target global temperature we either want to attain, or halt a 2°C departure from actually is, with any accuracy?
There needs to be a little more transparency in this science in order to make appeals to society to urgently adopt unprecedented and clearly unwanted changes and to get national agreements to implement the UN’s stated policy of “transforming the global economic model which has prevailed for the past 150 years”.
(In order to quickly achieve the goals stated above, democracy and sovereignty will clearly need to be transcended*, as the democratic mandate to do what is allegedly required to fix the problems being cited cannot currently be demonstrated in any democracy.
*Transcended by whom, or by what entity is the question.)
If it’s not your own area of interest, maybe someone else can share their thoughts?
Thanks, Dee.
“Preindustrial” is easily the most stupid word in the English language. Saying it is the same as saying “my IQ is the same as my shoe size”.
Have I missed something here? I have seen many quotes of a baseline temperature, but never noticed once where an error statement was included.
If the baseline is 15 +- 0.5 degrees, then does a 0.5 degree increase mean anything really?
I guess I’m just bugged that scientists everywhere just ignore measurement errors and act like they don’t exist. Maybe that’s ok for scientists, but for engineers that just won’t fly!
In all the models I ever used as an electrical engineer, you had to include component tolerances, voltage and current measurement errors, etc. Do climate models not include any error variances in their calculations or are all the inputs and algorithms so accurate that error statements are not needed.
Mr. Tisdale, THANK YOU KINDLY for touching on a topic from the category I call, A Question Any Sane and Earnest Child Would Ask.
“Daddy, if there was one temperature for the whole Earth, what was it a couple hundred years ago? And what is it today?”
“Son, when you become smart you will live in a world of anomalies and won’t ask such things. Only trends matter. Measurement is a cloud of probabilities like mosquitoes. Statistics is full of error and the statisticians who won’t say how much make the most money. But first we must examine your precepts in order to find bad assumptions in logic. WHY did you ask about specific, actual temperatures?”
“I thought it would just be fun, to know.”
“Daddy, why do the continents fit together like a puzzle?”
“When you become smart you will pretend not to notice things like this, and wait until a proven mechanism is found by someone else. But you’re in luck…”
“It’s okay. I’ll wait.”
“Dad, if there is no wristwatch inside the Sun, why do the sunspots go tick-tock every 11 years? It’s like Jupiter is jumping up and down saying, Look at me! Look at me!”
“Don’t look, son! It does not match exactly. For all we know right now, the sunspots could be chasing Jupiter round and round.”
“Everything goes round and round. Maybe the sunspots are throwing stuff out that changes things or makes them slippery… like someone throwing up on the dance floor.”
“Dad, if an asteroid killed all the dinosaurs and cooked the Earth, how come my teacher said we don’t have to worry because it does not happen very often?”
“Your teacher is a compulsive gambler and needs help. Thinking something will not happen tomorrow because it has not happened for a long time is the same as thinking you will win just because you think you should win. And we don’t want to think about losing. Losing everything. In fire. All dead! Except small rodents in holes! All that time building missiles for years and years but not ONE missile was built to send up to meet an asteroid. The more you think about it the more stupid it gets! Oh no… I’m thinking of it now, the idiocy, the waste! Of time! Time! How much time DO we have?? I want to figure it out but we cannot figure it out. I cannot figure. What could *I* have done? Whispered in someone’s ear… a speech, a book? Is it too late? What if… we pretend it’s not too late, and start preparing now? It wouldn’t hurt to be wrong, would it…?”
“It’s okay Dad… my teacher just lied. Besides, it would be cool to be a rat in a hole again.”
The word ‘anomaly’ is used frequently by CAGW enthusiasts as it immediately draws up bad and loathsome connotations. ‘Temperature Anomalies’ are a preferred CAGW phrase. Bob has drawn attention to the wide spread of the models of pre-industrial temperature range used for future anomaly forecasts. From the look of that, your guess as to the past and future temperatures on Earth would be as good as mine and their’s too.
Silber’s an idiot with no knowledge of natural variability and the miniscule contribution of increased CO2 to the warming of the Earth which is not a catastrophe in any event!