While claims of increased severe weather due to “climate change” aka “global warming” are thrown about by the media, with recent claims that more and more tornadoes are shifting east in the U.S., the fact of the matter is that the trend for strong tornadoes is decidedly down, according to data from NOAA. The US is on track to have the lowest annual tornado count in 65 years.

h/t to Mark J. Perry, AEI for the graph.
We recently covered the lack of tornadoes in 2018 from data supplied by the NOAA Storm Prediction Center, but the above graph clearly illustrates the downward trend. from 1954 to 1985, there was an average of 55.9 F3 strength or greater tornadoes in the USA per year, and in the period from 1985 to present, that number dwindled to 33.8 F3 strength of greater tornadoes per year. The year isn’t over yet, but now that we are out of the main period of tornado activity, it’s a likely bet that 2018 will come in the lowest ever.
For those not familiar, here is the original Fujita tornado strength scale, which is accepted as a world-wide metric by NOAA and the WMO:

Since “global warming” is said to be the cause of the perception of increased violent weather, taking a look at temperature for the USA during the same period should yield a correlation.
This comparison graph I prepared, showing USA temperatures from 1954 to 2018, illustrates the correlation between tornadoes and temperature is exactly opposite of what we are being told by climate advocates.
See below for this comparison graph I made, showing USA temperatures from 1954 to 2018, illustrates the correlation is exactly opposite of what we are being told by climate advocates. Again the source of the data is NOAA, using their “climate at a glance” plotter. I’ve shaded the 1954 to 1985 period of temperature to match the shaded 1954 to 1985 period in the tornado count graph,but otherwise both graphs are original:

Source of temperature plot (and data) is here.
Source of Tornado data is here
Breaking down the two periods, the NOAA “climate at a glance” plotter provides the 1954 to 1985 trend, when there were the most violent F3 or greater tornado counts in the USA:

Source of plot (and data) is here.
Shockingly, from 1954 to 1985, when violent F3 or greater tornadoes were most common in the U.S., there was a cooling trend of -0.13°F per decade.
But let’s look at the 1985 to 2017 (2018 is not complete yet) trend, when there were fewer violent F3 or greater tornadoes:

Source of plot (and data) is here.
In the 1985 to 2017 period, there was a warming trend of +0.48°F per decade.
Clearly, warmer climatic periods yield fewer violent F3 or greater tornadoes in the United States. And that blows a hole in any warming correlation that advocates like to claim for increasing numbers of severe tornadoes.
Oh, and remember the story about tornado paths shifting east?
This map illustrates that in the larger scheme of things, even if the claim holds true, most tornadoes in the USA are in the east anyway, and the difference really isn’t that significant when you look at where the majority of U.S. tornadoes occur:

Source: NASA Earth Observatory
Looks like a clear correlation. Global warming means less tornadoes.
🙂
Its not much evidence of anything though.
Cagw theory dictates that the warming of the polar regions would be amplified cf the rest of the globe. As tornadoes and the storms that they spring from are driven by the temperature difference between the poles and the tropics , it’s clear that their theory predicts a decrease in the strength and number of tornadoes. Warmists should be using the decrease as proof of their theory but of course they can’t generate much alarm, or funding, by saying things aren’t as bad as they thought.
Wow, over 260 “incredible” tornadoes : is that credible ? 😉
I pointed out the inverse relationship between HadCRUFT4 NH mean and EF3+ in 2013. I’m glad to see the idea is getting some traction.
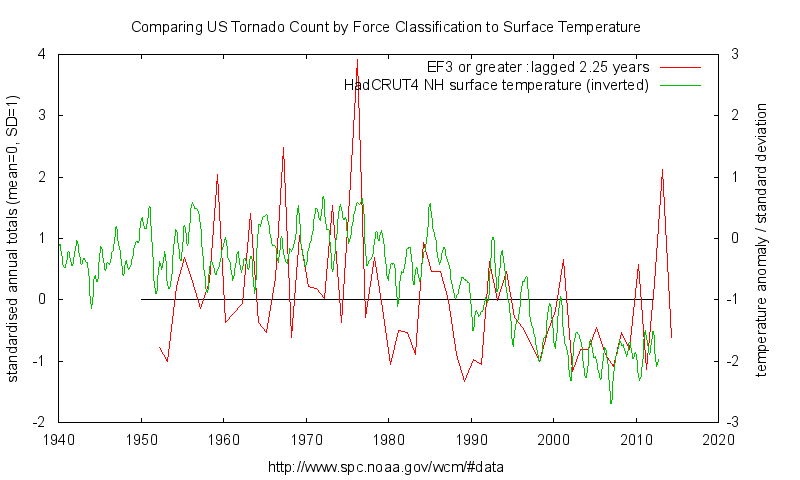
https://climategrog.wordpress.com/tornado_compare_ef234_hadcrut4_lag/
As ever, if you want to look for correlation you must have more than a trivial and meaningless up / down trend ( which ANY dataset has ) .
Plotting inverted surface temps against EF3+ tornado count shows more than a trend match.
260 is the wind speed at which tornadoes go from devastating to incredible.
If such storms are incredible , by definition, I don’t believe they exist ! 😉
Looking at EF3,4,and 5 categories separately shows that ALL major tornado counts had dropped markedly since 1975 when surface temps started the last warming phase.
Clearly warming climate is NOT conducive to major tornadoes.
Not only is there a statistical correlation, it makes meteorological sense. Global warming is supposed to reduce the temperature difference between the Equator and the poles. It is that temperature difference that drives mid-latitude severe weather. Reduce it and you should have less severe weather. Increase the temperatures difference and you would get more severe weather.
The claim by warmists that AGW would produce more severe weather was meteorologically inept! ‘Stupid’ might be a better word. ‘Bullsh!+’ might be the best way to describe it.
The benefits of a slightly warmer planet continue to mount up, while the so-called ‘crisis’ remains completely elusive.
” It is that temperature difference that drives mid-latitude severe weather.”
All types of weather? All mid-latitude locations? That is a simplistic statement, as inept and ignorant as those you wish to deride.
Actually all weather is driven by temperature differences. The atmosphere is a gigantic heat engine.
From Dr. Roy Spencer’s book, “An Inconvenient Deception”…
“Most storm activity, including strong surface winds, ultimately derives its energy from the temperature contrast between the tropics and higher latitudes.”
I would be hesitant to deride Dr. Spencer as simplistic, inept and ignorant.
Certainly such a broad statement cannot apply to every specific situation, but from a meteorlogical perspective, seems to be generally accepted.
Saying “ultimately derives” is not the same as inferring frequency or power of individual storms and how that varies over time, because what triggers a storm and maintains it depends on local variations of many factors, most of which we have a poor understanding of.
James Clarke’s claim that tropical-polar temp diff is the single predictor is just as ridiculous as the CAGW claim it is all about mean surface temp. He thus qualifies for his own “meteorologically inept! ‘Stupid’ might be a better word. ‘Bullsh!+’ epithet.
James Clarke: “ … Not only is there a statistical correlation, it makes meteorological sense. Global warming is supposed to reduce the temperature difference between the Equator and the poles. It is that temperature difference that drives mid-latitude severe weather. … “
—
Not happening in the Southern Hemisphere that’s for sure, Antarctica has not warmed at all. Yet we’re getting fewer and weaker cyclones, and it is warmer in the tropics.
Stephen Wilde made the point (several months back) via way of link to a diagram on his site that in short means the tropical band has widened, and this lifts (due convergence and convection) the trade-winds off the waters and coastlines a bit further to the south (for the southern hemisphere this is) than it used to when cooler. Among other things, it alters wind vectors with the slow tropical and mid-lat temp rise over time. Yet the southern latitudes are as cold or colder than ever.
Which explained reasonably well why northern Australia has warmed measurably more than Southern Australia has. Namely, the trade-winds stopped bringing cooler air as far north, as often.
So the temperature contrasts that used to occur in the mid-tropics band has ameliorated, humidity increased, some and winters got shorter, cyclones less.
How USA’s geography, topography and tornado activity is affected by such is the question I think, but in the North the pole does seem a little warmer too (more land mass to warm area).
There is another major difference between north and south high latitudes, the South is dominated by vast low-pressure systems, the North polar-latitudes not so much. There are many more high pressure systems there, than in the south polar-latitudes. In other words, the north and south are not directly comparable. And palaeoclimate record shows they respond independently–it’s situation normal to do so.
So such global generalizations are kind of out, they don’t fit the globe as a whole, and probably won’t.
like I said above, that was an inept and ignorant comment. Pot , pan , etc.
Bland statements with nothing but assertion to back it up.
Coming from someone who misread a simple graph a little earlier.
Pot, kettle, black
Note the smiley. It was a joke comment, get over it.
My statement is simplistic, but basically accurate. The statement that AGW would increase severe weather is also simplistic, but completely wrong.
My statement was a generalization, and not ment to encompass all weather changes everywhere. Still, the data supports my statement of a trend towards slightly more benign weather much more than the data supports the AGW meme of weather becoming hostile in a warning world. WouItld you not agree?
And note that inland Antarctica is actually cooled by increased CO2. And since this is a purely radiative effect it well-understood physically, in contrast to the highly hypothetical “water feedback”.
As Lindzen said, reduce the polar-equatorial temperature gradient and you get less violent weather. Looks like he was spot on.
I don’t think that is entirely true for hurricanes.
Comparing ACE to SST is the other way around to tornado count.

https://climategrog.wordpress.com/ace_amo_2015/
… except for when there is a warm ‘plateau’. We really need to stop pretending climate is a single variable function.
Fewer…
Sorry, old habit.
But the main problem I have with this article is that Anthony is obviously trying to make a scientific point using scientific facts when everyone knows that its all about Da Feelz. Geeze, facts won’t make it to the 6 o’clock news (for grandpa) or Facebook (for dad) or Instagram (for the kids).
That, and using a much longer time-frame with very dodgy data going backwards, and extrapolating that into a future of indeterminate length until you get one year with above average tornadoes so you can say “See!”…
It’s worse than we thought.
+0.97
It is even worse than that.
Several F0 and F1 tornadoes touched down in RI and MA last night. Unusual, especially in October.
Pop them on the map then if you can find space. Can’t be too careful with the data nowadays.
Unusual perhaps, but that describes many, many weather phenomena.
average weather conditions are also pretty unusual.
It is often said that GW means more and stronger hurricanes because a hotter sea surface means there is more energy available for these storms. Question: where do tornadoes get their energy from? Is a hotter surface temperature theoretically holding more energy for the tornadoes? If so, why are they reducing? If it can be an artifact of natural variability, why can’t the same be said with hurricanes?
I have always read it’s the temperature difference that creates tornadoes—fronts meeting and the cold air versus the hot air. Surface temperature wasn’t mentioned.
Yoiu have to have a lot of water vapor in the air to power a tornado, so one of the air masses got to be reasonably hot and moist. A cold airmass colliding with a very cold won’t work.
That is why the Midwest is pretty much the only area in the World where tornadoes are common. It is the only place in the World where you have an uninterrupted plain stretching from a tropical ocean to an arctic ocean, and consequently extreme temperature contrasts.
tty,
Any thoughts on why eastern Kentucky, western Virginia, and especially West Virginia seem to have few tornadoes?
Flatter terrain? Fewer really cold fronts? Fewer pop-up thunderstorms?
For one thing, the Appalachian region is more mountainous than the Great Plains and other parts of the Midwest and South.
Possibly (weasel word) the Rockies and the Appalachian Mountains directly funnel air in an unique manner that is conducive to the formation of tornadoes. I am unaware of any other geographical area worldwide where the incidence of tornado formation is as high.
https://www.livescience.com/25675-tornado-alley.html
That “hotter sea surface” claim is based upon anomaly variances from a calculated “average”.
Allowing alarmists and doomsters to obfuscate that “average” actually means “over a range of temperatures”, and our history of sea surface temperatures is spotty and definitively not comprehensive.
Actually, that warmer SST causes more violent hurricanes, is a myth, may even stem from a novel, Cat 5, about a major hurricane impacting the Palm Beach area back in the ’70s. It is when the SST is cooler that we get stronger hurricanes, the correlation is clear if you look back over past storms. The worst hurricanes occur when SST is cooler and storms tend not to form when SST is very hot. It seems counter-intuitive but it is what happens.
Your “counter-intuitive” statement would be well served by data of some sort.
If true, we could expect to see many hurricanes in the South Atlantic impacting the coast of Brazil, such as Hurricane Catarina.
You want data ?

https://climategrog.wordpress.com/ace_amo_2015/
That uses ERSST AMO and HadSST3 0-60N 0-70W so that does not necessarily contradict the point Pam made if she had some local data to back up her point.
The interesting thing in that graph is that, despite the general correlation to AMO and broad regional SST, the cyclone energy falls through the floor in 2005 : the hottest part of the record.
Right, so let’s see what Nick, Kirsti, Percy, et al have to say….
Or indeed, any other scientists. It’s a straw man. No-one is quoted saying that tornadoes are increasing, or expected to increase. All that is linked is an article saying that, while tornadoes don’t seem to have increased in the usual places, some are turning up further east than they used to. I don’t know whether that is true, but it is not refuted here.
Well here’s just one example.
https://thinkprogress.org/poisoned-weather-global-warming-helped-fuel-killer-tornadoes-e8bc609cf5b9/
But the bottom line Nick is that I still believe you are a paid commenter, and will come up with anything to dispute anything we say here. It’s been your M.O.
Anthony, I think that is a pretty silly and unfounded claim. It is valuable to have someone with high maths skills and a broad knowledge who has a GW bent, posting here. It prevents WUWT being a total echo chamber.
Nick is not a propagandist, he is simply participating in the debate everyone laments warmists not being prepared to have.
Saying he is a paid commentator is about as good as claiming your site is being funded by Big Oil.
Nick also faked the video of those rectangular icebergs.
I wish Nick would split his pay with me cause we say the same thing and I get paid nothing.
Here is a thought Greg, cause you seem like a guy who is devoted to data and independent analysis ands debates over numbers rather than kooky claims about secet pay. perhaps you can point out to Anthony that nobody ( that I can find) is publishing actual science papers claiming a Correlation between global warming and increased tornados.
Hurricanes? ya lots of papers. Tornados? Hmm I’m not seeing much in the literature,
and virtually nothing in the official summeries of the science.
From that article
“Because of that variability and imperfect historical records, scientists have not found a measurable trend in tornado intensity and number. “
The unnamed “scientists” ? Is that supposed to mean all scientists, or the “consensus” or just the hand picked ones we spoke to ?
The claims about “imperfect” is sand in the reader’s eye. If they have not found a trend it is because they are not looking properly or are determined not to find one. EF3 and greater are consistent historically and tell the same tale. Muddying the waters by failing to remove unreliable recording of minor events is simply not serious science.

” Is that supposed to mean all scientists…”
I didn’t choose the article. It was supposed to be an example of what this article is refuting. And that is what they said.
Do you think something is causing a trend toward fewer tornadoes?
Nick Stokes October 24, 2018 at 1:50 pm
If the cooler northern air which meets the warm, moist air from the Gulf is getting warmer, then, yes, there should indeed be fewer tornadoes.
Colder is stormier. Warmer is more clement. In general.
Nick , I was commenting on what you quoted. Since you did not actually make any point when quoting it, I have no idea what your take on that is. So I’m not arguing for or against you, but commenting on what you quoted.
“…Because of that variability and imperfect historical records, scientists have not found a measurable trend in tornado intensity and number…”
Yep, it’s not because there’s no trend, or possibly a negative trend…the signal just hasn’t been teased-out yet because of other factors.
Here is Nick’s blog:
https://moyhu.blogspot.com/
That I don’t see ads doesn’t mean he’s not paid somehow.
Or maybe it’s just because I use an ad blocker.
Frankly, for what it’s worth, I doubt Nick Stokes is a paid commenter.
He better fits the academic stereotype Steve McIntyre once described as along the lines of “I guess it’s one of the requirements of your job to always be right.”
Though I think he was addressing Oxford’s Myles “11 degrees” Allen, there is an awful lot of truth in the stereotype. Having the last word, and never accepting being wrong, is a mental affliction of some people, many of whom find employment in academia.
Once we get past the New Stokes Shift, however, the essential truth of the matter is that many public commentators, scientific or otherwise, believe and assert that violent weather is getting worse and/or more frequent, when there is actually no supporting evidence for the claim.
michael hart,
+1
Here is another.
https://iri.columbia.edu/news/tornado-outbreaks/
Bending over backward to find a way to spin storms as worse.
‘But the bottom line Nick is that I still believe you are a paid commenter, and will come up with anything to dispute anything we say here. It’s been your M.O.’
He certainly seems to only paint one side of the fence, doesn’t he?
I haven’t paid attention to Nick Stokes, so I won’t comment on his record.
What I will comment on is that being paid to comment, or whether someone is paid by big oil, doesn’t determine the truth or falsity of any argument. The same goes for comparison of current arguments versus past arguments. If they were wrong in the past, doesn’t mean they are wrong now or vis versa. That being the case, I wouldn’t bring it up.
If I were going to say something about being paid or about a track record, it would be that we might use that information to be more careful when examining their arguments. But then I’d have to wonder why we aren’t that careful in the first place. I wouldn’t accuse someone based on my own speculation and not having verified it.
Joel Snider said:
“He certainly seems to only paint one side of the fence, doesn’t he?”
Right, and by that logic someone must be paying Anthony to do what he does…..
Seems like pretty dumb logic to me.
Jeffrey J Mitchell
Well, as is to be expected in the Blue Soap Operas, when sifting through the forensic evidence, the question is usually asked, “Did the person have “motive and opportunity?” Being paid is certainly motive, but isn’t sufficient to convict. Therefore, if someone is being paid by someone with a vested interest, it does raise a flag to suggest heightened scrutiny of the claim(s). But, it doesn’t automatically discredit a claim. However, some, because of their track record, do become suspect routinely.
Anthony,
I have no hesitation in stating that I am unpaid to make blog comments here.
I do not know about Nick Stokes finances, nor should I.
If Nick wants to state he is not paid for comment, he is free to do so.
Geoff
Geoff
” he is free to do so”
I do from time to time, eg here. I have been commenting at WUWT now for about 10 years – that would take a very steady paymaster.
Someone noted my blog, but didn’t ask the obvious question – who on earth would pay for all that?
one reason you wont find scientists talking about a link is that tornados, unlike hurricanes, are sub grid phenomena.
The headline writer talked about correlation
Well lets use Willi’s RULE
Quote someone words. More importantly
QUOTE THE SCIENCE.. not comments to the press, or blog shit
The scientific comunity does summaries and assesments of the state of the science to
let you all know the points of agrement. QUOTE that.
or youre hunting strawmen.
So according to your logic, if the science is right, and scientist are right, that would leave the left to be in the right? And the Right to be wrong?
Hi Andrew, Can you update the
“Source of Tornado data is here” link? It appears to link to data unrelated to your graphs… I was hoping to read the Source data.
Thanks!
It’s there
It’s pretty hard to maintain that warming will lead to more tornadoes when the statistics keep piling-up saying the opposite is true…so now it’s about global warming increasing “clusters” and “outbreaks.”
But give us a break, Nick. There has always been an insinuation that violent tornadoes were part of global warming/climate change. Even when scientists couldn’t find a trend or link, it was suggested there COULD be a link, but the historical data had too many holes and too much noise to extract it yet.
But here are a few gems…
Kevin Trenberth, 2009 Congressional testimony:
“…The record breaking numbers of tornadoes and deaths in the U.S. in 2008 probably also has a modest global warming component…”
The ridiculous Peter Gleick:
“…Violent tornadoes throughout the southeastern U.S. must be a front-page reminder that no matter how successful climate deniers are in confusing the public or delaying action on climate change in Congress or globally, the science is clear: Our climate is worsening.
More extreme and violent climate is a direct consequence of human-caused climate change (whether or not we can determine if these particular tornado outbreaks were caused or worsened by climate change)…
…The extreme nature of the ongoing severe weather is well described by Jeff Masters on his Weather Blog. The 3-day total of preliminary tornado reports from this week’s outbreak is nearing 300, close to the 323 preliminary tornado reports logged during the massive April 14 – 16 tornado outbreak. That outbreak has 155 confirmed tornadoes so far, making it the largest April tornado outbreak on record.
Of course, tornado outbreaks have occurred before. In 1974 and 1965, collections of tornados killed hundreds of people. But according to NOAA’s Storm Prediction Center, it is unprecedented to have two such massive tornado outbreaks occur so close together. Loading the dice…”
https://www.researchitaly.it/en/news/more-tornadoes-in-the-mediterranean-sea-due-to-global-warming/
http://www.climatecentral.org/news/tornado-outbreaks-becoming-more-extreme-20926
There’s 2 links for you Nick
When the planet warms, it does so more in the arctic than at the equator. link That means less atmospheric transfer of heat to the arctic. Since a heat engine works on temperature difference and flow of heat, that means there is less energy available to cause violent weather.
In light of the above, it is unsurprising that there is less violent weather.
Higher temperatures will cause more local convection as air rises, loses its heat to outer space and returns to the surface. For some reason, such local convection doesn’t seem to cause violent weather other than mid day thunderstorms.
It occurs to me that enhanced local convection at mid latitudes should weaken the Hadley cell and the other more northern cells. That makes sense because the lateral transfer of heat should decrease due to higher arctic temperatures.
What am I missing?
You’re missing the alarmist default position that global warming is the cause of everything bad: from violent storms to my athletes foot.
TMI
Tornadoes are spawned at the edge of Rossby waves, meanders in the jet stream.
Orthodox climate science used to be (until it became subservient to the needs of CAGW) that a cooling trend would lead to more extreme weather. Lamb, Wallen That means that a warming trend would lead to less extreme weather.
“What am I missing?”
“That means less atmospheric transfer of heat to the arctic.”
No, it means more transfer. A warmer Arctic radiates more, and it doesn’t get more sunlight.
That’s making a whole pile of assumptions.
The simplest case is:
where:
link
Thermodynamics, especially when a compressible fluid (ie the atmosphere) is involved and especially when a condensing gas (ie water) is involved, is a bear. That said, it’s really hard to get around the basic heat flow equation.
The thing you have to grapple with is why the arctic temperature rises much more than the temperature at the equator.
“That said, it’s really hard to get around the basic heat flow equation”
Yes. And in yours, ΔT between Arctic and space is increasing, and so is Q. It has to come from somewhere.
A thin layer of clouds would solve the problem nicely. Like I said, you’re making assumptions you don’t even know you’re making.
Again, the question is why the arctic temperature increases more than the tropical temperature.
Also remember that we’re discussing atmospheric heat transport. If enough arctic ice melts the ocean heat transport should increase.
So, there could be greater thermal impedance between the surface and outer space, or the atmosphere could be short circuited by the ocean. A decrease in delta T between the equator and the north pole should mean less atmospheric heat transport. That seems to be borne out by the decrease in extreme weather events.
The other thing to remember is that, although solar warming of the arctic surface is greatly reduced by geometry, direct atmospheric heating is not so affected. Even if the sun’s rays are parallel to the ground and there is no solar warming of the surface, direct atmospheric heating still occurs and can’t be ignored.
That proportion would be greater in the arctic.
It’s complicated and not well understood. Anyway, it’s not a given that there’s greater Q due to atmospheric transport.
There is sometimes, but not now, a slide set for the Arctic Energy Budget (Colorado geog_5241 course) on the university’s web site. It’s wonderful and I wonder if the professor would allow WUWT to post the slides. Anyway, the take away is that the arctic heat budget doesn’t come close to balancing. I’m not going to pretend that I know why. It is complicated. That said, you’re probably wrong. You have the problem of explaining how a reduced thermal gradient will result in greater heat flow.
If you are going to treat the Arctic and the tropics as two uniform bodies defined only by their temperatures, you will have a lot of difficulty explaining anything which is happening in the real climate system.
Over simplification to that degree does not prove someone is “probably wrong” , it shows you are probably wrong.
Anthony, you naughty boy. You’ve been using real data again. You know how much real-life upsets the alarmists!
Better give them a GCM to cuddle in their safe space.
(I was going to say, “give them a model to cuddle”, but then I had the stomach-churning image of Bill Mckibben cuddling Kate Moss)
GCM wont help. One reason its hard to do attribution.
tornados are subgrid, DUH
Mosher, it was a joke.
Looks like you took the bait, DUH
I’m not too confident in correlating tornadoes (and hurricanes) with much of anything. They’re both very noisy signals, with seemingly unpredictable spikes and lulls. Not surprising with a chaotically-coupled system like Earth’s climate.
+1
Yep. My thoughts exactly
Part of the discussion, Eustace, is that if the tornadoes were increasing the Warmists would be all over it – “See, We told you” but since they aren’t increasing all we get is silence from them. They are quick to defend any so-called “trend” that supports their position and just as quick to dismiss as meaningless any that imply they could be wrong.
It is more than appropriate in the current “climate change” environment to point out what appears to be happening with tornadoes in the US and implying that if there is any possible correlation, it is a favorable one.
I understand what you’re saying, but “implying” a correlation- in either direction- for political reasons is not science.
Climate science is more politics than science.
Eustace Cranch,
There is an obvious pattern to where they occur in the US. Are you suggesting that it is just coincidence and that the weather/climate is unrelated?
Good grief, everybody! I was just expressing my personal opinion that I see no slam-dunk correlation of tornadoes/hurricanes and global temperature, either positive or negative.
Real science has to be resolutely objective, no matter where it leads.
“The first principle is you must not fool yourself, and you are the easiest person to fool.”
-Richard Feynman
Since climate is always changing (this is an axiom) and it can’t change in the same direction all of the time, one would expect that hurricanes and tornados will be back, but when? This is the kind of information that would be really useful, but all we have is bad climate models.
Isn’t the Russian model performing much better than all of the other models?
And on another thought does not the historical records indicate that there are more frequent and more severe storms at cooler temperatures? Or is it that the records are mainly from the NH and not necessarily for the earth in general.
It’s true the over a short time period, it’s just random noise, but I’ll bet that had the correlation been in the opposite direction, it would have been offered as proof of the damaging effects of global warming in all the uncritical media.
Just how many adverse weather events have the alarmists claimed as evidence of global warming? It would seem that given so many global warming indicators that at any given time there should be several going in either direction. In the end, those that claim everything is the result of global warming can prove nothing.
The alarmists are excellent in this kind of hogwash and eyewash. The true believers don’t prove anything. They firmly believe. In models and hockey-sticks.
Surely SOMETHING must be getting bigger?
Even if it’s the speed at which weather is calming?
ONCE we have a figure that is bigger than last year – THAT proves Global Warming! It’s scientific! You have no expertise to question me….
But then there is this:
https://www.usatoday.com/story/news/nation/2018/10/23/hurricane-season-most-active-record-atlantic-pacific-combined/1741226002/
On the other but, then there’s this…
432-311=121
https://www.wunderground.com/hurricane/accumulated_cyclone_energy.asp
No trend in ACE overlaid on a weak trend in SST –> ???
What’s the R2 if you crossplot ACE with SST?
David,
I gotta admit that those are pretty (un)impressive R^2 values! The ACE/NH SST relationship explains less than 1% of the variance in ACE. That dog doesn’t hunt! Even at 30%, it suggests a spurious correlation.
AMO vs SST might be telling us that 30% of the SST warming is due to the AMO.
David, thanks for making that graph visible with your god-like WUWT powers. It’s annoying and unhelpful that we mere mortals can not long display a graph.
However, your crossplots are using the entire NH SST , are you surprised you don’t a tight match to N. Atl ACE?
Also your R2 is for the relevance of a straight line fitted to the scatter plot. Also even fitting an OLS fit to noisy X data is not legit to start with. It should be pretty clear that there is a connection between AMO and ACE at the interdecadal scale. There is also the sizeable question of why ACE drops right down after 2005 when SST is at its “hottest evah” levels. This also seems to have happened in WWII ( data collection issues notwithstanding ).
I discuss all this in the accompanying article for those who care read before commenting.
I provide another graph with some lowpass filtering which makes the comparison clearer:

(maybe you could make that visible too, please.)
https://climategrog.wordpress.com/ace_amo_2015/
If you are interested in the cross-correlation you will find a power spectrum of that too.
It shows peaks at circa 60 and 9 years. The peak is actually at 9.07y which is exactly the mean frequency corresponding to 8.85y and 9.3y, both of which are lunar cycles.
Being a guest author, I just have editing powers… a bit shy of God-like.
That was the best I could do in a few spare minutes.
I have downloaded a N. Atlantic time series for the average temperature from 0-100 m. I haven’t had a chance to play with it though.
I’ll definitely check out your work
Your second plot shows that there is no correlation with solar activity.
No it won’t since in AMO is by definition detrended ! It may tell you something about about the shorter term VARIABILITY , but not the “warming” which has been removed.
You really should read the article before trying to poke about on WTF.org. Look at the data I used rather than trying to refute using something else which is not the same.
I would agree. I have been saying for years the much of what is attributed to solar is lunar driven. That is why it appears to work when the two are in phase and then we have to close our eyes when it goes out of phase and doesn’t work for a couple of decades.
I suspect there may be combination of both but that lack of recognition of the presence of lunar effects is preventing the detection of any solar.
When I posted that article on Climate Etc. added a postscript showing how the lunar and solar periods may be combined to produce circa 60y periodicity.
https://judithcurry.com/2016/01/11/ace-in-the-hole/
p1=9.1;p2=10.8;
cos(2*pi*x/p1)+cos(2*pi*x/p2)
There’s definitely a ~60-yr periodicity (or at least quasi-periodic fluctuation). What is the mechanism by which lunar cycles might affect ACE, AMO and/or SST’s?
I just needed to read a bit more…
Very interesting hypothesis and definitely worth following it up. I wonder if it could also be applied to lower frequency quasi-periodic fluctuations.
Thanks, I’d be interested to see a thoughtful critique.
I thought the experts in Hurricane field were all predicting a below average season in the Atlantic. I guess you would have to agree that their models ain’t worth spit.
Hurricane formation is far more subtle that just looking at SST. It is an emergent phenomenon, involving positive feedbacks. That makes storm development an unstable situation and very hard to predict.
Yeah, everybody should learn to take reports like this with a grain of salt. From what I can tell, hurricane wind speeds these days (especially for storms that never make landfall) seemed to be more “modeled” than anything, or are at least deduced via satellite, from movement of the cloud tops where winds will generally be higher than at ground level. And since satellite coverage today is generally much better than it was in the past, any such measurements from the past may not have captured everything that is being captured today.
During Michael we were told that winds speeds maxed out at 155 MPH. Meanwhile, as the storm was coming ashore (if you were watching for such things, as I and others here did) the actual wind speeds being continuously recorded were more in the Category 1 to Category 2 range. (Gusts could run much higher, of course, and any spawned tornadoes brought with them their own additional winds.) But from what I’ve seen actual measured wind speeds (both from hurricane flights and on the ground) were more in the 130 MPH range.
I need to follow up on this, I guess (I didn’t save the link), but shortly after Michael rolled ashore I saw a report saying that the 155 MPH wind speed was in fact just “modeled” based on barometric pressures (dunno if these were actual measurements or were “modeled” themselves), and that these models were obviously running high compared to actual measured wind speeds. But, of course, 155 MPH is all we’ve been hearing, even if that isn’t correct.
Scross, doesn’t that have something to do with at what altitude they measure wind speed? Isn’t it supposed to be measured at 2 meters above the ground because that is closer to where it does the most damage? If they are measuring it a few KM above the ground it would make a big difference.
You are correct. Hurricane hunter planes use drop buoys while satellites are reading eye-wall wind speeds at the top of the storm. On the ground it can be a very different story.
Well, as it was near to coming onshore the buoys which were measuring its wind speed (and which are of course at or just above sea level) were all in the Cat 1 and Cat 2 range, IIRC. Last I checked the highest aircraft measurement was 133 MPH, and the highest ground measurement (gust?) was 130 MPH. But ground measurements are a little tricky because (a) they might actually be more spawned tornado measurements than actual hurricane measurements; and (b) they may just be the highest measurements that could be made before the instruments themselves blew away.
Go to the following post and read it, especially the tweets and the captions to the graphics. Down in the “UPDATES:” section it starts off talking about “satellite algorithms”, while actual measurements showed lower winds than that. The last chart shows the “CURRENT WINDS” just after it came ashore, and those surprisingly low numbers are in line with (maybe even a bit lower than) what I saw coming from the buoys in the 24 hours before it made landfall, IIRC.
https://wattsupwiththat.com/2018/10/10/nasa-hurricane-michael-intensifying-now-150-mph-winds-nearly-cat5/
10 Meters elevation is where windspeed is to be measured for Hurricanes.
Greetings, Doc.
Well, I guess we wait and see whether it’s a blip or a jump. Then we know.
Same for solar. We see to be in a dip, we are finally more or less equipped to observe what we need (you’d be the expert on that), so we sit back and enjoy the show and learn what we can from what the data shows us. What will it show us? Well, it’s a fun game, but quien sabe?
The tornado tracks plot reminds me of Joy’s Law, except the latitude angle is inverted.
Now if we can only figure out why the US and Canada have by far the most tornadoes.
Reminds me of a joke.
Why does California have the most lawyers and New Jersey have the most toxic waste sites?
New Jersey got to choose first.
+20
+42
That is well known. It is because the Midwest is the only place in the World where you have an uninterrupted plain stretching from a tropical ocean to an arctic ocean, and consequently extreme temperature contrasts.
Midwest thunderstorms are probably the most violent anywhere. I’ve never seen a tropical thunderstorm nearly as strong as some I’ve seen in Kansas.
I am not a climate expert, but tornado activity, to the best of my knowledge, comes from extremes in local weather, usually a clash of cold air with warm. So why would anyone expect that average temps have anything to do with tornado activity. There should be a look at the frequency of extremes in temperature in local areas to see if there is a match with frequency of tornado activity.
the last twenty years weather/climate in the uk have been the most benign in my living memory and that of my father. if that along with the general greening of the planet is the result of all the anthropogenic co2 in the atmosphere i don’t think there is much to be concerned with.
time for the “end is nigh” brigade to come up with something else to worry about.
Best science says:
https://science2017.globalchange.gov/chapter/9/
Tornado and severe thunderstorm events cause significant loss of life and property: more than one-third of the $1 billion weather disasters in the United States during the past 25 years were due to such events, and, relative to other extreme weather, the damages from convective weather hazards have undergone the largest increase since 1980. A particular challenge in quantifying the existence and intensity of these events arises from the data source: rather than measurements, the occurrence of tornadoes and severe thunderstorms is determined by visual sightings by eyewitnesses (such as “storm spotters” and law enforcement officials) or post-storm damage assessments. The reporting has been susceptible to changes in population density, modifications to reporting procedures and training, the introduction of video and social media, and so on. These have led to systematic, non-meteorological biases in the long-term data record.
Nonetheless, judicious use of the report database has revealed important information about tornado trends. Since the 1970s, the United States has experienced a decrease in the number of days per year on which tornadoes occur, but an increase in the number of tornadoes that form on such days. One important implication is that the frequency of days with large numbers of tornadoes—tornado outbreaks—appears to be increasing (Figure 9.3). The extent of the season over which such tornado activity occurs is increasing as well: although tornadoes in the United States are observed in all months of the year, an earlier calendar-day start to the season of high activity is emerging. In general, there is more interannual variability, or volatility, in tornado occurrence (see also Elsner et al. 2015 ).
Tornados down, days with more than 30 per day is up.
I see no claims about a correlation . did the guy who wrote the title of this post have a place where such a correlation is cited?
I mean a science source,
Let me clue you in. If you read it in the MSM , suspend judgement
If you read it in a single paper or two or three, suspend judgement.
When you see it written in a comprehensive summrty of all the science, then you can start to think that
the science says there is a correlation
Basically the title attacks a straw man. The science doesnt argue there is a correlation
Here
https://journals.ametsoc.org/doi/pdf/10.1175/BAMS-D-11-00262.1
See figure 8
Steven M,
As I click through the link you reference, I see statements like these:
“Tornado activity in the United States has become more variable, particularly over the 2000s, with a decrease in the number of days per year with tornadoes and an increase in the number of tornadoes on these days (MEDIUM CONFIDENCE). Confidence in past trends for hail and severe thunderstorm winds, however, is LOW. CLIMATE MODELS consistently project environmental changes that would putatively support an increase in the frequency and intensity of severe thunderstorms (a category that combines tornadoes, hail, and winds), especially over regions that are currently prone to these hazards, but CONFIDENCE in the details of this projected increase is LOW.”
Note my capitalizing to show emphasis on how uncertain and model-dependent alarming statements rest.
“It is not known at this time whether the variability and trends are necessarily due to climate change. “
And, Steve, using the words you quoted:
“A particular challenge in quantifying the existence and intensity of these events arises from the data source: rather than measurements, the occurrence of tornadoes and severe thunderstorms is determined by visual sightings by eyewitnesses (such as “storm spotters” and law enforcement officials) or post-storm damage assessments. The reporting has been susceptible to changes in population density, modifications to reporting procedures and training, the introduction of video and social media, and so on. These have led to systematic, non-meteorological biases in the long-term data record.”
… I seem to be seeing a great dependence on population increase, property increase, and changes in reporting procedures. In other words, more people and more property seem to imply more people reporting and more property being damaged. So, I think that this strongly suggests, NOT an upward trend in tornadoes, but an upward trend in population and property, within an actual lower trend in the occurrence of tornadoes.
“more people reporting and more property being damaged”
Yep. That’s why one should very, very carefully look over any stats coming from insurance companies, re: climate change.
People have more stuff, and its more expensive. If my parent’s basement is ever flooded, my dad would lose some tools, but mostly third-hand furniture, three old TVs, an 8 track stereo (and my dad’s box of 8 tracks), and that’s about it.
If my basement flooded, I’d also lose some tools, but a high-end wide-screen TV, 7.1 surround sound stereo, three computers, 2 tablets, etc.
Question: WHERE do they claim a CORRELATION between global warming and tornados?
Anwser: NO WHERE.
Their argument: the data series is not homogenous and not clear enough to say anything
with HIGH confidence about TRENDS or CAUSES.
Then why don’t you state that up front, instead of speaking in tongue?
“…the data series is not homogenous and not clear enough to say anything
with HIGH confidence about TRENDS or CAUSES.”
Would that be a blanket statement about climate data in general or just about US tornado activity?
Ah yes, the old hunt till you find a statistic that supports what I’m trying to prove.
Increasing damage has more to do with the increasing number of people living in areas prone to tornadoes and increases in the value of property in those areas as well.
Since the actual number of tornadoes doesn’t fit the narrative, find something that does.
Mosher,
The ‘sciency’ Reader’s Digest version of your linked article (from the first page):
“The observed changes in losses represent a combination of the effects of both physical climate and socioeconomic variability (e.g., Pielke et al. 2008), and it is difficult to attribute any of these changes to climate (Bouwer 2011).”
Steven,
:Climate scientists” do indeed state that “climate change will increase the intensity and frequency of all storms and extreme weather events”.
https://www.climate-change-guide.com/tornadoes.html
Just as with dangerous global warming, they’re obviously wrong.
John, that’s not a climate scientist you’re linking to there. That is an activist with no scientific credentials.
But that counts as an expert here Barry.
Don’t ya know?
Whatever you meant by that, it was lost in the sarcasm.
barry,
Banton is speaking for himself.
Tom Karl
‘Figure 8 summarizes our scientific assessment of
the current ability to detect multidecadal changes
and to understand the causes of any changes, putting
each phenomenon into one of three categories of
knowledge from less to more. The position of each
storm type was determined through extensive verbal
discussion at a meeting of the author team to reach a
group consensus. In terms of detection, the existing
data for thunderstorm phenomena (hail, tornadoes,
thunderstorm winds) are not considered adequate to
detect trends with confidence. This is also the case
with ice storms. The data adequacy for hurricanes and
snowstorms was judged to be of intermediate quality;
although trends have been studied, there are a number
of quality issues that add uncertainty to the results of
such studies. The data adequacy for precipitation is
of higher quality than the rest of the types, leading
to higher confidence in the results of trend studies.
Knowledge of the potential physical causes of trends
is higher for extreme precipitation than for other storm
types, while knowledge of causes for hailstorms, tornadoes,
hurricanes, and snowstorms is intermediate
among the types. The adequacy of knowledge is quite
low for thunderstorm winds and ice storms.
The status of the data and understanding can be
advanced through the following steps:
Severe convective storms—Consistent collection
of severe thunderstorm and tornado reports that
do not depend on the severe weather warning
process would be necessary to make the time
series of reports useful for climate-scale purposes.
Alternatively, development of objective remotely
sensed observations, most likely based on radar,
that serve as proxies for actual severe weather
events could address issues, although challenges
will exist as radar technology changes.
#############################
Short version: climate scietists say the tornado data is not up to snuff to make any firm statments about trends or attribution.
“climate scietists say the tornado data is not up to snuff to make any firm statments about trends or attribution.”
And they highly adjusted and corrupted temperature data is? Tornadoes are much easier to count than a global average temperature is to calculate. Cognitive dissonance at it’s best.
Also, you say “climate scientists” (or you tried to at least) as if they are one single minded collective borg. You cannot even allow yourself to acknowledge that some people who go by the psuedo-intellectual moniker of “climate scientist” might actually disagree on anything against the orthodoxy. Or by “climate scientists”, do you mean a group of 2 or more?
Mosher,
I would agree that “tornado data is not up to snuff to make any firm statments about … attribution.” However, with increased attention paid to tornadoes because of insurance losses, and speculation by alarmists that extreme weather will be a consequence of global warming, the addition of GOES weather satellites in recent years, satellite observations in general since 1972 detailing paths of destruction, and Doppler radar, I think that it would be surprising if one did not document an increase in tornado activity. The harder one looks, the more likely they are to find what they are looking for! Indeed, the above reasons probably explain why there is an apparent increase in F0 tornadoes, while the more destructive ones seem flat to declining (as per your linked article).
That is a convenient conclusion to dismiss inconvenient data. As always anything which does not fit the models must be either invalid or needs “correction”.
It is the <EF3 data which has been inconsistently recorded due to technical improvements , etc. No one misses and EF3. EF3,EF4 and EF5 data are consistent.
https://climategrog.wordpress.com/tornado_compare_ef234-2/
So the science saya the data is not certain enough to do attribution and you think the science is settled? neat trick for a skeptic
“the science says” is neat trick for language specialist. Where is this unique object “the science”?
As a skeptic, when I saw that claim years ago about the data being unreliable, I read up about how it was deemed to be unreliable, went and got the data and analyzed it , and using scientific methods found that the inconsistencies were in the small event counting.
I then plotted the data to show that EF3, EF4 and EF5 data were consistent, plotted graphs and wrote a brief article explaining that. You cannot explain a drop in recent tornado count by handwaving claims about historic under-counting. That goes the wrong way. Like I said, it is a convenient argument to dismiss inconvenient data.
You apparently prefer to dismiss that with a brainless appeal to authority called “the science” without even being bothered to click on the links provided.
Sadly typical of your shallow, dismissive attitudes here.
Mosher –> Having lived in the midwest all my life I’ve seen a lot of tornadoes. I’ve seen several that came down within several hundred feet of the ground and go back up. I’ve seen two on the ground, and they were big. One went through farm fields with no major property damage and the other thru Topeka, Ks. with a lot of property damage. I’ve also seen what gust fronts can do and in some cases the damage is certainly as severe.
Over the last few years do you know how many times I’ve sat and watched tv where the weatherman says, “there is a hook on the radar, that means there is a tornado, take cover now”? The point is you never know if the ‘rotation’ on radar ever drops down, if it hit the ground, how fast were the winds, and how much damage does it do? Actual people watching and/or investigating is the only way to discover some of these things. It just isn’t possible to do remote sensing and get accurate information.
I am also sure that out here on the Great Plains that there are tornadoes that happen and no one ever sees them or know that they happened. One, because of a lack of population, i.e. big open spaces, and two, lots of times tornadoes are covered up by rain, hail, clouds, etc. for people on the ground.
“climate scietists say the tornado data is not up to snuff”
Climate scientists says.. ROFLMAO.
Why don’t they say the surface data is a load of JUNK, and totally unfit for any scientific purpose whatsoever.
Its FAR worse than the hurricane data.
They don’t get to pick and choose, . !!
Seems logical to me. There’s a more or less ubiquitous mild warming that is taking a little of the clash out of what makes tornadoes, which are created when two “unalikes” collide.
Since when did warmists need evidence? They have models!
There may be fewer tornadoes, but the number of fossil fueled tornadoes is at a record high. The first ever fossil fueled tornado was in 2015, now every tornado is fossil fueled.
https://wattsupwiththat.com/2015/04/13/climate-craziness-of-the-week-fossil-fueled-tornado/
Here’s a fossil fueled Tornado…
https://www.worldoil.com/news/2016/11/21/talos-energy-brings-tornado-discovery-online
Here’s the only fossil-fueled tornado I know of:
Children just aren’t going to know what tornadoes are. 😢
Oh no! By 2075 children will not know what tornadoes are.
Ha, got there first, by 3 minutes!
Excerpted from above published commentary, to wit:
Now I was thinking, …… that if one was going to correlate US near-surface Average Temperatures with US tornado activity, as defined or denoted on the following two (2) graphs and one (1) map that are displayed in the above published commentary, to wit:
“Contiguous U.S., Average Temperatures, January-December
Strong to Violent Tornadoes (F3+) in the US, 1854 to 2018
The Tornado Tracks map, from 1950 through 2006.”
That given the fact that on the above noted “Tracks” map, the majority of tornadoes plague the central section of the US (between central Texas-North Dakota …. and the Florida panhandle-eastern Michigan), …. then would it not be logical and prudent to only consider the near-surface Average Temperatures within the “longitude” boundary as defined above ….. and/or on/by the Tornado Tracks map?
There is really no reason for including near-surface air temperatures for areas west of 104 degrees longitude, …….. is there?
Kansas is in the heart of Tornado Alley
It was struck by an average of 92.4 tornadoes a year between the years 1991 and 2015 (wikipedia).
Since it is obvious that there is no correlation between rise in the US temperatures and fall in the tornadoes count, what could be the cause?
All across central and the western USA there is rapid decline of the Earth’s Magnetic Field Intensity which has reached an alarming rate amounting to some 9% since 1955 in the area of Central Kansas.
According to data available from NOAA there is an apparent association of the fall of the tornadoes count and the fall in the Earth’s Magnetic Field Intensity in the general area of the central USA as demonstrated by this graph:
http://www.vukcevic.co.uk/Tornado.htm
“decline of the Earth’s Magnetic Field Intensity has reached alarming rate amounting to some 9% since 1955 in the Area of Central Kansas”
Here are trends in the decline of MF in central USA since 1800
http://www.vukcevic.co.uk/USA-MF.gif
At the current rate the field will loose 50% of its strength in about 160 years time, equalling current strength in the central area of the South Atlantic Magnetic Anomaly.