By Jim Steele
Director emeritus Sierra Nevada Field Campus, San Francisco State University and author of Landscapes & Cycles: An Environmentalist’s Journey to Climate Skepticism
Pacifica California, just south of San Francisco, is my adopted hometown of 25 years. It has garnered national attention as an icon of dangerous sea level rise as eroding cliffs dangled homes over ocean bluffs (discussed in a WUWT post a few years ago). To the delight of property owners and the dismay of environmental extremists, I became a member of Pacifica’s Community Working Group on Sea Level Rise. Governor Jerry Brown’s California Coastal Commission has advised coastal cities to consider that by the year 2100 we should expect a range of sea level rise from 3 to 10 feet due to climate change. Based on such predictions the city will map flood zones, and properties in those zones could suffer from Coastal Commission restrictions that will devalue their property.
The Coastal Commission also pushed Pacifica to include ‘managed retreat” as one adaptation strategy that could sacrifice people’s homes. The policy “allows long term shore recession over time, requiring the removal or relocation of structures and infrastructure, realignment of roads, etc.” The Coastal Commission prefers managed retreat versus armoring sea bluffs, arguing our beaches are maintained by locally eroded sediments. However, studies show our beaches are maintained primarily by sediments flowing from the Sierra Nevada that reach our coast via the San Francisco Bay. Extreme environmentalists have argued in favor of managed retreat, wanting nature to take its course, despite negative effects for property owners. They argued it is the most inexpensive option for city tax payers. However, citizens directly impacted do not want their property values to suffer based on shaky sea level predictions. Thus there has been a fierce public debate on sea level rise adaptation strategies for Pacifica, as elsewhere, and was just picked up by E&E News and reprinted in Scientific American under the title Prepare for 10 Feet of Sea Level Rise, California Commission Tells Coastal Cities.
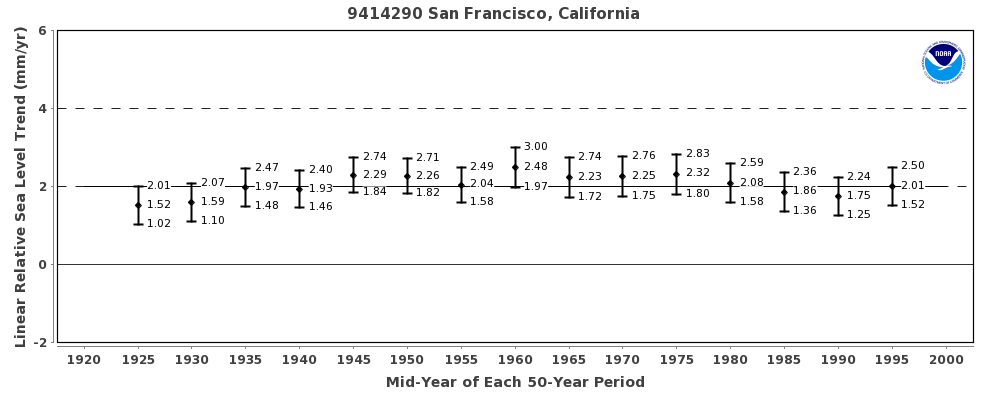
I have argued at every meeting that a 3- to 10-foot sea level rise is based only on the most extreme untested speculation. At the very least Pacifica can wait 20 years to test the validity of these extreme sea level rise hypotheses before enacting policy. Scientific American accurately reported, “Some of the climate change exaggerations of 3 feet of sea-level rise is equal to fearmongering,” stated Jim Steele, with the Community Working Group on Sea Level Rise in Pacifica,” then continuing my comments, “sea level has risen about 8 inches over the last century, a rate of about 2 millimeters a year. If that rate continued, it would take 144 years to rise just 1 foot.” What reporters failed to mention is I also stated from 1980 to 2014 there has been absolutely no rising sea level trend for San Francisco (as well as the west coast of the Americas) as seen in graph below. However, I suspect changing winds associated with the Pacific Decadal Oscillation, California’s sea level rise will revert back to 2 mm/year and perhaps increase to 3 mm/year over the next 2 decades.

Disentangling Natural Oscillations from Anthropogenic Causes
Our public discussions had focused only on adaptation policies based on the Coastal Commission’s sea level rise estimates. But because the validity of those estimates had not been discussed, I sponsored a public panel discussion event: The Science and Uncertainty of Sea Level Rise: 8 inches or 10 feet by 2100? David Behar, the Climate Program Director for the San Francisco Public Utilities Commission joined me. In 2013 former Interior Secretary Sally Jewell appointed him co-chair of the federal Advisory Committee on Climate Change and Natural Resource Science, so it was a balanced panel. Behar is responsible for guiding San Francisco’s adaptation policies. His belief was rates if regional sea level rise would return to 2 mm/year but continue to accelerate. How much acceleration to trust however was the critical question. Adaptation policy must rely on official scientific reports, but 5 official reports have all offered different guidance, making formulation of adaptation policies very difficult. Because the more extreme estimates, such as 10 feet by the year 2100 were untested speculation, he advocated adopting middle of the road estimates on sea level rise acceleration.
I argued whether you believe recent warming is natural or anthropogenic, warming can enhance monsoons that store more water on the land, and climate models predict warming will increase snow accumulation over Greenland and Antarctica. Such dynamics counteract sea level rise. Furthermore the 20th century experienced periods with greater acceleration of sea level rise than satellites have observed over the recent decade. So, I argued we must disentangle natural oscillation effects from any CO2-driven effects to scientifically guide adaptation policies. Thus, we need about 20 years of more data.
In contrast to concerns that rates of sea level rise have increased to ~3.1 mm/yr, 20th century tide gauge analyses revealed rates of rise of 4+ mm/ year every 20 years from 1900 to 2000 as illustrated in the graph below from Holgate 2007. The IPCC reported a similar range of acceleration but it was restricted to the 1930s and 40s using a different set of tide gauges that were averaged over longer time periods. These observed oscillating rates of sea level rise can be attributed to natural variations.

The twenty-year periods of sea level acceleration can be explained in part by the Pacific Decadal Oscillation’s (PDO) effect on the winds and El Niño’s. A positive PDO results in more El Nino events during which a greater proportion of rain falls back on the oceans causing global sea levels to rise. In contrast during a negative PDO, more La Nina events enhance the Asian and Australian monsoons so that more rain falls on land, causing sea levels to fall. In 2010-11 sea levels fell by 7 mm, despite extreme melting in Greenland. Two decades of satellite altimetry data also detected oscillating rates of sea level rise, but misleading adjustments have obscured those results.
From 1994 – 2002 satellites detected a 3.5 mm/yr acceleration in the rate of sea level rise, and CO2-modelers boasted that was just what their models predicted. However, from 2003–2011 the rate of sea level rise fell to 2.4 mm/yr. The 5 groups that process altimetry data all agreed on the observed deceleration (graph “a” below). However leading sea level researchers published concerns that a deceleration could be “an observation exploited by climate sceptics to refute global warming”, so they adjusted their altimetry data by removing suspected ENSO-PDO effects. Instead of natural oscillating rates of sea level rise with a recent deceleration from 2003-2011, global sea level was then reported as having jumped to an average rise of 3.3 mm/ year as seen in their adjustments in graph “b”.


The Pacifica extremists in favor of sacrificing homes and businesses to managed retreat argued those rising rates of sea level would continue as CO2-induced warming continued to rapid/y melt Greenland and Antarctica. The result would be sea levels far beyond what any sea walls could protect. I suggested to a few extremists that in reality Greenland’s ice accumulation oscillates and it had actually gained ice over the last two years (See DMI data discussed by David Burton on WUWT). But they scoffed at that fact, saying it simply couldn’t be true. In attempt to heal our divided citizenry, I invited a few of the more fervent extremists to go have a drink, and respectfully discuss the science. They replied, “we do not want to discuss the science,” and not one of them attended our subsequent public panel discussion The Science and Uncertainty of Sea Level Rise: 8 inches or 10 feet by 2100?
As I discussed on the panel, scientists reported Greenland had been cooling from 1940 to 2000, and that cooling was hypothesized to be due to increasing cloudiness. As shown in the graph below from Fettweis (2017) Reconstructions of the 1900–2015 Greenland ice sheet surface mass, ice accumulation was reduced during the well-documented natural warm period in the 1930s. Afterwards ice accumulated reaching Greenland’s greatest rates of the 20th century between the 1970s and 90s. As a rule of thumb if ice accumulation exceeds 400 to 500 Gigatons/year, it counteracts ice loss from glacial calving and basal melting, so Greenland gains ice. Indeed, global climate models predict that on a warming planet, whether natural or anthropogenic, evaporation increases producing more precipitation and more ice over the polar ice sheets. As illustrated between the 1960s and 1990s, Greenland typically gained more than 500 Gt/yr and the IPCC deemed Greenland’s ice mass was stable or slightly increasing with no contribution to rising sea level. However, between the late 1990s and 2012, correlating with less clouds, more solar heating and the negative North Atlantic Oscillation (NAO), Greenland did not accumulate enough surface ice to balance glacial discharge. That triggered global warming alarmists’ worst fears.
But as natural oscillations would predict, there would be no runaway melting. Greenland has now cycled back to gaining ice the last few years. In addition to the NAO’s effect on cloudiness, I had predicted that the NAO’s effect on warm intruding currents reaching Greenland’s shores would soon reverse and we should expect Greenland to gain ice by 2015. I was off by only one year.

Nonetheless, if Greenland has truly been responsible for any sea level acceleration from 1990-2012, with an estimated contribution of about 0.8 mm/yr, we should now observe sea level rates to fall by 0.8 mm/yr as Greenland now gains ice. So again, I advised our audience we must disentangle natural oscillations, if we are to let the best science guide sea level rise estimates and our adaptation policies.
Welcome to the Adjustocene
The suggested steady 3.3 mm/year rise since 1992 conflicted with CO2-driven model predictions of acceleration. So, based on the difficulties of calibrating altimetry with tide gauge data, various researchers claimed satellite drift and biases had over-estimated early estimates of sea level rise from 1994-2002. Various adjustments were then evoked, and varying rates of sea level rise published. New global sea level estimates rose at an accelerating rate from 1.8 in 1993 to 3.9 mm/yr today, others at 2.2 mm/yr in 1993 to 3.3 mm/yr in 2014, yet others found satellite adjustments lowered the average rate of sea level rise to 2.6 mm/yr over that same period. Elsewhere Harvard geophysicists were analyzing the effects of mass change on the earth’s rotation and wobble and were disturbed by the misfit between geophysical observations and sea level estimates. They argued that only if 20th century sea level rise was limited to 1.2 mm/yr could there be a good fit with geophysical expectations.
The GRACE satellite mission launched in 2002 allowed scientists to measure how much meltwater was being added mass to ocean volumes. However, GRACE data is also fraught with adjustments. As shown in the graph from Cazenave 2008, quality-controlled gravity data with no adjustments found no added mass to the world’s oceans between 2003 and 2008. That was consistent with NASA scientists who determined Antarctica had been accumulating more ice over eastern Antarctic than was being lost in western Antarctica, and thus Antarctica was lowering sea level, and counteracting and Greenland contributions.
However, workers studying Glacial Isostatic Adjustments (GIA) suggested the ocean’s basins are still adjusting to ice age glacier loads and suggested GRACE estimates of sea level rise should add 1 to 2 mm of sea level rise to their observed data. Cazenave chose to add 2 mm/yr, while others subjectively chose to only add 1 mm/yr in other studies. Elsewhere researchers found “GIA models may be unreliable, and that several recent secular Antarctic ice mass loss estimates are systematically biased, mainly too high.” Improving global coverage from GPS systems will allow us to determine which GIA models are more valid. So again, I argued we need a decade or two to test which GIA models can be appropriately applied to sea level change.
Finally, the IMBIE team recently reported western Antarctica ice loss has tripled over the past 2 decades, predicting accelerating ice loss to continue. Their conclusions that Antarctica as a whole was also losing ice were based on choice of adjustments, and so they suggested east Antarctica gained only 5 Gt/yr and could not offset ice losses. That contrasted with the NASA team’s estimate that eastern Antarctica was gaining 185 Gt/year. Whose adjustments to trust was discussed here. Nonetheless environmental extremists echoed only IMBIE’s conclusions to justify managed retreat. Again, I argued we must disentangle natural oscillations from any anthropogenic causes. Whatever amount of steady ice accumulates over east Antarctica, the basal melting of west Antarctica’s submerged glaciers will always oscillate. ENSO events affect the easterly winds promoting ~20-year episodes of greater upwelling (A) of relatively warm deep waters that accelerate melt of submerged grounding points of Amundsen Sea glaciers, followed by ~20-year episodes of reduced melting (B).

Sadly, I doubt the science I presented will sway extremists or mollify their paranoia that we will be overwhelmed by accelerating sea level rise. Unfortunately, the Coastal Commission argues the “best science available” suggests we consider the extreme 10-foot sea level rise by 2100. So extremists continue to push for managed retreat while home owners whose property values can be destroyed by Coastal Commission fiat will resist. Managed retreat and sea level rise are now front and center of Pacifica’s upcoming local elections. I can only hope we elect councilors who will resist climate extremism. On the bright side, one candidate told me that my comments at public meetings had enticed them to buy my book, so they could take a closer look at climate change. And perhaps, other news outlets other than Scientific American will shine a spotlight on this critical sea level rise issue.

Jim Steele is author of Landscapes & Cycles: An Environmentalist’s Journey to Climate Skepticism
So irresponsible to keep on using fossil fuels when climate science has provided empirical evidence that relates sea level rise directly to emissions.
Please see
https://tambonthongchai.com/2018/09/14/cumulativeslr/
SARCASM ALERT
LOL….I thought you lost your meds
Let Property Devaluation take it’s course.
Wakyfornia is a Prop 13 State which allows for Property Taxation to equal around 1% Gross Property Valuation.
If the $5M coastal parcel is devalued to $150k due to POTENTIAL erosion or Sea Level Possibilities, Their Property Tax should also drop from $50k per year to $1,500 PER YEAR vastly decreasing State Coffers
The Ministary Of «Truth» is at work?
Good report.
At several forums/publications to counter the sea level rise theories, I used to refer the San Francisco Airport where I did not noticed any change in sea level during my several visits.
The first figure supports, what I said is correct. Once again thank the author of the article for such a good and bold work.
Dr. S. Jeevananda Reddy
Yes, generally very interesting. I actually gave up all interest in satellite altimetry years ago when they started refusing to make available non GAIA-rigged versions of the data. Though I can understand someone who has property and their home at stake has to counter this BS propaganda, parading as science.
GAIA adjustments are a scam in relation to REAL coastal sea levels. Bolder CU present “mean sea level” data but it is a sea level which floats , phantom like, every higher above the waves. They also have non optional inverse barometer adjustments which are supposed to adjust for local differences in atm pressure raising or lowering sea level. However, this can not logically affect the global SL. What goes up , must come down. You can push and shove all you want the volume of water remains the same.
Oddly they apply this to global means are refuse to supply the data without this “correction”. I would bet dollars to doughnuts that it is making a difference to global mean sea level and that is why this will not show the two.
The ONLY sea level which is meaningful to coastal communities is the one measured at the end of the pier . End of story.
Did you really expect to notice change in bay level at SFO? What are the expected differences, if any, of the level of the Bay and the level of the sea (which is more than 10 miles away)? Over what period did you make your observations? (days, weeks, years). were all you observations taken at the same time relative to the tide (e.g., high or low)?
Unfortunately, sloppy statements like yours undermine legitimate scientific differences among qualified observers. Its like someone disputing, say, Arctic ice density having never set foot in the Arctic.
If sea level is raising at SFO, by this time airport should have sea water. Is it not so?
Few years back at TROPMET symposium in Hyderabad, Dr. P.K.Das, former DDGF presented a talk on sea level after organizers felicitated to him. I asked a question, what is the scenario of Indian coast lines. He replied that out of 12 measuring stations, at 8 stations there was no change and at the remaining 4 it downside. But later reports say different stories.
Before we go on saying sea level is raising, take each station and look at the reasons for raise or fall. For example in Italy coastal wells show no change. Same is the case with SFO – airport.
Dr. S. Jeevananda Reddy
Was I dreaming?
I thought I saw a story saying that it had been found that satellite measurements of sea level over the last decades had been found to be in error. The satellite data had overstated sea level rise by a factor of two.
Bob: The most recent revision was only to the record from the first satellite covering 1993-2000. That reduced the overall rate of rise to a little less than 3 cm/decade from a little above. It also allowed the “detection” of significant acceleration for the first time – enough acceleration to reach the midpoint of the IPCC’s projections about to about twice 20th century SLR.
Another adjustment that reduces the past thereby increasing the present. All to make it look worse than we thought.
Jeff: I’m glad you have read the papers and know that this adjustment is totally bogus. /sarcasm. The adjustment reduced the 25-year rate of SLR AND produced a detectable amount of acceleration in agreement with modest levels of SLR for the 21st century. If all they wanted to do was “make things worse than we thought”, they could have increased the rate of SLR reported by the most recent satellites, further increasing (rather than reducing) the 25-year rate, AND producing enough acceleration to produce alarming levels of SLR in the 21st century.
There ARE serious difficulties in measuring the rate of SLR from space. Satellites produce a massive number of data points making the confidence interval for rise relatively small. However, the size of the correction factors (for humidity, ionosphere, waves, spray, orbital parameters) are huge (feet). The potential for a systematic error are high – and there have already been at least three large systematic corrections, counting the latest (which cut the rate of SLR for the first satellite by a factor of 2).
When one assumes that everything the turns out the opposite from what one prefers is wrong, it renders one TOTALLY INCAPABLE of learning something new that doesn’t agree with your personal biases. This is known as confirmation bias. It took the Catholic Church a half a millennium to recognize that the Earth goes around the sun. Donald Trump believes more people attended his inauguration that Obama’s. Flat-Earthers know the Earth isn’t round. Have you joined that club?
Jeff,
There are very good reasons to believe the acceleration estimates are bogus. Frank has pushed some “easy arithmetic” based on simplistic analyses that assumes acceleration will continue and sea level will rise at rates suggested by the IPCC. But Frank seems to be in denial about episodes of deceleration.
Franks needs to read Holgate 2007 whose graph shows sea levels rates have oscillated between 0 and 4 mm/year every 20 years.
The adjustments created the greatest acceleration despite a 7mm drop in sea level 2010-2011 due to greater water storage on land during La Ninas. Although sea level rise rates actually fell according to altimetry data, several authors argued it happened because more water was being stored on land due to La Nina like circulation patterns. Using a coulda-woulda-shoulda argument that increased water storage masked the “real rate” of sea level rise, they removed ENSO effects to publish a virtual sea level rise.
Recent sea level rates of accelerated rise were attributed to increasing melt of Greenland’s ice cap, but that melt peaked in 2012. Since then there was less and less melt so that Greenland gained ice and reduced the rate of sea level rise so that only an IPCC apologist would believe sea level rise is still accelerating
Frank appears to be the only one here who thinks like a flat earther!
Jim Steele: Thank you for the reply. You are, of course, completely correct that I have made unstated assumptions by assuming constant constant acceleration. I still think those assumptions are the simplest way to convince the uninformed about the absurdity of 1 m of SLR by the end of the century.
In a certain sense, Jim is correct that I am in “denial” about the episodes of deceleration in the record of SLR. I’ve encountered the graph from Holgate (2007), never understood it, and dismissed it. A gross mistake. Actually, I first mentally tried drawing a straight line through those peaks and valleys and seeing if all of the straight line was within the 95% confidence interval for the data. (Plots are +/- 1 std.) Two stds comes close to permitting a roughly constant rise, but still is not good enough. So this time I looked more carefully at the paper, and then at Holgate (2004) which contains far more information.
https://agupubs.onlinelibrary.wiley.com/doi/full/10.1029/2004GL019626
Holgate is plotting the average rate for SLR FOR A DECADE every year. How accurately can we measure average SLR for one decade at one tide gauge, when properly accounting for the autocorrelated noise in the data? My understanding is that many tide gauges show rates something like 3+/-8 mm/y (95% ci) for periods as short as a decade. If you go out to 20 years, maybe you get something like 3+/-1 mm/y, perhaps barely enough to say SLR rose. And when you get out to 40 years for a single tide gauge, perhaps the confidence interval is down to a semi-usable 3+/-1 mm/y.
Assuming I am correct (I haven’t personally experimented with tide gauge data, only altimetry data), the signal in decadal SLR from a single tide gauge is dominated by noise. Holgate now averages tide gauges to get 13 regional composites with cover only part of the Earth. Three of these regions contain only 2 or 3 stations – probably not enough to average out the noise. Two of the three regions (SE Pacific and SW Atlantic) do show the greatest variability.
Steve McIntyre learned a lot by asking which sets of tree ring data contained a hockey stick (only one or two) and which were mostly noise. Channeling my inner Steve McIntyre, what regions on the globe are producing these massive swings in the rate of SLR. See Figure 3 below. Let’s look at the biggest deceleration from +5 mm/yr in 1980 to -1 mm/yr in 1988. Is this a global phenomena? No, the SE Pacific decelerates from about +10 mm/yr to -10 mm/yr and the SW Atlantic from +15 mm/yr to -5 mm/yr. Are these the only contributors to the deceleration? No, but a large fraction of the deceleration COULD be due to these regions with the noisiest data.
Next. I want to know how much of the wild swings is due to application of the inverse barometer to account for changing surface air pressure.
Figure 2. Global mean sea level trends (overlapping 10 year periods) corrected for GIA. Dotted line indicates the global average rate of 1.7 mm yr−1
Figure 3. Regional trends around (a) Europe (b) the Atlantic and (c) the Pacific. Trends have been offset by 5 mm yr−1 from each other for clarity.
Were there really big swings in the rate of SLR or is this noise? Or did winds on the average temporarily blow water away from the majority of tide gauges for a few years? Or was it caused by correction for inverse barometer? I’m not convinced we know. Surely someone else must have reanalyzed this data in the past 10 years.
Jim Steele: Thanks for the comments. Assuming sea level rises with a constant acceleration is an oversimplification. Nevertheless, I still think it is the best way to illustrate the folly of 1+ m of SLR by the end of the century. The amount of acceleration currently detected (if any) is far too small. We should have more than a half-century of lead time between detection of substantial acceleration and 1+ m of SLR in a century.
You are correct that I have ignored signs of deceleration in Holgate’s work. I didn’t understand it, so I ignored it. Bad mistake. Actually, first I looked at the confidence intervals (the ci’s shown are 1 STD) to see if a constant rate were possible. No.
So I read Holgate (2007) and the more useful Holgate (2004). The graphs are of SLR averaged over a decade. As I understand it – and I could be wrong – the data from a single tide gauge is incapable of telling us anything useful about SLR when you consider the 95% ci after correcting for autocorrelation. The confidence interval is usually much wider than the central estimate: say 2+/-5 mm/yr. If you look at 20-year averages, maybe you get 2+/-2 mm/yr. And if you look at an average over 40 years, maybe you get something meaningful like 2.0+/-0.5 mm/yr.
Holgate then combines records that are mostly noise into regional composites. Three of those regional composites contain only 2 or 3 tide gauges: SE Pacific, SW Atlantic and Australia. They may still be mostly noise. If you look at Figure 3 in Holgate (2004), you’ll see that SE Pacific and SW Atlantic show the greatest variation in SLR.
Steve McIntyre used to look carefully at proxy records to see which ones were hockeysticks (only a few) and which were noise (most). Channeling my inner McIntyre, let’s ask which regions are responsible for most of the large swings in the rate of SLR. Let’s pick the fall from +5 mm/yr in 1980 to -1 mm/yr in 1987/8. The rate of SLR dropped about 20 mm/yr in SE Pacific and SW Atlantic over this period. Did Holgate weight each region or each tide gauge equally? Most of the other regions don’t show a big change in SLR between 1980 and 1987. I think the 1980 to 1987 drop could be an artifact of the noisy signal from limited set of tide gauges. However, it would take a lot of work to figure out how Holgate arrived at his results.
If the shift of wind during a strong El Nino can raise sea level by about a foot off Peru and lower it by about a foot in the Western Pacific, can other weather patterns blow water away from most tide gauges (causing the apparent rate of SLR to fall)? Not in the North Atlantic. There is no where to hide. Not in the Northwest Pacific. Elsewhere, maybe.
Frank & Steve,
Don’t think of sea level as having one value with one rise rate; it is far from either, but varies considerably over place and time. Tidal sea rise data are local and influenced by many factors. GPS data show that land movement up and down (+-) of zero to 2 mm/yr are common. Local variations in tides, currents, temperature, pressure, etc. create differences among tidal locations.
Satellite data measure the open ocean. That also varies in height, but satellites average this out. On cannot compare any specific tidal gauge to satellite data.
However, when many tidal data are corrected for land movement, they can be compared to satellite data. Such large tidal compilations give sea rise rates generally over 1.1-1.9 mm/yr up to about 1990, when the tidal rates rise to ~3 mm/yr, similar to satellite data (available only after ~mid-90s). Because tidal and satellite data are acquired by different means with different corrections, agreement between the two lends their results some credence.
Compilations of many tidal data suggest some correlation with sea rise rates and global temperature. This is not surprising, considering that ocean thermal expansion is over 40% of the cause of sea rise. Generally sea rise rates vary over decadal time periods, and within a given period the rise rate is observed to vary from ~zero to over 4 mm/yr.
donb: You are certainly correct about the problem of vertical land motion (VLM). Some tide gauge records have been corrected for VLM by means of a GPS receiver directly attached to the structure with the tide gauge and some by GPS receivers nearby. All are often corrected for VLM using one of many global MODELS for glacial isostatic adjustment (GIA, rebound in some regions and subsidence in others). Tide gauges are also often corrected for changes in barometric pressure. I was generally referring to tide gauge data properly corrected for VLM and pressure.
Local sea level also varies with the prevailing wind. The winds that blow from West to East during an El Nino move a tremendous amount of water across the Pacific and create local SLR in Peru and local SLR fall in the Western Pacific. The 10-year rate of SLR in these locations that begins or ends with an El Nino is likely to show huge changes in the rate of SLR that have nothing to do with global changes. Water can literally be blown away from or towards tide gauges for a whole year by El Nino and probably for decades by AMO and PDO. Ocean current also effect sea level. (I’m told that the there has been little SLR at the Battery tide gauge in NY during one phase of AMO and much more during the other). It is possible that Holgate’s analysis is distorted because of these problems (but that is a hypothesis at best or unsupported speculation.)
donb wrote: “Satellite data measure the open ocean. That also varies in height, but satellites average this out. On cannot compare any specific tidal gauge to satellite data.”
No one cares about sea level in the open ocean. Tide gauges are located exactly where SLR is going to cause the most damage. We would have been better off directly attaching state-of-the-art GPS equipment and a barometer to every tide gauge in the world instead getting involved with satellite altimetry.
As it turns out, the best satellite altimetry can do is keep track of satellite drift to within 1 cm/yr in the vertical direction, and the results aren’t usually this good. So it is impossible to directly measure sea level from space. (Satellite altimetry groups don’t like to publicize this problem. When AR3 was being drafted around 1999 – after six years of satellite data – no conclusions about SLR were drawn from this data because of this problem.) Since about 2000, all groups are calculating the height of the satellite orbit (calibrating) by measuring the distance down to the sea at a various sites, beginning with “Harvest”, an abandon oil drilling platform off of Southern California coast with a GPS receiver. More sites have been added. Of course, sea level rising measured by satellite altimetry is no more accurate that sea level rise measured at these calibrations sites! (Morner has been complaining about this unpublicized change in procedure/adjustments.) Only after calibration from sites near of at land can satellites measure sea level in the middle of the ocean. With data from millions of grid cells, the 95% confidence interval for sea level rise measure by satellite altimetry is only +/-0.4 mm/yr, but the potential exists for sizable SYSTEMATIC errors (much greater than +/-0.4 mm/yr) in this complicated measurement process. There have already been several such corrections.
Frank,
There are different kinds of isostasy corrections.
Vertical land movement at/near the seashore of a tidal station, measured by GPS (some lidar techniques starting to be adopted), is used to correct individual tidal data in order to compare those data with other tidal stations or satellite data.
GIA stands for glacial isostatic adjustment and is generally applied only to satellite (0.3 mm/yr). The GIA corrects for the fact that the floors of ocean basins are sinking since land ice melted and underlying mantle is flowing back under continents. The GIA has no direct effect on tidal gauges.
For those living at a particular seashore, it is the uncorrected sea rise data at that site that is of importance.
Satellite of the open ocean relates to understanding the amount of new melt water being added to the ocean and how much the oceans are expanding due to heating. Sooner or later and in varying degrees, a larger ocean will affect all tidal data.
donb: It seems as if my replies have been held back or lost in moderation. I thought I submitted a long one to your comment. Here is a shorter version. The longer one may appear.
The orbits of the satellites are calibrated using tide gauges on the surface.
No one should care about sea level rise in the middle of the ocean. Tide gauges are located where rising SLR will cause the most damage. To fully understand the role of climate change, we need to understand how much of the SLR measured by tide gauges is caused by local VLM.
We also need to recognize that climate shifts create winds and currents that move water towards and away from various tide gauges. ENSO has a huge effect in the Pacific. Given all the noise in the data from a single tide gauge and other problems, decadal rates of SLR from a single tide gauge are meaningless. And you can’t average decadal tide gauge data into a composite data set without dealing with VLM first. Unfortunately, instead of simply attaching a good GPS and barometer to every tide gauge, climate science invested in satellite altimetry, which has the potential of large systematic errors influencing the final result. There are five groups that report SLR, but they don’t individually process all of the inputs (as UAH and RSS do). As best I can tell, they jointly process much of the data and then grid it differently.
Donb wrote: “GIA stands for glacial isostatic adjustment and is generally applied only to satellite (0.3 mm/yr). The GIA corrects for the fact that the floors of ocean basins are sinking since land ice melted and underlying mantle is flowing back under continents. The GIA has no direct effect on tidal gauges.”
There is a global GIA adjustment that is applied to global SLR data, stupidly applied IMO because SLR rise without GIA + VLM is what raises sea level on the coast where people live. There are several models of GIA that specify how much post glacial rebound and subsidence occur at every location on the planet. These local corrections can be applied to individual tide gauges – sometimes ignoring local GPS data on VLM. The global estimate for GIA is a composite of all local estimates, including subsiding sea floors.
I understand that scientists what to validate their models by showing that thermal expansion plus ice cap melting – GIA (and a few minor phenomena) account for the observed amount of SLR everywhere on the planet. But policymakers only need to know about SLR rise on their coasts, how much is due to climate change and how much is due to VLM. They have no way of understanding the potential systematic errors in satellite altimetry, nor the confirmation bias that influences every publication that refines some aspect of the problem and then concludes that the “SLR budget is closed”. The “budget is closed” by the choice of GIA model, choices made when calibrating satellite orbits and a host of other factors. Policymakers should be given the best possible processing of tide gauge data, because that is the simplest and most direct measure of the real problem.
Every single CA bureaucratic entity, city, county, and State has tried to enact severe restrictions on development and building within their “projected” expanded sea level rise inundation zones.
https://sfpublicpress.org/news/searise/2017-04/mapping-the-shoreline-building-boom-as-seas-rise
Thankfully, the Courts have overturned their attempt to de facto seize private property rights.
FEMA’s California Coastal Analysis and Mapping Project/Open Pacific Coast (CCAMP/OPC) should drive a stake through the heart of this beast, but probably won’t. The study is a joint effort with FEMA, NOAA, and Scripps Institution of Oceanography. Link, but note that the site will be deactivated October 1st.
http://www.r9map.org/Pages/CCamp-Main.aspx/
“California Coastal Analysis and Mapping Project (CCAMP)
This Website Will Be Deactivated As Of 10/1/2018
Region IX is initiating flood studies/mapping projects in coastal areas as a result of Congressional appropriations for Flood Hazard Mapping under Risk MAP . These efforts will address gaps in required engineering and mapping for high flood risk areas impacted by coastal flooding. Cumulatively, these flood studies/mapping projects are being referred to as the California Coastal Analysis and Mapping Project (CCAMP). ”
Products are Intermediate Data Submittals in four volumes. Volume 2 Table 1 summarizes sea level trends, ranging from MINUS 0.65 mm/yr at Crescent City to PLUS 4.73 mm/yr at Humboldt North Spit. Average is 1.7 mm/yr, standard deviation is 1.2 mm/yr. Supplement 2 covers offshore water levels.
Policy trend weighted toward San Francisco’s longest record is 1 to 2 mm/yr net of subsidence or uplift.
Jim: For talking to non-technical audiences, I like to talk about SLR rise in terms of inches/decade and inches/decade/decade. Today, current estimates of SLR from satellite altimetry are about 1 inch/decade and for the 20th century it was about 3/4 inch per decade. If SLR rise accelerates at 1 inch/decade/decade for the next eight decades, that is 2+3+4+5+6+7+8+9 = 44 inches by 2100. Anyone can do this arithmetic
Can’t we wait a decade or two to see if today’s rate of SLR double (to 2″/decade) or triples (to 3″/decade) before abandoning valuable property?
Nerem (2017) reported an acceleration of 0.084 +/-0.025 mm/y/y, or just about 1/3 inch/decade/decade. That arithmetic is simple too:
1.33 +1.67 + 2 + 2.33 + 2.67 + 3 + 3.33 + 3.67 = 20 inches ( 8 inches from the current rate plus 12 inches from acceleration. Just about the IPCC’s central estimate.
http://www.pnas.org/content/early/2018/02/06/1717312115
Daily tides in Pacific range from 2 to 6 feet.
Explain this 50 year average:
And correlate it to something that we can contribute to!
If sea level continues to rise at this rate, it will take 400 years to reach the levels at the time the Etruscans lived. This means we are able to use some of their harbors which right now are located a few hundred meters inland.
Lasse: As you know from the storm surge that occurs with hurricanes, the height of the ocean depends on the wind speed and direction. During El Ninos, the shift in wind produces about 1 foot of SLR in Peru and 1 foot of SL fall in the Western Pacific. The slight changes in 50-average SLR you cite are probably associated with changes in the PDO. An informal analysis of Battery Point, NYC allegedly showed a dramatic change in SL that correlated perfectly with the AMO. There is nothing intrinsically “wrong” with the data you show.
Some suggest that rising sea levels will increase storm surge. However the latest report by Scripps suggests there has been NO trend in the level of storm surge along the California coast (despite sea level rise)
Read Bromirski (2017) Storm surge along the Pacific coast of North America
https://agupubs.onlinelibrary.wiley.com/doi/abs/10.1002/2016JC012178
Jim, on the other side of the Pacific I built a sea wall across 3 adjoining blocks of land in 1963 in an estuarine location to AHD100 datum which is king tide level. Current highest astronomical tides are at least 6 inches lower than then. At another seafront I helped build a wall to that AHD100 datum in 1946 and it is a similar story today. About 6 inches lower. SLR isn’t happening on the east coast of Australia.
“Scientific American” is no longer “scientific” or “American”.
Sadly I was a lifetime subscriber until they went radical anti-CO2. There is so much data out there that is readily available to the least scientific reader that shows that this alarmism based on fossil fuel use is at the very least doubtful, that I could no longer trust them to be level-headed about climate fluxuations that just happened to heat the planet a little bit starting in the early 1950s.
Sea Level rise/fall ike Global Warming/Cooling; you can hide the facts only so long. There are places in the world that do have issues with increasing water levels, but these areas are subsiding in most cases because they are pumping water out of the ground. The Tidewater area of southeast Virginia is a prime example.
But “we are all going to die” headlines can only go so far before they are ignored by most of the public. There still is snow in the UK in winter, the Arctic still has ice and even the so called record warm water off Los Angeles this summer has been replaced by colder water.
The sad part is the CO2 induced global warming has become part of our lexicon and is stamped into all our young people’s heads in school. It will take years to get it taken out. There is just too much money to be lost.
I might add there is currently a corollary fight going on in nutrition. A lot of studies (and actual research in the science behind it) are showing LDL cholesterol does not contribute to heart disease. Big pharma makes tens of billions on statins made to counter LDL. Let’s see how this one plays out.
I am overlooking the Charlottetown harbour from my back yard. I want to assure coastal property owners all over the world that all is calm here today on the east coast of Canada. Will advise if any change.
Exceptional work, Jim!
So I just did some reading on Wikipedia about dikes in Netherlands. They have been building dikes in the Netherlands for over 1000 years. But somehow this is beyond the capability for California? SFO is built on the ocean, and presumably will have to be abandoned with the retreat policy. Meanwhile, they are still working on improvements and additions and are building a new hotel. The authorities don’t actually believe the ocean will rise as much as they say it will, or this wouldn’t be happening.
Maybe they are trying to drive prices down so they can have better housing affordability numbers…
Jeff in Calgary wrote:
“They have been building dikes in the Netherlands for over 1000 years.
But somehow this is beyond the capability for California? ”
Due to the scientific fact
that each year living in CA
lowers the IQ by one point,
which has caused the dykes in California
to protest, marching in the streets,
between their Trump protests,
because they want the name to be spelled
“The California Dykes”, not Dikes,
to celebrate “inclusion”,
diversity and whatever else
lefties celebrate.
The problem is actually the loss of wind! Bay isn’t muddy enough anymore.
Influence of an Observed Decadal Decline in Wind Speed on Turbidity in the San Francisco Estuary—– (Open Access) “This decline in turbidity during an already seasonally low turbidity portion of the year has potential negative effects on habitat for endangered fish like the Delta Smelt which are more likely to be caught in relatively turbid water.”
https://link.springer.com/article/10.1007/s12237-018-0403-x?wt_mc=alerts.TOCjournals&utm_source=toc&utm_medium=email&utm_campaign=toc_12237_41_7
This is interesting because turbidity is seldom measured or experimentally studied, with a few important exceptions. Some of the data in this long paper don’t seem all that significant and some winter months omitted which are part of the prediction in the abstract and conclusions. Nevertheless, this is a good thing to study, but the journal reviewers don’t understand that there are pros and cons, IT’S ALWAYS BAD! That is BAD ECOLOGY. Or they don’t even believe it, just throw it in.
Some fishes like clear water but the delta smelt is the Emperor. Interesting that it conflicts with seagrass imperatives, light somehow important there. Others are fighting mud.
The BADS (Ballads Always Detrimental Somewhere) always conflict with other BADS like windmills and bats.
a 10-foot (3048 mm) rise by the year 2100 (i.e., in 82 years) implies a monthly rise of 3.1 mm. Should be easy enough to gauge progress of this marine incursion in a relatively short time.
Exactly. Anchor a stainless steel beam to bedrock and mark the projected high tide mark every month. Gather the coastal commission together at the monthly high tide to see where the water is measured at. Should be self-evident and educational.
Climate change or not, sea level rise or not, erosion continues and coastal cliffs will be undermined by waves and tides, ultimately collapsing.
Prof Steele:
Sadly, I doubt the science I presented will sway extremists or mollify their paranoia that we will be overwhelmed by accelerating sea level rise.
I’d say, like me, you know the “scientists” aren’t really paranoid or even slightly concerned about the sea-level itself. What they’re concerned about is scaring the politicians enough to submit to their “recommendations” and maintaining their power over the situation. Power means continued grants, prestige and authority.
Psychopaths build ‘castles in the clouds’, whereas Sociopaths live in their ‘castles in the clouds’.
More lively the “Commission” and extremists want the sea side property for development of High-rise 5-star hotels with gambling casino’s for the Al Gore Jet-Setters and bring in money from child sex slave trafficking and narco cartels in addition to the “London Whales” lining the gambling tables.
Ha ha
“Sadly, I doubt the science I presented will sway extremists
or mollify their paranoia that we will be overwhelmed
by accelerating sea level rise.”
To them “science” is any prediction of the future
that is bad news and can be blamed on humans.
Jim,
3 to 10 foot SLR in 82 years corresponds to a SLR of 11 to 37mm/yr. And that assumes that Sea Level change accelerates to the higher rate instantaneously at midnight January 1 2019. That is, to say the least, not very likely..
GIA corrections to tide gauge elevation are conceptually valid, but pragmatically kind of uncertain. GIA modelling is, in fact, a bit questionable. “GIA corrections” to satellite observations are not meaningful for your purposes. AFAICS, they are used only to compute the Exaggerated Sea Level Rise (ESLR) reported by the satellite folks. The corrections need to be removed (multiply by 0.88) to get Eustatic Sea Level which is what tide gauges strive to estimate.
On top of all that, unless there is development at sea level in Pacifica, what you folks are concerned about is the erosion rate of your cliffs, not exactly how high the water will rise at the highest king tide. Converting sea level change to erosion rate is a much different problem than development along flat coastlines such as the US Gulf Coast. You folks probably need to be talking to Geologists and Civil Engineers who MAY actually know something rather than talking to climate “scientists” who are pretty much clueless.
If you do have development at sea level to worry about, you might want to consider giving the alarmists a foot or three extra on some types of development. Developers are likely to use the lowest estimate of storm surge they can get away with. That’s probably OK for parking lots and bait shops. But you don’t want a hospital with a foot or two of sea water sloshing around in the emergency room in the middle of a “500 year storm” which is quite possibly considerably more likely than the name suggests.
Sea rise rates over the open ocean, as satellite altimetry measure, is quite different from tidal gauge, near-shore sea rise. Tidal data vary considerably. Such variation persists even after GPS corrections are made for individual tidal data. However, after such GPs corrections, compilations of many tidal data show rise rates less than 2.0 prior to ~19990, and significant increase in rise rates after ~1990 to about 3.0, which are roughly comparable to satellite altimetry data.
This says nothing about what sea rise at San Fran. will be in the future. However, good evidence indicates that on average, sea rise follows global temperature.
donb,
The Holgate 2007 data does not show that rates of SLR follow global temperatures, but suggest other natural dynamics operating on ~20 year time scales
The IPCC graph of rates of SLR show greater rates of SLR in the 30s and 40s. What does that say about contributions from global temperature?
Estimates of sea level rise due to ocean warming and expansion range from 0.3 mm/yr to 1.9 mm.yr.
Contributions from Greenland and Antarctic ice melt do not correlate with global temperature change, as Greenland is now gaining ice and reducing SLR. While there are vast differences in estimates of Antarctic contributions.
From a societal point of view, only relative SLR measured by tide gauges that is important because it is local sea level rise that will impact humans
The graph you show does display some correlation with global temperature, as do similar graphs of combined altimetry data from other authors. Global temp decreased ~1910 and ~1960 and peaked ~1940 & 2000. Several individual tidal data show similar sea rise variations over ~decadal time periods. One has to examine the trend segments against all the tidal statistical noise.
The Holgate data are a limited set. Several authors have combined hundreds of individual tidal data, corrected for variable land movement obtained by GPS. Presumably these better average out individual tidal variations because of the many local sea level variations due to e.g., tides, currents, temperature, etc., etc.
Tidal and satellite data measure different beasts and require different corrections. Satellite data are more concerned with the causes (thermal expansion and ice melting), whereas inhabitants of most seashores are concerned with local tidal data.
See these references.
https://link.springer.com/article/10.1007/s10712-015-9314-6
Legeais et al Earth Syst. Sci. Data, 10, 281–301, 2018
https://www.earth-syst-sci-data.net/10/281/2018/essd-10-281-2018.pdf
https://doi.org/10.5194/essd-10-281-2018
donb,
You make some odd distinctions between altimetry and tide gauges even though all the adjustments to altimetry data has been due to calibration problems with tide gauge data.
You link to papers claiming a steady 3.3 mm/yr rate of rise when several other papers, as mentioned n the essay find no such thing
Furthermore neither you or the papers you link to address the Greenland problem. Since 2012 Greenland has contributed less and less to sea level rise and for the past 2 years caused a slight lowering as it has accumulated ice.
I don’t mean to imply satellite rise data give a fully constant rise rate, for they do not. Just as individual tidal data give short trends both up and down, so also does satellite date; e.g. rise rate went down in the ~2011 la Nina and up slightly in the 2015-16 el Nino. The overall altimetry trend (not all that well defined) is ~2.9 or ~3.2, depending on whether the GIA correction is applied (which is not relevant to tidal data).
Individual tidal data are not corrected by GPS for land movement, because it is the land relative to local sea rise that is of importance to that vicinity. Sometimes the land movement is the bigger part of measured tidal sea rise.
Compilations of tidal data are corrected such that they can be compared with satellite data taken only on the open oceans.
Greenland ice mass, as measured by GRACE, accelerated in its melting rate between 2002 and ~2012-13; since then the melting rate has decreased somewhat. Greenland ice is a balance between new snowfall and melting and /or faster flow rates. The approximate melting rate for Greenland ice over this period was approximately 280 billion tons per year. At such a rate over 8,000 years would be required for total melting.
West Antarctica is losing ice, but East Antarctic is gaining ice. The largest source of melting ice may be mountain glaciers outside the polar caps.
I agree with your advice to the San Francisco leaders. The long-term rise rate at that site cannot be accurately predicted. Best advice is be watchful and have more than one plan.