By Javier
A most remarkable climate phenomenon is taking place under our very noses without anybody paying attention to it.
As nearly everybody knows, the planet is warming. Since its short-term rate of temperature change hasn’t changed much, the warming is essentially accomplished because the planet spends less time cooling than warming. Therefore, periods of cooling have become shorter and result in less cooling.
In the figure below, we can see the top 10 biggest periods of cooling in terms of temperature decrease since 1950. The data used is a 13-month centered average of the monthly HadCRUT 4.6 global dataset found here:
The date given is that of the month of maximum temperature when the cooling started, and the length in months is to the month of minimum temperature when the cooling ended.
Notice how the top four took place before 1975, during the ENSO period dominated by La Niña conditions.
The data for the cooling period that started in 02/2016 (red in the figure) is provisional, as the cooling has not ended as of June 2018. If it continues for a few more months, it could easily make it to the top three.

Figure 1
The most remarkable thing is that every single top cooling period in the list has a reasonable explanation except the current one. Two of them are associated with the major volcanic eruptions of El Chichon and Pinatubo, and seven of them are associated with major La Niña events when the Multivariate ENSO Index (MEI) reached a standard deviation of -1 (see bottom panel in the figure).
Only the current cooling period remains there unexplained, without a big volcanic eruption and without a major La Niña event.
Climate scientists should be looking for a reason for this most interesting cooling instead of ignoring it.
Why is the planet cooling now?
Everybody can have their own favorite explanation. Personally, I see no other reasonable cause for the cooling but low solar activity.
In warm periods such as the one we are currently in, temperature jiggles up and down may look scary, but in reality we are in the halcyon day’s of a warm period. Best advice for Javier is to tell him to carry a sweater with him when it cools a bit.
Actually, reef studies have shown that the first half of an interglacial is warmer than the second half. It is therefore possible that the primary forcing that creates the interglacial dissipates allowing a drift back to cooler conditions but subject to secondary forcing that cause events like the Minoan, Roman, Medieval and current warm periods (with intervals of colder between them.
I recall a paper, which disappeared quite quickly, from two computer scientists that had removed the cyclic variations from Chinese temperature data and found four cycles; annual, decadal, multidecadal and half century. The paper stated that the underlying trend when you removed all four cycles was cooling, which is consistent with the reef studies.
After reading the paper online, I went back few weeks later to get the paper but I could not find it using Google (which may have been my mistake).
Does anyone have a copy of that paper?
“God has a sense of humor…” and
“A most remarkable climate phenomenon is taking place under our very noses without anybody paying attention to it.“
– Yes, my solar-climate work and predictions. lol – It’s really about the sun.
But I alone predicted both the warming peak from high solar activity that powered the last El Nino, and the cooling from low solar activity thereafter, with no surprises since 2014.
Also, on March 28 here I also predicted the blazing hot land temperatures of this summer from high insolation, ie high UV index, & less WV from low TSI, and the US drought:
“1. episodic hail/tornado events from colder atmosphere,
2. regional droughts from low-TSI ocean cooling and subsequent reduction in tropical evaporation
3. blazing May-October land temperatures due to high UV-index (high insolation) & less WV under low TSI.
4. widespread winter and normally out-of-season snow/ice damage events”
“The most remarkable thing is that every single top cooling period in the list has a reasonable explanation except the current one. “
The current cooling has just as reasonable an explanation as before, really the same reason again.
Hi Bob,
Of course it must have an explanation, but it is just not a widely accepted one.
Lucas J. Lourens et al (2009) “The mean annual insolation at the surface of the Earth depends only on the eccentricity and is represented by the following equation [24]:(2)Wam=S04(1−e2)
S0 is called the ‘solar constant’. In fact, the intensity of the Sun varies along with the number of sunspots. Recent observations have shown that when sunspots are numerous (scarce) the solar constant is about 1368 W·m−2 (1365 W·m−2). ”
This may be obsolete, and Leif claims sunspot number=everything else of any importance=a fraction of a watt in the solar cycle; but there are always supposed to be SOME sunspots. No sunspots at all seems a different situation.
If this statement from 2009 happened to be correct, the lack of sunspots would essentially cancel the purported human CO2 forcing.
Only the current cooling period remains there unexplained, without a big volcanic eruption and without a major La Niña event
Unexplained? Do you mean that the previous Niño, biggest in known history, is irrelevant?
Scientists ignoring major cooling?! Mainstream climate scientists seem to ignore almost everything that really counts. I have more trust in the flying spaghetti monster.
Chances of a hurricane in the Atlantic are decreasing. The temperature of the southern tropical Atlantic falls.
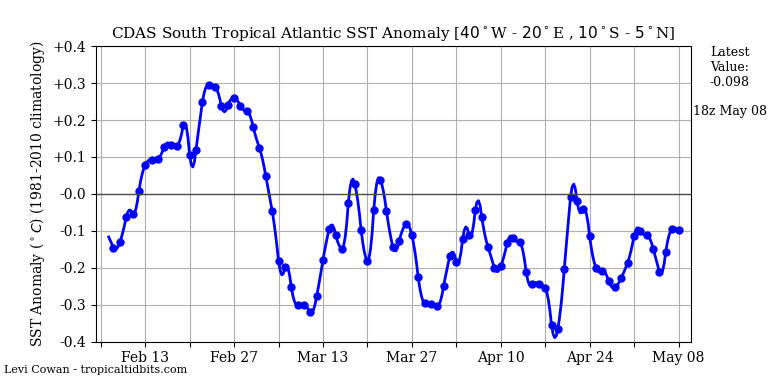
The surface temperature of the oceans in the southern hemisphere fell by 0.2 degrees compared to the average of 1971-2000.

The global surface temperature of the oceans has a downward trend.

Why does everyone continue with this joke that warming is be measured by changes in surface atmospheric temperatures? We know that oceans are earth’s heat sink. Global warming can only be measured by increases in ocean heat content. That makes El Nino a cooling event; not a warming event. Because it ejects heat into the atmosphere; most of that heat then makes its way out to space.
First, the heat in the form of water vapor spreads throughout the Earth’s atmosphere.
And is soon gone, radiated out to space as it must. Climate can only change if heat is retained. Heat is retained by oceans not by air.
I agree. The effect on the planet system is the opposite to the effect on the thermometers. This means the lack of a strong La Niña is a promise of future lack of warming in the thermometers.
Wave under the surface of the equatorial Pacific have to be strong, to be formed to El Niño.
http://www.cpc.ncep.noaa.gov/products/analysis_monitoring/enso_update/wkxzteq.shtml
I can only give one click on the plus spot….
But to answer your question, it starts out like the fish in the water that doesn’t know he(she) is in the water … ignorance related to poor perspective.
Like Bilbo looking out over the treetops and thinking the forest goes on forever … ignorance related to poor perspective.
My question is why, when perspective changes (because of input from someone like you), is there a transition into willful ignorance instead of increased knowledge? will you help me out here Ryan….
During low solar activity, the meridional jet stream causes ENSO to remain neutral. Because the solar minimum will still be in 2019, ENSO will remain neutral.
Yes. There should be a change to El Niño around the time of the solar minimum.
Great graphics.
Still think La Nina from here on. Perhaps an analog would be the long La Nina as seen in 1955/56.
“Climate scientists should be looking for a reason for this most interesting cooling instead of ignoring it.”
1. You have invented a metric.
2. You have failed to test this metric in other datasets to see if it is a artifact of the time series you selected.
3. You have failed to provide uncertainty measures for your metric.
4. Without uncertainty metrics one doesnt know that it is is intersting or part of the expected
variability.
classic fail.
do over.
show your work.
Also, we generally will not be interested in anything that is shorter than 15 or 20 years
Why do you say “we”? You are not a climate scientist, but an English major and software developer.
Pinatubo and El Chichon generated less cooling in the same time frame and a huge amount of scientific literature.
… the qualifier “generally” is used because “the hottest year on record” gets you really wet even though it is less than 15 years?
This is statistical rubbish. We had a big El Nino, and we went back to normal. That’s all.
If WUWT want to be taken serious they should avoid such claim.
And some readers should not rejoice about everything which SEEMS to support our case.
Careful, lest thy be declared to be a (gasp) LIBERAL!
Correlation is not necessarily causation.
@Johannes said-‘This is statistical rubbish.’
.
.
I ran this article through my statistical rubbish detector and it did not blink. Can you be more specific and point out the rubbish please? Mabe i need to get it recalibrated, heh.
.
.
Sandy,
Minister of Future
Right, because every year that makes it to the top 10 warmest years we don’t get the fact rubbed in our faces by serious climate scientists at the government’s pay.
Javier
“The data for the cooling period that started in 02/2016 (red in the figure) is provisional, as the cooling has not ended as of June 2018. If it continues for a few more months, it could easily make it to the top three.”
_____________________
How do we know the cooling since Feb 2016 hasn’t already ended? Seems like something that can really only be decided with sufficient data, not to say hindsight. For instance, from September 2017 there’s been a slight warming trend in HadCRUT4.6 (to June 2018).
That’s 10 months – surely a substantial period with an upward trend during a supposed ‘cooling’ episode? Who’s to say this warming, or leveling out even, won’t continue? If it does, then September 2017 will mark the end of the post-2015/16 El Nino cooling. That’s 20 months – closer to the bottom three than the top three on your chart.
Do not forget that in November often appears La Niña. At this time, the eastern South Pacific is very cold after the end of winter.
I know that not to be the case. I follow the daily global temperature in the Oz4caster blog.
https://oz4caster.wordpress.com/cfsr/
The yearly average has been going down all the way to a few days ago. I should know when there is a change of trend, and it has to raise the 13-month average, so it should take some time before that happens.
“How do we know the cooling since Feb 2016 hasn’t already ended?”
Anectdotally, the cooling hasn’t ended around my neck of the woods. This is one of the mildest August in my memory. Usually, this time of year it’s near 100 degrees and dry as a bone. This year it is raining as I type this and the temperatures have been very mild in comparison.
Yes, I know my little piece of paradise doesn’t represent the whole world, but we’ll see, won’t we. 🙂
Similar here in Northern California, night temps moved down to low 50s F with some below 50 F over the last several weeks. There are also changes to be noted such as the first freezing areas returning to the Himalayas, and to the mountains to the north. …https://earth.nullschool.net/#current/wind/surface/level/overlay=temp/orthographic=92.84,40.07,672/loc=94.312,32.534
DW Rice, you make a good point, but Feb 2018 is the lowest point thus far.
Since then, SSTs followed a several month TSI increase, now flattening out.
It remains to be seen how low cycle 24 TSI (and SSTs) will go from here in the time left in the cycle. TSI and SSTs will only fall so much in that time.
Here is an explanation for the recent cooling/
The author of the attached paper predicted the cooling.
It is interesting that there had been a massive increase (200% average) in mid-ocean seismic activity for the entire warming period (1996 -2016) as compared to the cold period (1979 to 1995).
The spikes in mid-ocean seismic activity highly correlate with increased Arctic temperatures and recent El Niño events.
There has been a sudden drop in mid-ocean seismic activity. Based on analysis of the record, there is a two-year lag in time from when the change in mid-ocean seismic activity occurred and when there was a change in planetary temperatures.
h/t to the NoTricks Zone.
http://notrickszone.com/#sthash.BlxTY2Yc.EpayRG49.dpbs
https://www.omicsonline.org/open-access/have-global-temperatures-reached-a-tipping-point-2573-458X-1000149.pdf
Certainly another possible explanation. This ain’t settled science.
WA, +100
Finally someone talking about the elephant in the room. The other source of heat energy on this planet, geothermal. And with 70% of the planet covered by water, guess where most of it goes. Though we do not know the complexities of the mechanics, undersea volcanism sure plays a role in both climate and weather over time.
its a very complicated elephant. no way to study it in a lucrative manner.
Thanks Javier, for having the courage to point out the obvious. This cooling appears to be ocean driven. This could be from solar forcing or internal cycling or a combination of both.
The rate of heat transfer from equator to pole shows signs of slowing significantly, especially in the Atlantic. At Ove Humlum’s Climate4You site, on the ocean page, take a look at the ocean temperatures down to 1900 m. Around the equator they have increased about 0.03 degrees, near the Arctic they have decreased 0.2 degrees – a x7 bigger change. Less equatorial heat is being transported poleward.
Why this is happening I would guess is connected with the Wyatt and Curry stadium wave process, of multiple oceanic oscillations around the world in some kind of nonlinear resonant synchronisation. For example both AMO and PDO in cooling. Those are the big ones everyone talks about, but there are several other important oscillations also (Indian, Southern oceans etc.)
http://www.climate4you.com
Hi Phil,
As you might know I am a huge fan of Marcia Wyatt’s stadium wave hypothesis. As we mainly measure and discuss surface temperature readings, we miss the resonances that take place in the system due to the dynamic transfer of heat from a part of the system to another.
This was my take on Wyatt & Curry’s 2014 figure:
It makes the system a little bit more predictable. The current temperature drop and pause in Arctic sea ice melting is not surprising under this light, and the prediction that sea level rise is likely to decelerate is slowly coming to place too:
https://climate.nasa.gov/vital-signs/sea-level/
Just zoom in the graph provided. October 2015, 83.7 mm. April 2018, 85.1 mm. That works out as 0.56 mm/year instead of the touted 3.4 mm/year. I might have been the only one to predict a slowdown in sea level rise for the next decades.
Mine is the black line.
One thing I have not written much about is that I believe the 55-75-yr oceanic oscillation that is the basis of the Stadium wave hypothesis is tuned to solar activity periodicities due to their effect on SST.
Javier’s approach in the head post is a bit novel and has thrown some commenters including Willis but I see it as a valid approach.
That said, I would prefer to see a longer deeper drop before coming to the stated conclusion due to inherent system inertia.
El Nino releases heat that warms the air and La Nina retains heat so that the air can cool. In theory they would balance out if system heat content remained flat but due to internal system variability it never does.
To see an extended period of cooling after an El Nino peak without seeing a strong La Nina or a large volcanic eruption is a significant phenomenon as Javier points out.
During periods of high solar activity one gets a step upwards from one 60 year PDO oscillation to the next (LIA to date) and when solar activity is low one gets a step downwards from one to the next (MWP to LIA).
The test now is whether we might be moving from upward stepping to downward stepping but it will be some years before we can be sure.
My explanation will be known to many here but for newbies see here:
http://joannenova.com.au/2015/01/is-the-sun-driving-ozone-and-changing-the-climate/
Thanks Stephen. I like to jump the gun a little on the data at the risk of being wrong, but alarmists do it all the time when there is a little extra warming. Unlike them, I am prepared to say I was wrong if I am. But I am convinced, as you are, that the current period of multi-decadal low solar activity is not going to see any significant warming. Flat to slight cooling is the path forward to 2035 in my mind. If we get the model predicted warming I will accept I was wrong.
“not going to see any significant warming”
But if there is, despite the fact of a general slow cooling trend from the holocene optimum, with about as low TSI as we will see in our lifetimes plus significant aerosol dimming thrown in for good measure, if there is…to draw attention to that would be alarmist right?
No Ryan. Observations are not the problem here. That the planet is warming is a fact. That we have put an unprecedented amount of non-condensing greenhouse gases in the atmosphere is a fact. That the increase in greenhouse gases is likely to be causing an increase in warming is a reasonable undemonstrated hypothesis. And it is undemonstrated because we cannot attribute the part of the increase in temperature to each possible cause with any degree of certainty.
Assuming that all the observed warming since 1950, and more compensated by aerosols, is due to the increase in greenhouse gases and running alarmist predictions from there using computer games is the problem here. When you base your work on unproven assumptions in science, the chances your work is wrong shoot through the roof. Most of what has been published in climate science in the past 3 decades will be shown wrong in due time and given how much publicity it has garnered, it is very likely to tarnish the reputation of all science for a long time.
Javier,
I think Ryan makes a fair point though because we’ve been here before. Look back to 2007/8 on WUWT and take your pick from the many global cooling predictions being made for the coming decade due variously to changes in PDO, reduction in solar, galactic cosmic rays… etc. Instead it warmed.
Now we’re hearing about ‘stadium waves’, reduced solar again and goodness knows what else that will cause imminent global cooling. What if it warms again over the next decade? Would you be convinced that CO2 was playing a stronger role than you currently believe if that happened?
Yes DW Rice. I have had this discussion multiple times. I am a data and evidence driven scientist. Scientific hypothesis are only useful as long as they make testable predictions that can distinguish them for competing hypotheses.
These are the predictions:
A warming that is above the midline between both arrows is incompatible with my favored hypothesis and I would be forced to reject it. Obviously a warming compatible with the orange arrow does not prove the solar hypothesis, but it does make it a better hypothesis that the CO2 one.
Thanks Javier, that’s very clear. I would say likewise that if warming is outside the lower 5-95% range by 2040 then CO2 warming is exaggerated by the models.
HadCRU is a pack of lies.
Note for instance the extent to which 1998-99 super El Nino has been cooled. It should be almost equal to 2015-16.
The Climate adjusters had to cool 1998 so they could promote the “hotter and hotter” meme. They couldn’t claim 2014 and 2015 were the “hottest years evah!” if they left 1998 as the second hottest year in the satellite record.
The UAH satellite chart still shows 1998 as the second hottest year. That’s why the alarmists ignore it or try to diminish its value.
Tom,
Yup.
The GASTA graph for the past two decades should look like a suspension bridge, ie two towers with the Pause slung between them.
Solar entrainment would make sense as the basis of oceanic oscillations, we already know that this happens on much longer timescales with obliquity (Milankovitch) forcing of the glacial-interglacial cycle, time-lagged by ocean thermal “inertia”.
There’s a lot of air and water on the planet. If something is driving warming and cooling trends it would have to be something BIG. Like, as big as the SUN or something.
Javier writes:
“As nearly everybody knows, the planet is warming. Since its short-term rate of temperature change hasn’t changed much, the warming is essentially accomplished because the planet spends less time cooling than warming. Therefore, periods of cooling have become shorter and result in less cooling.”
Nearly everybody here knows the planet cooled from 2002 to 2014 before the ‘short-term’ warming of the 2015-16 Super El Nino. Short term cooling following the peak of the Super El Nino of 1877-78 was just as great, and that was followed by another El Nino in 1880.
Javier it appears you have found a way to predict future temperature adjustments.
This cooling is clearly in error as it defies the current theory that forcings drive climate change.
No forcing. No change. Ipso facto this must be an error.
This obsession with surface air temperatures is an artifact of history not sensible science. Because we live on the surface, the easiest thing to measure, in the mid-17th century, was surface air temperature. We inherited that way of measuring the world from our forebears. Given earth’s climate is dominated by oceans and clouds, it makes sense no sense.
If we look at the anomalies of the geopotential height above the polar circle, we will understand that the water vapor escapes into the stratosphere above the 65th parallel. So it will continue during the solar minimum.
http://www.cpc.ncep.noaa.gov/products/stratosphere/strat-trop/gif_files/time_pres_HGT_ANOM_ALL_NH_2018.png
It is similar in the southern hemisphere.
http://www.cpc.ncep.noaa.gov/products/stratosphere/strat-trop/gif_files/time_pres_HGT_ANOM_ALL_SH_2018.png
What’s so hard about understanding cycles…..
http://www.climate4you.com/images/NOAA%20SST-NorthAtlantic%20GlobalMonthlyTempSince1979%20With37monthRunningAverage.gif
Low solar activity is one factor, but an ignored factor is the amount of water vapour that can be held in the atmosphere. Humidity varies between 1-4% of the local atmosphere. The driest places are only 1% while there is a max for the wettest places at 4%. Past 4% the water vapour condenses.
I think it may be a case where we’ve reached the global humidity saturation point. While the Earth was cooler it was possible for more H2O to enter the atmosphere and so contribute to faster warming. That extra heat capacity can explain the slower cooling. If the humidity level is indeed saturated then it’s property of warming the Earth will have reached it’s limit.
I see the recent cooling in HadCRUT4.6 about 75% explained by ENSO. The MEI dropped about 75% as much as it did in the cooling period that started in 1998.
Notably, UAH V6 shows the current cooling as being significantly less than the cooling period that started in 1998. http://www.drroyspencer.com/wp-content/uploads/UAH_LT_1979_thru_July_2018_v6-550×317.jpg
Well, the “cooling” since the 2015/16 peak was kind of to be expected. The question is what’s next? The ~60 year oscillation is the best predictor here. The ~20 year trends are already peaking. There will be a major la nina in the next few years and a zero ~20 year trend (hadcrut4) by 2023.
http://www.woodfortrees.org/plot/hadcrut4gl/plot/hadcrut4gl/from:1954/to:1980
@RichDavis
“In other words, nobody has accurately identified the primary cause for the atmosphere’s oscillating temperature?”
PRECISELY; some fools want us to beleave that the small amount of the trace gas CO2 is responsible for damn near everything and there is no-one with anything even close to the answer.
The ANSWER is “42”.
The SOI chart shows that La Nińa was growing in September 2016, but something disturbed further development.

If you compare the SOI graph with the neutron graph in Oulu then you can see:

1. decrease in solar activity since October 2016;
2. increase in solar activity from August to November 2017.
Low solar activity (meridional jet stream) interferes with both the development of La Niña, El Niño as well.
Low solar activity interferes with the ENSO cycle in the same way that it interferes with the formation of hurricanes in the Atlantic.
https://www.tropicaltidbits.com/sat/satlooper.php?region=atl&product=wv-mid