By Mike Bastasch
Scientists at the Scripps Institution of Oceanography recorded the warmest sea surface temperature taken in 102 years off the school’s pier in Southern California.

Scripps researchers recorded a high of 78.6 degrees Fahrenheit on Wednesday after a string of daily sea surface temperature records off the pier.
The researchers were quick to claim, “This is how global warming will play out,” according to a press release.

Wednesday’s sea surface temperature reading beat the previous record set on July 30, 1931, but only by 0.2 degrees Fahrenheit.
“It surpassed the previous record of 78.4°F (25.8°C) set on July 30, 1931, during an unusually warm period that year,” reads the Scripps release touting the new record temperature reading.
“Records related to heat and intense weather will become easier to break having been given a boost from anthropogenic climate change that has added about [one degree Celsius] to ocean temperatures over the past century,” scientists said, according to the release.
But while Scripps is trying to tie the record-high ocean reading to the broader wave of media coverage on global heat waves, there are a few caveats to note about what the scientists found.
First, these measurements are taken from a pier that’s near the shoreline, which would not necessarily make it representative of the entire Pacific Ocean, and therefore easily influenced by local weather events.
The “anomalously warm temperatures for the past week” that Scripps researchers observed at their pier somewhat mirror the temperature pattern in 1931, and indeed, the daily records broken in the past week have been very close to readings from 87 years ago.
There is an upward trend in temperature readings from Scripps’ pier, but the trend seems to also broadly coincide with the flipping of a natural ocean cycle, the Pacific Decadal Oscillation, to its warm phase. That flip occurred around 1976.

Source: Scripps Institution of Oceanography at the University of California San Diego
Also, the scientists themselves admit there’s lingering heat from the incredibly strong El Nino that peaked in 2016. Pacific Ocean temperatures don’t seem to have returned to normal in El Nino’s wake — in fact, forecasters say there’s a 65 percent of an El Nino forming this fall.
“It looks like we took a step up during 2014-2016 from which we have not completely recovered,” Scripps oceanographer Reinhard Flick said in a statement.
Scripps has been measuring sea surface temperatures and salinity off its pier since August 1916, and the school began gathering seafloor data in 1925.
Scripps still takes temperature measurements off its pier by hand, but in that time the technology used to log readings has changed dramatically.
Read more at Daily Caller
So
Like I said.
GB cycle is 87 years.
2018 -87 = ???
Link, please.
https://geoscienceenvironment.wordpress.com/2015/10/23/the-gleissberg-cycle-of-solar-activity/
Gleissberg Cycle is 80-90 years.
Bob Tisdale has a post on the 1976 climate shift
LINK
a 1995 published paper:
THE 1976-77 CLIMATE SHIFT OF THE PACIFIC OCEAN
By Arthur J. Miller, Daniel R. Cayan, Tim P. Barnett,
Nicholas E. Graham and Josef M. Oberhuber
OCEANOGRAPHY Vol. 7, No. 1, 1994
Can you – or I – reliably read a mercury in glass thermometer to plus/minus 0.2 F?
Whilst the observers there, I have no doubt, were trying to be accurate – as was I during my time as an Observer in Voluntary Observing Ships – that is a considerable (claimed) degree of accuracy – just for the reading.
I assume that it is likely that the 1931 and 2018 readings were performed by different people – better than eighty years apart, that looks a reasonable assumption.
[If the same person, likely now a centenarian, has the observer’s eyesight been checked recently? Just asking.]
Yes, other caveats have been entered too, I appreciate.
But the repeatability of the reading is certainly a caveat.
Auto
If you see a measurement without error bars, you are seeing PR not science.
A good point. I used to work in the surface mining industry in the UK in the 70s and 80s. That industry was licensed by the State. They made it part of the contract to install a weather station and daily record the various readings at each site. These readings eventually found their way to the UK Met Office for analysis. I would imagine that there must have been around twenty to thirty of these sites in the UK at any one time during this period.
So far so good, only these temperature readings were taken on a mercury thermometer and the pressure readings from a pen and ink paper drum by the surveyor’s apprentice every morning. It was a nothing job and half the year it was cold, wet and windy so that’s why a 17yo apprentice got the job. His ability to accurately read anything was never put to the question. It was just figures on a piece of paper. But they were included in the statistics nonetheless.
I wonder if, in 1931, did the observer/s know their readings would be scrutinised to 1/10ths, 1/100dths … of a degree, with a whole package of an agenda attached?
Recording essentially the same temperature as 87 years ago is just so scary. NOT!
What is not said is the oceans had been warming for 300 years prior to 1931 when man could have very little influence. It is much more likely that naturally warming oceans are the reason for a warmer atmosphere and not the other way around.
I concur that warming ocean = warming atmosphere. Warming oceans have no connection to human CO2 emissions. Interesting that PDO switch to warm phase in 1976 coincided with end of Global Cooling scare.
Sea surface temperatures along So. Cal. coast also follow coastal current variations. I wonder if persistent easterly winds blowing off-shore along the central California coast have pushed the California Current west of the Channel Islands. This could increase northerly eddy flow in the Southern California Bight. I imagine this may be the same weather patterns that produced the similar warming in the 1930’s.
SR
Read about the dust bowl drought 1932- 1939 and try to understand why droughts do occur.
It seems to me that since oceans make up about 71% of Earth’s surface area and since the albedo of open oceans is .04, meaning that oceans absorb about 96% of the solar energy that reaches the surface, there is damned little that CO2 could do to contribute to the warming of the oceans. It is TSI wot dunnit.
ThjomasJK,
The reflectivity for “open oceans” is only 0.04 at solar noon, with the sun directly overhead, and for that location only.
https://wattsupwiththat.com/2016/09/12/why-albedo-is-the-wrong-measure-of-reflectivity-for-modeling-climate/
There are a whole bunch of other considerations. It’s worth looking at the comments for that article. The actual value of the reflected energy is a quibble. It’s still quite small.
I think ThomasJK’s observation is well taken with regard to the energy that the oceans absorb. On the other hand, we can’t ignore the fact that the oceans also emit long wave infrared back to space.
“On the other hand, we can’t ignore the fact that the oceans also emit long wave infrared back to space.”
Yes, but most of the movement of energy from the oceans into the atmosphere and beyond is by evaporation of warm water.
radiation is a bit player.
According to this:
Back radiation – 66 watts / square meter
Conduction – 24 watts / square meter
Evaporation – 78 watts / square meter
“Very Interesting” Wolfgang I admit I’m surprised by the numbers. Until I googled the above link I would have been inclined to agree with you.
The numbers I supplied are global.
Locally, the story is different. Our own Willis Eschenbach points out that the evaporation which causes tropical thunderstorms can remove 500 – 600 watts / square meter link
If temperatures continue to rise as they have for 300 years, the AGW side will claim success as each new temperaure record is made. Am I wrong in thinking skeptics are poised for failure because the Climate Change argument has been framed , as “if temperatures rise it is due to Global Warming, and skeptics believe the planet isn’t warming.” So if temperatures rise due to non-AGW natural causes, AGW team wins the argument.
Mark: that is exactly what has happened, is happening and will continue to happen.
Fighting to expose the alarmist nonsense is akin to manually pushing water up hill.
AGW might be in for a surprise.
I only started looking at carbon levels which I saw clearly, I can do that from numbers, the co2 amounts went up and down with temperature anomalies, and with solar cycles.
(.. I was trying to compare rates of acceleration… like co2 rates acceleration and temps accelerating with them…… they weren’t there… instead what I saw was peak to peak values in solar activity…. there was one anomaly was in 1962/63 with a difference in cosmic rays, to me it made sense that if co2 rates of production were increasing, and then we should see increasing temps, not just increasing but temps rising exponentially, because it takes ” hundreds of years” for co2 to wash out. So the increasing co2 should be having a major impact on temps. In light of this has AGW changed any of their narrative? )
No chance AGW is wrong is there?
If other people start looking at this, it will really be the end for AGW. I will keep hitting the stone till it cracks.
How many ppm/v does it take to raise the temp 1 C ?
I think AGW and the msm are hyping local events because the climate is changing, just not warmer. Remember where every major snow storm was just weather? The window of opportunity for them to seize control is closing. I fully expect AGW to become more vocal.
There aren’t many skeptics out there who deny that the globe is warming. The beef is about using data from models that are consistently way too hot when run against real temperatures.
78.6 F? I don’t go in the Gulf unless it’s at least 80F.
……ditto, but 85 is better
Well mercy mem …… t’werent no wonder the water was …0.2 Degrees warmer than in 1931, …….
There t’werent this many people playing in the water in 31’, ….. to wit:
I would have added +10 but it won’t let me…
This is one of the most blatant cherry picks I’ve seen…..there’s piers up and down the Calif coast….how many of them were way below normal
We will soon read that the giant diesel powered GREENPEACE Rainbow Warrior was tied up at the Scripps pier … engines, and bilges pumping …
I’ll go out on a limb here and guess that there may have been somewhere else that was -.2C.
Has the pier been modified during those 80 years? If so, then where the temperature reading is being taken has likely changed. That close to shore, a few meters can make a big difference.
Sam C Cogar
From the legend beneath the shot of the impressive pier:
“The Ellen Browning Scripps Memorial Pier As one of the world’s biggest research piers, it is used for boat launching and a variety of experiments. Data on ocean conditions and plankton taken from the pier since 1916 provide an unparalleled source of information on changes in the coastal Pacific Ocean.”
From a single pier.
Get effing real, it’s a spit in the ocean!
I don’t believe Brighton Pier and Hastings Pier in the UK are considered bell weathers of the North Sea never mind the Atlantic. They might contribute a tiny amount of data, but unparalleled sources of information on changes in the coastal North Sea/Atlantic Ocean? I really don’t think so.
I know everything’s bigger in America, but not that sodding big.
That’s a lot of 31C wee wee going into the water!
37C isn’t it?
Ooops! I wonder if I could get at job at NASA revising their historical graphs…
Yes, but is 6C enough? 🙂
That’s Pier review for ye. 😉
The water IS occasionally warmer surrounding my upper thighs … did Scripps just measure that phenomenon?
It’s cold there. That’s why the weather is more comfortable.
Whimp
My thoughts exactly. It’s too damn cold to swim or surf in Santa Cruz. So the old surfers just wander the streets mumbling to themselves …
That’s not a swim, that’s a bath.
The error margin between the methods and instruments used then and now will be far greater than 0.2F, even greater still if they’ve faffed with the data to supposedly make it compatible!
And it’s not as if this year’s concerted propaganda campaign hasn’t produced similar laughable claims, a few days ago in July by a similar margin – old record was 41.0C
“Japan heatwave: Temperature hits new historic record 41.1C, says Japanese weather agency.”
Certainly 0.1C (0.2 F) would be within the margin of error. That doesn’t mean that the latest ‘best estimate’ somehow isn’t a new record. The old record was 25.8 +/- ? and the new record is 25.9 +/- ?
All they’re saying is that, given generally warmer ocean conditions at that location, the likelihood of new warmest temperatures being set during any particular warm spell has increased.
Yes, they believe that warmer temperatures are the result of ‘anthropogenic climate change’; but it doesn’t matter what caused the warmer temperatures. The fact that ocean temperatures are warmer for whatever reason means that the probability of continual new warmer temperature records being set has increased.
It is the highest measurement, there is no way of knowing if it is OR ISN’T an actual record.
Isn’t that just another way of saying it’s a new record high ‘best estimate’ temperature?
What WAS the margin of error for the thermometers that were in use in 1931? And then keep in mind that the readings were taken by someone, perhaps and older geezer who was adjusting his bifocals by hand to get an un-bleared reading, making and recording the readings. Did any of those who were keeping temperature records in the 1930s have any idea that 21st century climate science would be using their data as a reference? Or was it all about just yesterday, today and tomorrow to them and getting today’s reading made and recorded so they could get on with something important with no thought for longer periods of time?
ThomasJK
Lay off us “older geezers” Thomas! There’s a lot of about….
I would refer you to the Scripps methods section: https://scripps.ucsd.edu/programs/shorestations/methods/
Looks to me like they’ve been very fair and thorough.
Hey! Us “older geezers” tend to do things like adjusting our glasses in the same way every time. In other words, by habit. It helps keep us from forgetting things during our daily routine.
Let’s see if they can find another meaningless, isolated, and of questionable method temperature to report.
Worry not! They will, and with alacrity too!!!
“Worry not! They will, and with alacrity too!!!”
And also with redundancy too, as well!
tomwys
Nor with the slightest hint of shame.
0.2 degrees Fahrenheit…..in 102 years
well, obviously the heat is not hiding there
Do they really use a Fahrenheit scale? I guess their reading was 0.1 degrees C higher, and, to make more splash, they converted it to Fahrenheit.
Do surface temps really matter? Lake Michigan is chewing up and spitting out a lot of tourists these days because the surface temps are in the upper 60’s, but 18 inches down water is cold enough to cause hypothermia in 6-7 minutes.
Probably not. Dr. Popsicle actually collects data on cold water effects. Even after falling through the ice it takes much longer than 6 or 7 minutes for hypothermia to occur, in most people.
https://ebsadventure.com/blogs/news/45505473-cold-water-immersion
Though I have no doubt Lake Michigan is colder than heck.
BCBill
How cold is heck?
🙂
‘This Is How Global Warming Will Play Out:’
Conditions that are practically indistinguishable from those observed 87 years ago?
Warm records set 2:1 over cold records. That is one way it is playing out already.
Maybe because 97% of the measurements are taken in cities …(UHI)
UHI has been proven to not change the known warming rate. Note that the rate of warming in rural areas is the same as the rate in urban areas. This experiment has been run, and run many times.
Sorry you’re a UHI denier. It does in fact contribute to trends. You’ve just been brainwashed, thats all.
Anthony,
I saw this recently while working on trying to grow my tropical plants in less than tropical location.
USDA Zone Map for Plant Hardiness measures temperature zone for growing various plants:
http://planthardiness.ars.usda.gov/phzmweb/interactivemap.aspx
Notice the huge percentage of cities on the edge of each zone that fall into the warmer zone dispite being physically located in the colder zone.
Birmingham, Atlanta, Charlotte, New Orleans, Baltmore, Hartford, Louisville, Flagstaff, Dallas, Pittsburg…many more.
If it is this obvious in a map, shouldn’t it be obvious in the hard data?
Alley
Finally, a denier shows up on WUWT!
🙂
I see you’re an adjustments “denier” (using your term.) I said the “rate” of warming is the same rural vs urban, and that is true. The rate is determined by adjusted values, not raw values.
Using raw values is not good science. Using adjusted values is good science, but you seem to reject adjustments. Adjustments actually make rural areas show slightly more warming that urban areas, but let’s pretend that adjustments do the opposite just so people can continue to be upset.
Again, ask a science organization to run the stations you are speaking of. I think you will be surprised at the results, and scientists will not be the least bit surprised.
Alley, maybe it would be helpful to your credibility to tell us a bit about your background that allows you to make these assertions as if you have some kind of authority to declare what is “good science”. This is not intended to be a snarky comment. It really would be helpful to me to understand where you are coming from that you are so certain about your facts.
Using raw values is not good science. Using adjusted values is good science
WHAT????????
I can’t believe someone actually believes that enough to actually post it in public! SMH!
I know. People who think raw data should be used need to go back and read some basic science.
As above, I’d love to see there faces when they realize that raw data shows an even greater warming trend. Only thing that would get them to start reading about why temps are adjusted.
How much do you get paid to make a fool out of yourself?
UHI effects are clear if you look at the data. http://appinsys.com/GlobalWarming/GW_Part3_UrbanHeat.htm
“Using raw values is not good science. Using adjusted values is good science
WHAT????????”
Exactly! There are people who want to use the temps taken in the morning, and pretend that they are to be treated the same as temps taken at noon or the afternoon. Adjustments are a huge part of doing this properly.
And how else deal with UHI effects? Seems there are people who want to use raw data, and they have no clue that the resulting temp trend is higher with raw data. I guess that’s what they need to see to stop speaking of adjustments as “fudging” the numbers.
Mr. Mosher has maintained this for some time. While interesting, what physical basis do you propose for rural areas warming at the same rate as urban. Are you suggesting a couple watts of global CO2 downwelling is so powerful that it renders urban thermal mass and CO2 concentration, as opposed to rural biomass and CO2 depletion inconsequential?
“While interesting, what physical basis do you propose for rural areas warming at the same rate as urban.”
Propose? Do people think that this has not been studied? It’s not that big of a stretch for a science organization that is already plotting temp trends to plot only rural station trends.
No proposal needed. Simple results are all we need. Adjustments, the “faking” of data does adjust properly, although maybe too much. Urban areas tend to show less of a warming trend after adjustments. Now people have to decide if they want to scream about those horrible adjustments which lower the overall global trend, or keep them and scream about the UHI.
“Propose? Do people think that this has not been studied? It’s not that big of a stretch for a science organization that is already plotting temp trends to plot only rural station trends.”
Again, you can’t average different locations together. That’s just physically meaningless.
There are MANY individual locations that have not warmed over their entire record. There are some that have cooled, and others that have warmed. But you can’t average them together and have a meaningful result. Bad bad bad.
Like all of your facts, your claim that the rate of warming is the same in rural and urban stations is just not true.
“Using raw values is not good science. ”
Neither is averaging intensive properties (temperature) from different stations. Yet EVERYONE does it.
It really is amazing to me how warmists really do believe that they are entitled to their own facts.
That makes sense…there’s at least twice as much UHI…and temps have been consistently increasing for over a century
Twice as much UHI? Go ahead, remove all urban stations. You get the same warming trend.
Why are people missing the obvious? You can say that UHI is an issue, but scientists looked at this possibility and concluded that looking at rural temps was good enough to stop this nonsense. Scientists were wrong: people continue to pretend that UHI is the driving force.
The scientists didn’t look very hard, and confirmation bias ruled UHI out, not real science.
Do you really believe that the rate of warming since AD 1850 has been the same in Las Vegas as in rural Clark County, NV? In Phoenix as in rural AZ?
Adjusted or raw? Pick one so there can be a discussion where we’re on the same page.
Do I really “think” that UHI has contributed to the warming trend (urban or entire) for all results from major science organizations? No, of course not. No scientist thinks that UHI is the reason the trends show warming.
For example, use only urban areas. They show the same warming. no need to even bother with urban temps. Just forget about them, and if you really want to go crazy (and do something wrong) use raw data as long as they come from stations that have been reporting at the same TOD. The global trend is… warming of course.
There is a large data reconstruction set called RUTI (Rural Unadjusted Temperature Index), and it shows a radically different amount of warming, less than half the other land based thermometer reconstructions.
Tony Heller has shown that as far as the US is concerned, there is no need for any TOB adjustment. He has examined the warming trend of all US stations in the USHCN series, and has broken these down to those where the readings were taken in the morning, and those where the readings were taken in the afternoon. The trend is exactly the same in both station sets and this establishes that those stations that had afternoon TOBS do not show an enhanced warming trend caused by notionally double counting warm days such that there is no need to make any TOB adjustment.
Tony Heller has shown that as far as the US is concerned, the only warming is the adjustments made to the data, and if unadjusted RAW data is used there is no warming, and the US has cooled since the 1930s. A view that was once held by Hansen.
“Tony Heller has shown that as far as the US is concerned, there is no need for any TOB adjustment.”
Heller has shown that he adds up temps and divides by the number of stations. He also does not adjust when all others do. See Curry.
So unless you apply the same adjustments as do the warmists, you aren’t doing science.
No attempt to defend the adjustments, they must be right because the adjusted data matches the models.
We assume that rural and urban warming rates are the same.
We then adjust the raw data until it shows what the models say they should show.
Then we proclaim that the models have been verified.
Alley, you need to read Anthony Watts’ published work on comparing well-sited sampling locations with the larger body of NASA and NOAA’s network.
You also might want to question the practice of homogenizing pristine sites with poorly sited locations. Are those that do that the scientists to which you refer?
Dave, I already read it. You should read it, then follow up with the trends of rural sites only. Let us know when the “aha” moment arrives.
No need to homogenize anything. Like I keep on telling you, rural sites show warming indistinguishable from the total sites.
Lke I keep telling you, the best sites as rated by Watts and others show the same warming.
Why are you so afraid of looking at the trends of rural sites? Why shy from the trends of the most pristine sites? This work has been done, so all hand-waving about UHI is absurd.
Alley
I don’t think anyone’s claiming it’s the driving force, but it is a significant variable and one largely ignored until it was highlighted. Nor can the influence of air conditioning units, vehicles and other random irregularities be excluded from the equation.
Then there’s ‘recorded’ records from ill maintained Stephenson screens, if painted at all, done so with non conforming paints.
Of course the quality of the thermometers themselves must be considered as well, along with variables such as the height of the one taking the temperature reading and the precision of an eyeballed mercury thermometer.
There’s also the the question of the people who took the readings; tea boys sent out to read the data in the rain and snow, or when the on site ‘scientist’ was too drunk or lazy to bother himself because it wasn’t much more than a local exercise. Cabin boys who could barely write chucking buckets over the sides of ships for SST data when there was a typhoon to ride out. I’ll bet that was a popular use of his time amongst his shipmates.
The temperature of the UK has varied dramatically over the past week or so, some places recording almost 30°C, down to 18°C on the same day at the same time. Our little island barely extends more than 600 miles in length, peppered with temperature sensing technology. Now look at the vast areas of Russia, thousands of miles with nothing resembling a human never mind a temperature sensing station. Africa is worse and South America barely better.
So how in all this can we get down to 1/10th of a degree as a measurement of current global temperatures never mind historic global temperatures?
In any other sphere of science the variables would be considered far too random to draw the conclusion that we must devote trillions of $’s and £’s to the mitigation of a hypothesis that has never been empirically demonstrated, ever, that atmospheric CO2 causes global warming.
After 40 years of the best minds in the world desperately seeking to prove the hypothesis of CO2 derived global warming, I have found one single study that demonstrated it, and it was roundly discredited. There should be dozens, if not hundreds, but there are none.
The entire proposition is beyond scientific reason.
And I’ll make one final observation.
From the following data you will note that observed temperatures are barely warming and well below IPCC predictions.
Now, if you can calculate the warming associated with mankind, and subtract that from the observed temperatures in the illustration, I suspect you may find global temperatures are in fact falling. The earth is, and has been cooling, a far worse prospect than it warming.
So if the CO2 AGW hypothesis is true, mankind is doing a sterling job of ensuring temperatures aren’t far colder than they are now.
Monckton graphs are always interesting. Did you know (probably not) that the IPCC models have done such a good job that the Monckton’s of the world had to scramble to find a “better” graph than the old Monckton graphs?
A Monckton graph?
Take a closer look mate. The legend states “JR Christy. Univ Alabama…..”. Is this an example of your observational qualities? Or is Christy stealing Monckton’s work and presenting it as his own now? That’s perhaps a quality of alarmist scientists you recognise, but not Christy.
Is this also a Monckton graph?
Or this?
Or this?
You might want to produce some evidence of your assertion that “Monckton’s of the world had to scramble to find a “better” graph than the old Monckton graphs?”
Or it another observational triumph of yours?
Even if that were true, so what? How does that prove the theory? At what scale of analysis? There are only three things the climate can do from any given point in time; stay the same, get colder, or get warmer. If it stays the same an excuse is made. If it gets colder an excuse is made. If it gets warmer, that ‘proves’ the theory.
I made a living modeling the stock markets and am amazed that the scientists have any credibility based on the performance of their climate change models to fit reality… It seems the only thing they have gotten right is the direction. The earth has been warming for 150 plus years.. if the earth warms more it proves nothing. If it cools it proves nothing… As a layman, I have a question for the scientist partcipants. What is actually driving the warming since the LIA? If we dont know the answer to that, how can we ever determine the affects of Co2.
It’ has been warming. Solar irradiation is low. Ice melting. Sea levels rising. Blooms earlier. Migrations towards the poles.
Earth is warming. We don’t need to hash that one out. Is it CO2? What else could it be?
Alley,
The idea that, “it’s warming so it must be CO2” because some climate scientists have said so, is an oversimplification of what those scientists actually theorized. There are many things that could cause the earth to warm or cool it…this is self evident (re: the paleoclimate record).
What was specifically theorized regarding CO2 was a specific “fingerprint” of troposphere warming and stratosphere cooling. This “dipole” was the only method to see CO2 causing climate change…and, it should be noted, the only place it’s been observed is in computer models.
So, either educate yourself on what you’re talking about, or stop repeating silly nonsense about “it’s warming so it must be CO2”.
Sincerely,
rip
rip
He can’t help himself, that’s the only evidence he has.
Take pity.
I’m sorry, but I would not call what he presented evidence. It is simply a statement with no evidence.
Thousands of other things.
Small changes in solar radiation doesn’t impact temperatures immediately, the earth has a lot of thermal lag.
There are all of the ocean cycles, many of which were unknown a few decades ago.
There’s also the fact that the earth has been warmer than it is today for about 95% of the last 10,000 years. Until you can explain why that was, you can’t simply declare that it must be CO2 merely because you can’t think of anything else.
MarkW
He can’t think
Oh! almost forgot…… of anything else.
“Conditions that are practically indistinguishable from those observed 87 years ago?”
______________
Not quite. The 0.2F figure refers to the ‘daily’ temperature record only. Conditions are much warmer at Scripps Peer today than they were in the 1930s according to the Scripps link in the article.
Christ, DW! You compare Super El Nino years with the past.
And look at the cooling from the 1930’s to the 1980’s. Other than the Super El Ninos, the graph doesn’t show anything unusual in a world warming up out of the Little Ice Age slightly.
It’s Scripps’s own data Dave. Temperatures are about a degree Celsius warmer at Scripps pier today than they were for most of the 20th century, irrespective of what caused it. It’s hardly controversial to suggest, as the scientists have done, that this will make new heat records more likely there.
Interesting how the 4th warmest year was followed by the 2nd coldest year. Also interesting how 3 and 4 years ago were colder than about half the years during the 30s and 40s.
The truth is that surface water temperature at Scripps is related to weather. This sumner there’s been high pressure over the deserts keeping winds over the ocean light and the marine layer thin. That provides more sunlight to warm the water and prevents upwelling from cooling it down. Since there are deep submarine canyons right off shore there’s plenty of very cold water available when wind and currents create upwelling.
A high pressure system is a good explanation for why the temperature is higher there at that pier.
Remember the “Hot Spot” in the ocean that was out off the coast of California a few years ago? It was connected to the high pressure system that was sitting over that location at the time, which was allowing the ocean to absorb large amounts of heat. The heat only went a few meters deep in the ocean which is why they ruled out underwater volcanoes as the cause.
https://edmhdotme.wordpress.com/holocene-context-for-catastrophic-anthropogenic-global-warming/
DWR… My comment was directly related to the context of Scripps’ press release… the breaking of a mid-summer temperature record somewhere by a rather unremarkable 0.2 F.
I’ll concede that pursuing one of any number of possible links and then torturing the data to present some other context can provide the basis for misleading counterarguments.
It is an unstated assumption that the same body of water that is being measured. There is an old proverb about how one can never step into the same stream twice. The above graph could represent general oceanic warming, or it could represent a decrease in upwelling, or a shift in a warmer ocean current. Experiments only work if all parameters are held constant except the one of interest. As others have pointed out, the urbanization of Southern California has resulted in the constant dumping of waste water, year round, from an Urban Heat Island, when formerly much less water made it to the ocean in the Summer because of the Mediterranean Climate.
Warm records will naturally outnumber cold records …. it is acknowledged by all that the modern scientific era and the modern industrial era both begin at the end of the Little Ice Age. This means that dependable temperature records begin to be recorded just as the world begins to warm up again after a couple hundred years of unusually cold temperatures.
If it were the other way around, if we had begun accurate measurements of air temperature at the end of a Warm Period, we would be seeing more low temperature records as the world cooled off.
I wish there was a description of the techniques used, in the past and currently.
There has been good discussion on water temp measurements here that show much affect the water temp readings.
Scripps state their methods in the above link and here: https://scripps.ucsd.edu/programs/shorestations/methods/
They appear to be continuing to use the original methods: Niskin bottles for tide gauge and near bottom measurements, and insulated sampling buckets for the surface. Glass mercury thermometers were used until the mid 1950s then engraved stem mercury immersion thermometers until 2008, when they went digital.
So to save me some reading time… in their methods, or anywhere, do they indicate the error range of each method of collection, and each method of measuring? Have they carefully and accurately recorded time of day? Does the method described reveal exactly the bucket(s) used, how deep it went, how they made sure it collected a sample from exactly the same depth each time, was the depth determined from the surface of the water or from the ocean floor beneath, how long from the time of collection until the temperature reading, how long each thermometer stayed immersed in the bucket before reading, what was the wind speed around the bucket the entire time it was above the surface of the ocean…? I know only a little about calculating margin of error, but so far I am easily seeing a realistic margin of error as +/- 4°F. (And as an aside, most calculated margins of error, generated from sampling, are a crock. +/- 3% points, when the sample was obtained from 1,000 (roughly) people who actually answered their phones and gave a response, and that’s supposed to represent the actual opinion of 300+ million people? Tell me another one!)
Honestly, there’s not a lot of reading to the synopsis they supply at the site.
There’s an extensive list of peer reviewed articles there that presumably go into greater detail, mostly pay-walled alas: https://scripps.ucsd.edu/programs/shorestations/methods/
Let me guess: There was a boat docked and idling its engines right next to the sea surface temperature sensor at the Scripps pier?
Yet, I don’t think any scientist can explain how CO2 can warm the ocean. If they can, then perhaps they will accurately project changes in ENSO, the AMO, and NAO. If you cannot forecast changes in ENSO, you cannot project changes in our climate
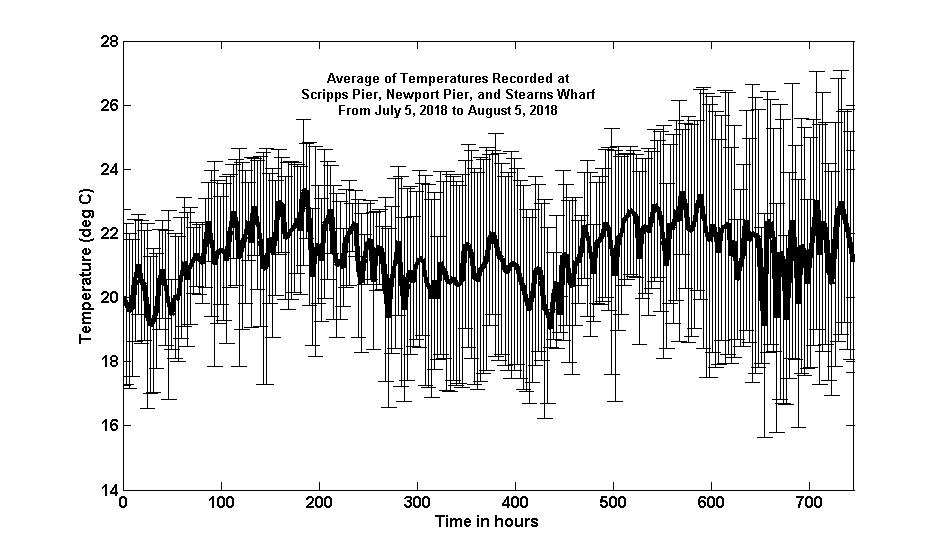
Climate folks seem to like to distinguish (sometimes) between local conditions and global indicators. Out of curiosity I got the data from three Southern CA pier stations (Scripps Pier, Newport Pier, and Stearns Wharf, which roughly span San Diego, LA, and Santa Barbara) at
http://sccoos.org/data/autoss/
Then I calculated the mean of the three stations’ reported temperatures every 2 hours and the standard deviations. I hope the plot shows up, here is and attempt to paste it, for what its worth.
First try did not work. Here is a maybe working link
It doesn’t seem to show up. Can anyone tell me how to enter a graphic into a comment?
Thanks dmacleo. I got it now.
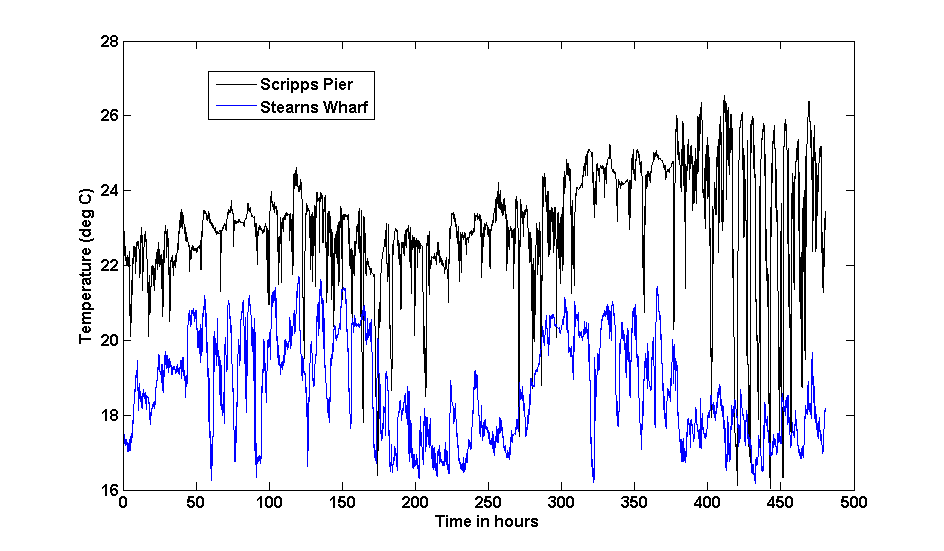
There is a good bit of difference between the time behavior of the various stations also. This plot compares Stearns Wharf with Scripps Pier. The Scripps data, particularly the past week or so has had large swings of about 10 deg C on a more frequent than daily basis, while Stearns variations are about 2 deg C over much longer times.
The plots are posted now.
https://wattsupwiththat.com/2018/06/04/open-thread-trying-out-a-new-comment-system/
UPDATE2: You can display an image (or YouTube video) within a comment, (see examples in the thread below) but you MUST use https rather than http. Just simply insert the image URL, no tags or HTML needed.
If you use http all you’ll get is a link, but no embedded image.
tinypic doesn’t use https
Test:
*Ahem*
…which I think means you need to find another host other than tinypic. Would Dropbox work?
use this:
https://postimages.org/
no sign up required, and you can resize images easily.
And they use https:
postimage is good IMO. Upload using 640×480 (for message boards) and select the ‘No expiration’ option if it doesn’t default.
Oh, and post using ‘Direct link’
Those are mighty big swings in the Scripps graph ? 10 degrees per day ?
I didn’t look in detail, but the period seems like it might be close to the tidal cycles. Possibly bringing cold water in and out and allowing water to be more efficiently irradiated near the pier. As I recall students at UC Santa Barbara used to complain about the shielding effect (on the waves) of the channel islands just off the coast. They may modify the currents in and around Santa Barbara.
“It surpassed the previous record of 78.4°F (25.8°C) set on July 30, 1931″…?
I didn’t know they had Digital Thermometers with that accuracy in 1931 !
The early glass mercury thermometers had 0.1C precision but since the mid 50s this has risen to 0.01C, same as the modern digital measurements. Despite the higher precision of modern instruments, measurements are always rounded to the nearest tenth of a degree Celsius, so it shouldn’t much difference. The old record was 25.8C and the new one is 25.9C.
It most certainly would if they were using F in the past and converted an already rounded amoumt qmd then rerounded.
They didn’t use F for the official records at any time according to their site. Page 1 of the written record is shown and it’s in C.
“At Scripps Pier the earliest measurements were recorded in tenths of a degree Celsius (0.1°C), BUT NO INFORMATION CAN BE FOUND ON CALIBRATION TECHNIQUES.”
So, the precision may be comparable, but we don’t know anything about the accuracy of the historical measurements. It is an unsupportable claim.
There seems to be some clutching at straws here. It’s not a stretch to assume that, since temperatures were recorded to 0.1, they had thermometers capable of permitting this degree of precision. Why would they record it to that level of precision if they didn’t have a suitable instrument? The equipment they used then is basically the same mercury-in-glass thermometer still used in meteorology today.
When reading a thermometer marked in degrees, one reads between the lines to estimate the tenths. If a reading is between 20 and 21, one doesn’t record 20 if it looks to be less then halfway to 21, and 21 if it’s above that mark. One estimates the tenths, and then applies the error bar at +/- 0.5 deg.
I’ve never seen a liquid thermometer marked in tenths of a degree, but I’m sure they must exist. The question is, though, were these used either then or now, to get those measurements?
A clinical thermometer which you stick in your mouth (or elsewhere) is normally marked in tenths of a degree
I would assume that the person clutching at straws is the one who assumes that there could not possibly be any errors in how the data was collected.
After all, these guys are scientists.
DW Rice
You’re avin a laugh intcha?
50 years ago people didn’t care about global weather. Temperature measurements were largely for local weather, not a means of frightening the earth’s population.
Tea boys were sent out in the snow to the Stephenson screen instead of the scientist, cabin boys chucked buckets over the side of a ship, assuming the weather allowed it. A tall guy would read a thermomoter differently from a short guy.
Imagining that 50 years ago, never mind longer, there were accurate temperature measurements is laughable. Scientists can’t even agree on temperatures now for Pete’s sake.
DW Rice,
In the days of common use of MIG thermometers (i.e. 1931) laboratory thermometers were routinely calibrated at two points on the scale (0 & 100), and it was assumed that any mis-scribing of the scale was simply an offset or multiplier effect. That is, interpolation was assumed to be accurate based on the assumption that the hole the mercury moved through was of constant diameter, or varied so little that it didn’t affect the precision OR accuracy. The recorded temperatures were then adjusted in accuracy for the calibrated end-points. For the technology of the day, and typically only scribing to 0.2 degrees C, these were fairly safe assumptions, although rarely demonstrated to be valid assumptions. [Incidentally, the calibration procedure also assumes that the ice-water bath and the boiling water bath are well stirred. The most convenient stirring implement, particularly before magnetic stirrers, was the fragile thermometer. Thus, the calibration procedure is fraught with potential error and should probably be repeated several times.]
Now, here is the crux of the problem. MIG thermometers are, as noted, rather fragile and are broken frequently. I have never known a lab to calibrate thermometers before being placed on a stock room shelf. The practice is to calibrate before being put in use for purpose. So, one can easily imagine a situation where some stock room personnel, or perhaps a graduate student, is instructed to go take the daily temperatures at the end of the pier. A gust of wind, a high wave, or simply a careless moment, and the obligatory “Oh, schist!” and the person runs back to get another — uncalibrated — thermometer from the stock room. Whether the person, who might have been different at different times, remembered to calibrate the thermometer and subsequently correct the reading(s) is why the lack of information on calibration procedures, and an audit trail on the calibrations, makes the records problematic.
You demonstrate a lack of familiarity with laboratory procedures and instrumentation. Today’s MIG thermometers (when used) are superior to those used in the early-20th Century, largely because machine manufacturing has reduced errors from variations in dimensional tolerances. Yet, you naively claim that old temperatures are as trustworthy as modern temperatures. In summary, the proof for suitability of purpose is not in evidence. If the claimed difference is only 0.1 deg C, with no information provided on the accuracy of the 1931 thermometer, and the precision of the thermometer being either 0.1 or 0.2 deg C, a rounding-off judgment could well explain the difference. It is a typical alarmist action of trying to make a mountain out of a mole hill.
It was their finely calibrated bifocals wot dunnit.
The Scripps Pier is also the location of a NOAA tide station. The most recent sea level measurements there are still lower than the peak measurements from the 1990s; approximately 6 inches lower than the peak El Nino year of 1998. The indicated long term sea level rise for this very credible tide station is only 2.17 mm per year, or 8.5 inches per 100 years.
Documented sea level decline since 1998. Guess this is how Global Warming will play out.
LAT’s – lead story in Sunday’s print edition, in the leading paragraph, quoted the Scripps Pier reading as 78.8 degrees (not 78.6), and failed to mention that it broke the 87 year-old record set in 1931 by only 0.20 F; proclaiming that this is proof of ‘man-made’ global warming.
LAT’s (print edition): “Record heat in California is no fluke, experts warn — Rising temperatures have fueled wildfire conditions and blunt talk from scientists about climate change” Here: http://www.latimes.com/local/lanow/la-me-california-july-hot-20180805-story.html
They shrill that “downtown L.A. recorded its hottest Thanksgiving Day on record at 92 degrees;”but fail to mention that the record high – still standing – for the month of November is 100 degrees, set on Nov 1, 1966 (would have been no to little AGW that far back).
In all of their shrill fear-mongering coverage this past month (and, it’s been every day) they decided not to share these still standing record heat waves for Los Angeles:
July 24, 1891 – 103
July 25, 1891 – 109 – Still standing as the all time record high for the month of July.
July 26, 1891 – 102
And, for Aug gets here, this one is still on the books:
Aug 17, 1885 – 104
Aug 18, 1885 – 102
Aug 19, 1885 – 106 – Still standing as the all time record high for the month of Aug.
All with no UHI effect.
Another one in the LAT’s fear mongering piece:
According to Intellicast, other still standing equal or higher record highs for Redding include:
July 3 – 115
July 4 – 114
July 10 – 115
July 11 – 114
July 12 – 115
July 14 – 114
July 17 – 113
July 18 – 114
July 19 – 116
July 20 – 118
July 23 – 114
July 24 – 113
July 28 – 113
July 29 – 116
Redding is a hot place in July.
“anthropogenic climate change that has added about [one degree Celsius] to ocean temperatures over the past century,”
I’m confused. If global warming has added about one degree Celsius to ocean temperatures over the past century then why was the record only broken by 0.2 degrees C?
Because that was a daily temperature only and is therefore much more likely to be affected by unusually warm weather conditions, which can occur pretty much any summer. If you look at the annual data, for example, which is much less affected by unusual weather conditions, you’ll see that a new warmest record has been set 3 times in recent years. Most recently 2017 beat the last record set in 2016. See the Scripps link above.
And to see how they determined that, all you have to do is subtract the raw data from the adjusted data. Yep, 1°C/century.
What adjustments have been made to the Scripps pier data?
I’m more confused by the “anthropogenic” part. How much of the temperature change is due to non-anthropogenic causes? It seems that 100% of it is due to SUVs, beef eating and plastic straws.
The temperature on the day 04.08.2018.

woops, something ain’t right
Yep, up there where the fire is, there is a seriously cool anomaly.
Cold sea/warm land = No rain = Fire
Here’s how I see it. Cold ocean surface temperatures (at or below 10C) lead to less evaporation; less evaporation, less rain in northern California; less rain, drought conditions; drought conditions, less evaporative cooling; less evaporative cooling, higher daytime air temperatures; dry hot air and desiccated underbrush, wildfires.
And what is causing unusually cold water off northern California? How do we blame that on human CO2 emissions? I got nothin’. Wait, wait, is it plastic straws from San Francisco sucking the heat away?
That top graph displays the Southern California Bight clearly has something different going on. Looks like lots of upwelling happening north of Point Conception, and none south and east of it. It looks like the California Current is flowing west of the Channel Islands, creating an eddy current which is drawing water northward from Mexico. I see La Jolla Point is in the middle of the warmest waters in that area. The Scripps pier is undoubtedly bathed in water discharged from the San Diego River and water discharged from the cities of San Diego and Tijuana, as waters to the south are actually cooler.
Looks like the warming is human caused, alright – lots more of them living nearby!
SR
The troubling part of this release is ““Records related to heat and intense weather will become easier to break having been given a boost from anthropogenic climate change that has added about [one degree Celsius] to ocean temperatures over the past century,” scientists said, according to the release.”
I don’t think there is any valid data to support this statement. The very implication that ocean temperatures have changed more than atmospheric temps is not possible and that some ocean temps in certain areas have changed due to AGW is a stretch.
How do these things get by the reviewers or even the editors that print them?
the sky is falling….
the oceans are rising…
man when the 2 hit gonna make for an interesting day..
Sky falling is preventing the coastlines from flooding, so it’s actually worse than we thought!
There the Climate Liars go again, confusing and conflating natural warming which is real, with “anthropogenic warming”, which may or may not exist, but if it does, is too small to measure. For the kabillionth time, yes, we know there has been some warming since the LIA, and damn good thing too. No, it doesn’t mean the warming will necessarily continue.
Of course, there is global warming – after the “Little ice age” ended some 140 years ago – by natural variability. I wonder, do the alarmists regret that the Little ice age no longer prevails?
A measurement of 78.6 implies a measurement accuracy of + or – .05 degrees. Is this even possible for these type measurements? I’m skeptical.
Actually, it is +/-0.09 deg F because the original measurements were in degrees Celcius.
These are meaningless ocean temperature claims.
There were very few Southern Hemisphere
sea surface measurements
before 1940, and still not enough today.
The measurement methodology
has changed many times,
not to mention
changes in the locations
of the measurments:
– Wood buckets
– Canvas buckets
– Insulated canvas buckets
– Ship engine cooling water intake
– Disposable Bathythermograph
Sondes, and:
– ARGO Floating Buoys
As far as I know, there has never been a test
of all these six different measurement methodologies
in the same location, at the same time
to find out whether they all
provided the same temperature
measurement (of course they would not be the same,
and that’s why there will never be a test !)
I doubt if historical sea surface temperature
measurements margins of error could be
less than +/- 1 degree C., so a new record
by 0.2 degrees C. is meaningless.
It took 87 years to break the 1931 record
by 0.2 degrees C. ?
And is that supposed to scare people?
A “good” climate change article HAS to scare people,
or it is a waste of bandwidth — Leftists Rule 14b.
For example, and I am being serious here,
although I have not yet seen such an article yet,
I expect a future climate change article
to claim global warming is causing
man’s ‘favorite organ’ to shrink, at an
unprecedented rate
(the word unprecedented is mandatory
— Leftist Rule 16a).
My climate change blog:
http://www.elOnionBloggle.Blogspot.com
My pool in southern Arizona is running above 90 F now for 2 weeks. warmest Late July early August pool temp I’ve had in the 5 years I’ve owned my house here.
But July wasn’t particularly above normal. Hot as usual, with afternoon highs around 105-107 F, but I think the way the night time cloud cover has played-out has kept the usual radiative cooling suppressed. An analysis of night time lows would confirm or refute this possibility. But it’s not that important to me. I like the warm pool becasue it still feels great at night for swims.