With those hot weather records in Los Angeles being set, it’s important to remember where measurements are taken. I’ve done an investigation and found that every “all time high” reported by the LA Times is from a station compromised by heat sources and heat sinks. In my opinion, the data from these stations is worthless.
It’s been going on for some time, for example, back in 2010, because there’s been a questionable high reading reading at USC of 113°F. This 2010 LA Times article tells why:
How hot was it? The National Weather Service’s thermometer downtown reached 113 degrees for the first time since records began being kept in 1877 — and then stopped working. The record highs follow a summer of record lows.
September 27, 2010 | By Bob Pool and Rong-Gong Lin II, Los Angeles Times
It was so hot Monday that it broke the all-time record — and the weatherman’s thermometer.
The National Weather Service’s thermometer for downtown Los Angeles headed into uncharted territory at 12:15 p.m. Monday, reaching 113 degrees for the first time since records began being kept in 1877.
Shortly after that banner moment, the temperature dipped back to 111, and then climbed back to 112. Then at 1 p.m., the thermometer stopped working.The weather service office in Oxnard rushed an electronics technician 60 miles southeast to the USC campus to repair the thermometer, which is actually a highly sensitive wire connected to electronic equipment. Because of the snafu, officials said it’s possible Monday’s temperature actually was hotter than 113 — but they might never know.
Or, the data was just bogus because the sensor was failing…but we’ll never know.
Here’s the USC weather station that had ‘all time record high’ surrounded by cars and asphalt. I wonder what it looked like when original record was set?
The ASOS type station used at USC is notorious for producing false record highs where there aren’t any. For example, Honolulu and Tucson.
And just look where the USC weather station is located: (click to enlarge)

Here is a close-up view.

Look at all the service vehicles parked around it. One wonders recent record high that was claimed there is just another result of a vehicle being parked to close to it like the Ice Cream Truck debacle that denied a new all-time record high for Scotland a few days ago.
Then there’s the downtown Los Angeles station, which set a record high the other day. It’s on top of the parking garage at the LA Department of Power and Light, which I first identified in 2008.

More vehicles right next to the weather station…Downtown L.A. set a new record of 104 degrees on Saturday, from this station.
Let’s look at some of the other locations for record high temperatures set in LA this past week. According to this LA Times article:
Among the places that hit that milestone Friday were Van Nuys Airport (117 degrees), Burbank Airport (114), UCLA (111) and Santa Ana (114).
Let’s have a look at those stations.
Van Nuys Airport:
It’s another ASOS station snuggled between an industrial park, runway, road, and taxiway. Note the row of planes and private homes near the taxiway.

Street view of Van Nuys airport weather station:

I wonder, did a plane come out of the driveway and blow hot exhaust fumes that day? if so, we can apparently blame the Germans for this one.
Burbank Airport:

Yes, the weather station is virtually surrounded by asphalt runways, taxiways, and aircraft parking ramps. The likelihood for the station to get in the middle of a 400F jetwash is almost a certainty, being so close to taxiways with turns. This is a ridiculous place to measure for high temperatures.
Back in the day, the Burbank airport didn’t have as much of these biasing factors.

UCLA’s weather station is on the roof of the Math Sciences/Atmospheric Sciences building. Why? there’s no place else to put it. There’s hardly a free and open space left. Here’s the ground view from Google Street View

And the rooftop view. Note the squirrel cage blower and exhaust vent nearby.

And here’s the piece d’ resistance, Santa Ana:

Yes that’s right, it’s on a rooftop at the fire station there.

Here is a closeup view:
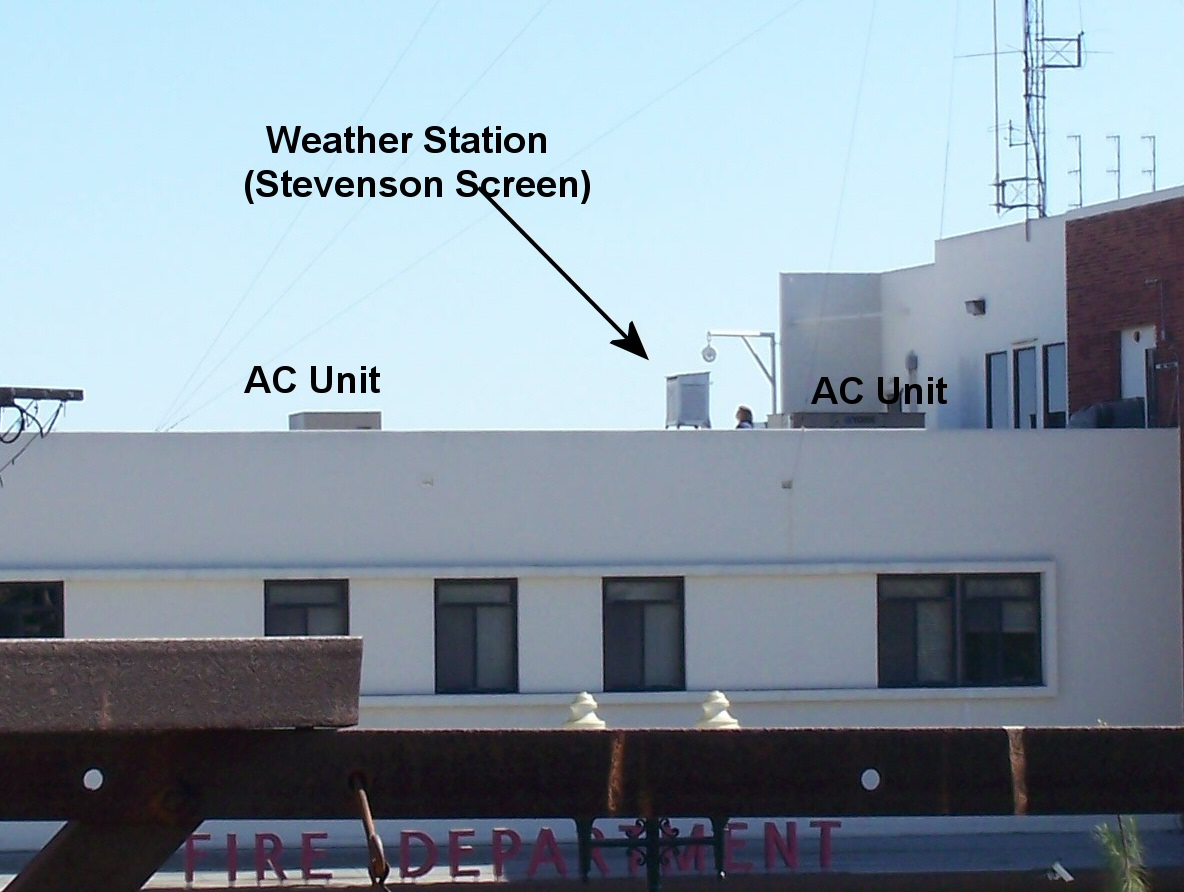
A rooftop with air conditioners, a perfect place for measuring high temperature records that are guaranteed to be wrong becuase they are upwardly biased by the roof, the building, and the AC heat exchanger exhausts. But let’s just ignore all that and blame “CO2 induced warming” and demand people stop driving, using so much electricity, and eating meat. Yeah, that’s the ticket.
A reminder, NOAA’s own requirements for the placement of thermometers to record climate data has been violated on every one of these stations.
Thermometers
Thermometers should be shielded from the sun, rain, snow and other sources of light, heat, or cold that can cause erroneous readings. If an instrument shelter is used, it should be designed to allow the maximum possible free flow of air while providing protection from heat, precipitation and light. A shady location on the northeast side of the school is a preferred site.
The thermometer should be 4.5 to 6 feet above the ground and in a grassy location. (You may need to keep a step stool nearby for short people because readings are taken at eye level to minimize parallax error.) A flat, open clearing is desirable so that the thermometer is freely ventilated by the flow of air. Stay at least 100 feet away from concrete or paved surfaces. Avoid balconies, patios, enclosed porches, and beneath eaves.
This is why every one of these high temperature readings made by the stations above should be disqualified.
Weather stations at airports are designed to offer information that is helpful to ‘local ‘ flight movements , while the airport environment may not be typical area it will have lots of open areas of hard-standing and jet wash that can add to the local heat environment .
Let us be clear , they are not used because they offer good data for a greater environment, they are used because ‘they are there and better than nothing’
In the good old days before ‘settled science’ these issues existed but where not considered significant because its all a bit hit and miss anyway .
All that has occurred is that the problems have remained , but now there is need to claim great accuracy to prove ‘settled science ‘
Linked by DailyCaller article http://dailycaller.com/2018/07/09/record-temperature-los-angeles-compromised/
Which is on the Drudge front page today.
What if we used cemeteries as place to get accurate city readings?
A great place to plant all those dead sensors
A nice way for a layman to consider the heat from auto exhaust in an urban environment. Consider a car getting 30 mpg at 60 mph. It would be burning 2 gph (gal per hour). Now freeze frame the autos on the highway and consider if every one of them were to burn 2 gal of gasoline in place over a one hour period. It would have an effect on the immediate surrounding air temp.
Now consider the paved/concrete surfaces and roof top surfaces. I measured it. It’s now 4:00 pm EDT, sunny, and air temp is now 87 F and a 6 mph breeze. Last nights low ambient temp was 55 F. My blacktop driveway is now 146 F, the concrete walkway is 131 F, the hood of my vehicle is 159 F, and the grass is 91 F. The sunny side of my brick house will reach over 140 F if I don’t water it. That is some real-time data of passive urban heat. If last nights low temp had have been 20 F warmer (75 F) the measurements may have been greater with perhaps the exception of the grass and car hood.
The exhaust air from an A/C compressor condensing coil is really hot and depending on the system/conditions will often be 180 – 200 F or more.
The localized heating will escape via radiation, conduction, and convection but it has a short term localized effect.
Think about it for a minute. If one can’t see the effect of these urban heat sources then they are an idiot.
see my post above…..I measured a 9F difference between a stopped traffic jam and open and free flowing traffic about a half mile further on.
Urban heat report # 2 (one day later and 2 hours earlier in the day but hazy and partly cloudy):
Now consider the paved/concrete surfaces and roof top surfaces. I measured it. It’s now 2:00 pm EDT, hazy and partly cloudy, and air temp is now 87 F and a 7 mph breeze. Last nights low ambient temp was 66 F. My blacktop driveway is now 147 F, the concrete walkway is 137 F, the hood of my vehicle is 179 F, and the grass is 98 F. This is some real-time data of passive urban heat.
Its amazing that nobody gets that record daily high temperatures is a better indicator of fewer greenhouse gases than more. https://www.space.com/14725-moon-temperature-lunar-days-night.html
Keep up the good fight, Anthony. Science self-corrects (eventually) — but only if scientists have the courage to point out the bullshit passing for “science”.
Caused by geoengineering
Nick Stokes is an experienced mathematical scientist with access to the large CSIRO research organisation. His scientific comments on WUWT are usually correct, or if doubtful, at least pertinent. WUWT is a blog that has much opinion and Nick tends to keep clear of opinion. Is it bad for a scientist to do that?
Nick has set up a blog at moyhu, see https://moyhu.blogspot.com/ I have visited there. Has anyone else?
If you seek to thrash out matters with Nick, you need to arm yourself with similar scientific artillery, because his blog is mostly to facilitate the presentation of official data, which is not a bad endeavour. How many WUWT bloggers have created blogs to match this? I have not, I am nearly 80, with health problems, but I have done quite a lot of calculation and deduction off blog (sometimes posting on Jo Nova’s, a couple of times on WUWT).
Where Nick has caused niggles, it is usually from his reluctance to call out doubtful or bad practices and opinions that need to be aired as a prelude to official correction. Maybe Nick does not want to be too involved in opinion. I do not either, but given the Establishment’s repression of dissenting opinion, I have to be. As do most bloggers here. We do not have a CSIRO behind us.
Anthony, my friend, please don’t be too harsh on Nick because he won’t easily join into the opinion game. You have done marvellous work with your dedication to the WUWT blog. You might find it fruitful to promote among your readers the need for a ‘sceptical’ blog to counter Nick’s mathematical moyhu blog. It is needed, but it is too much for you to take on, I guess.
The main pity is that Establishment figures, with their settled science attitudes, have tried so hard to downplay the efforts of citizens whose opinions challenge theirs. I’m tired of being treated like crap by our BOM. I hate disputes. Let’s try with a new, dedicated, global blog with only science to challenge theirs, as a complement to WUWT’s present efforts.
And Nick, you might consider keeping quiet when matters of bad science are raised, rather than taking portions of the topic for neutral comment, giving the impression that you are endorsing poor science. I do not think you would endorse poor science, but many WUWT readers might think you do. Geoff.
Bad stations are certainly a real thing. My impression of what is happening here between Anthony and Nick is something like this:
Anthony (and some other people) compared the results for all US stations with the results from only very good stations. They found a difference in the tend.
OK, fair enough. But that was a comparison against ALL stations, not just the ones that actually are used by most climate scientists. (please correct me if I’ve misunderstood that)
Then we get articles from Anthony pointing out bad stations.
When nick says “well, that station is ranked as a poor station and isn’t used or isn’t likely to be used in the records that most scientists actually use”
Which elicits an angry response claiming that Nick doesn’t care about measurement accuracy. Like this from the all time record temp for LA discussion: https://wattsupwiththat.com/2018/07/08/the-all-time-record-high-temperatures-for-los-angeles-are-the-result-of-a-faulty-weather-stations-and-should-be-disqualified/
Nick:
““then NASA GlSS etc”
The USC station is in GHCN Monthly because it is a long term record, and so it is recorded by GISS. Burbank has not been there since 1966. Van Nuyts, Santa Ana are not in GHCN-M at all. And GHCN is what climate scientists mostly use. GISS just passes along information from GHCN (except for their UHI treatment).
Anthony:
“So effing what Nick? The point is the DATA IS CORRUPTED AND BIASED. But you can’t bring yourself to admit that. You aren’t an honest researcher. Your own bias blinds you.
These stations get used in homogenization, and their errors collectively bias the entire climatic record upward.
Truly Nick doesn’t give a damn about accuracy in data collection. He’s a paid troll.
I’m really done with you. Go away.”
Well, my question is, what difference in trend is there between only ideal sites when compared to the sites that actually get used, rather that just comparing against all sites that get recorded? Does Nick have a point? Or are these bad sites widely enough used for calculations that make a significant difference to the reported trend, to really bias the record upwards?
Is the same difference in the trend between ideal sites and all sites still preset in the records that are actually used, that don’t use all sites?
“Yeah, but the media uses them!!”
Nick isn’t the media. He’s a scientist. He cares about what actually gets used to do science.
How can you prevent the media from being stupid? Refuse to collect information from sites that may be compromised? How are you going to study UHI if you do that?
Still waiting for Watts to put up his UHI paper for peer-review, which he promised he would do.
Fred,
Now’s an opportunity for you to ‘peer’ review the ones in this post. Here is another one you can include: USHCN temperature sensor at Napa State Hospital, Napa, CA. That one is in another WUWT post released today.
Stop waiting and tell us what you really think. Be a reviewer today. Do it NOW.
Anthony should keep up the posts about ridiculously sited weather stations used for official data. Is it really such a bad thing to raise people’s awareness about the issue? Would it be so bad to guilt the NWS into improving their station siting and data collecting quality?
Andy: Is there a weather station in Griffith Park, a 6+ square mile park in the middle of the LA basin? If I were looking for a well-site location in LA, it would be a good place to look.
FWIW, a record at a biased site IS a record – for THAT particular biased site. If jet wash temporarily effected a the Van Nuys reading, the same thing could have happened during any of several hundred unusually hot days in the last decade. It is CHANGING BIAS that makes new records meaningless: an expanded heat-absorbing runaway, more planes creating more chances to obtain a perturbed reading, etc.
I live 2 miles south of the Burbank Airport in a neighborhood of trees. I have my thermometer , old mercury style, nailed to the bark of my hundred foot Canary Island Pine, which is in the shade. It always runs one to three degrees under the Airport temperatures . The Airport is a guide. In winter time, I use my bird bath to see when it gets to freezing. I also compare the readings at the Weather Underground sites. Friday, July 6th, was very hot here. That was Texas heat. My Deodar Cedar tree even got burned needles, not to mention the Camellia leaves. The heat was truly devastating. The heat over 110 degrees lasted for many hours. The squirrels and birds were very uncomfortable. When the inside of my house got to 89 degrees, I turned on the centralized air. Usually, it cools off at night, so I don’t use the A/C much during the year. Sometimes I get the sea breeze through the Cahuenga pass to keep my area cooler. Burbank does have a number of micro climates.
I’m a little late to this discussion, but let me bring up a point or two… The siting of every one of these weather stations is BAD, like stinks on ice. I want to know how they compare to themselves in previous years? Taken one at a time, and comparing the siting to previous years, have any of the sites degraded? Are they even worse for recording temperatures then they were in previous years? Does UHI have a stabalization time? Does all that surrounding concrete get hotter and hotter over the years, even if it were to get exactly the same amount of solar insolation, with the same winds, year after year? So (and please don’t shoot me for saying this, Anthony) if the site has been constant, even though bad, for a number of years, can’t we say that each individual site has set a record for the day, at least? Maybe an all-time high for that station? I would certainly agree that none of these sites are fit for the purpose of proving that the entire Los Angeles Valley has set an “all-time high”, they clearly CAN’T show that since their siting is so bad. But if all else remains constant, and there are no idling ice-cream trucks around, doesn’t that reading stand as a record for that station?