Guest essay by David Archibald
We have only 300 years-odd of detailed solar observations with telescopes, half that of magnetic records, half again in the radio spectrum and less than that for most modern instrument records (and 12 years of Watts Up With That to interpret it). So as the months pass our knowledge of solar activity is still growing appreciably. The evidence points to a major transition of activity in 2006 which has returned us to the solar conditions of the 19th century. 19th century-type climate is expected to follow.

Figure 1: F10.7 Flux 1948 to 2018
We now have 70 years of F10.7 data. The F10.7 flux is considered to be the most accurate measure of solar activity. The solar cycles are numbered. Solar Cycle 24 has about two years to go before the month of minimum. To date the F10.7 flux has had a floor of 64.

Figure 2: Interplanetary Magnetic Field 1966 – 2018
The interplanetary magnetic field has been in a downtrend since the early 1980s with the last three solar minima lining up. If this trend continues then it will get down to a monthly average of 2.8 in 2020 at the 24/25 minimum.

Figure 3: aa Index Monthly Smooted 1868 – 2018
We now have 150 years of daily aa Index data. This is a geomagnetic index of the Sun’s magnetic activity. This graph explains why the world warmed in the second half of the 20th century. In the 67 years of data up to 1935, the Sun’s magnetic shield of the Earth averaged 15.7 on the aa Index. In the subsequent 71 years of the Modern Warm Period up to 2006, this shield was 50 per cent stronger, averaging 23.2 on the aa Index. Since 2006, the aa Index has been at Little Ice Age-like levels with an average of 15.8 and falling as we go further into the 24/25 solar minimum.

Figure 4: Average temperature along 59 N, 30-0W, 0-800m depth
This graph, from Professor Ole Humlum’s climate4you site, shows the Argo temeperature data of the area ccorresponding to the main part of the North Atlantic Current. The Argo floats were launched in 2004, just in time to capture the start of the temperature decline from the end of the Modern Warm Period in 2006. Where the temperature decline will stop is open to conjecture.

Figure 5: Alpha Particle to Proton Ratio in the Solar Wind
Another sign that the Sun is quieting down is the alpha particle to proton ratio in the solar wind which peaked in intensity in 1991. This ratio is now at a third of its peak with room for further decline into the 24/25 solar minimum.

Figure 6: Solar Wind Flow Pressure
This graph of the solar wind flow pressure confirms, for the period of the instrument record, the Sun was most active in 1991. Note that the second half of Solar Cycle 24 was far more active than the first half up to 2014, despite the declining F10.7 flux.

Figure 7: Oulu Neutron Count 1964 – 2018
The 1991 spike in the solar wind flow pressure resulted in a spike down in the cosmic ray flux at the Earth’s orbit as captured by this graph of the neutron flux data from the Oulu station in Finland. That was also the year of the Mt Pinatubo eruption, the cooling from which overwhelmed any solar signal in the temperature record.

Figure 8: Oulu Neutron Monitor Aligned on Month of Solar Minimum
The neutron flux is where the rubber meets the road in terms of the interaction of solar activity and climate. Cosmic rays are dominantly protons and helium atoms. They hit oxygen and nitrogen atoms in the upper atmosphere and cause a cascade of particles in the lower atmosphere which can be holding enough water for cloud droplet formation but lacks nucleation sites. The increased cloud cover during low solar acitivity increases the Earth’s albedo and the atmosphere cools.
Despite the solar wind and the aa Index being much stronger in the second half of the current solar cycle, the neutron flux is at a new high relative to previous cycles. The Oulu neutron flux is on track to reach 7,000 during solar minimum.

Figure 9: F10.7 Flux and Oulu Neutron Count 1964 – 2018
The Oulu neutron flux also illustrated the end of the Modern Warm Period in 2006. This figure shows it inverted against the F10.7 flux. The transition from the Modern Warm Period did not wait for the end of Solar Cycle 23 in 2008, the neutron flux shows an abrupt change to a lower level of activity in 2006.

Figure 10: Solar Polar Field Strength Aligned on Minimum
The strength of the next solar cycle can be determined by the solar polar field strength at solar minimum. That is tracking for Solar Cycle 25 to be much the same as the amplitude of Solar Cycle 24. This is a return to the solar conditions that characterised the 19th century.
David Archibald is the author of American Gripen: The Solution to the F-35 Nightmare
Discover more from Watts Up With That?
Subscribe to get the latest posts sent to your email.
During periods of low solar activity, the amount of ozone in the lower stratosphere increases at high geomagnetic latitudes.

In the north it is more complicated because there are two geomagnetic centers.
http://www.geomag.nrcan.gc.ca/images/field/fnor.gif
The center over Canada causes stratospheric intrusions over North America in the winter.
By my count this article has 10 figures, 9 of which are offered without attribution or citation.
This makes a difference to me because I like to blog about science topics to a general audience in a way that encourages the reader to examine the evidence for themselves. As it is this article is of little use to me.
Your comment is of zero use to anyone here. The above graphs are his own works. He posts attribution as to source of data used to construct his graphs on each graph as can be clearly seen. You must have over looked that.
A label such as “Figure 1: F10.7 Flux 1948 to 2018” a) isn’t a citation or reference to the source of the data and b) does little to encourage the reader to examine the evidence for themselves.
It’s not even clear that the author constructions his own graphs – cutting and pasting of images being such a common practice.
A reference to website which graphs the raw data such climate4you.com or NASA would be preferred.
In my opinion this type of article “preaches to the choir” but is not fit, by my standard, for convincing the average citizen indoctrinated by AGW orthodoxy.
On your last point there isn’t much that would change the minds of those who believe in AGW, except for a moderate to steep drop over a prolonged period of time. Which is what we are about to see over the next 15 years, imo.
Based on our current Milanchovitch-oceanic-atmospheric teleconnected status, I predict we will remain warm and possibly be even warmer. Good. Paleo-investigations clearly show that warm periods benefit all flora and fauna, including humans. Solar variation need not apply. Why? Its metrics so far have shown to be inferior to Milanchovitch cycles interacting with a very dynamic Earth.
Nuff said.
You seriously believe that solar variation doesn’t affect climate? Remarkable.
I assume you’re aware that Milankovitch cycles work on time frames much longer than solar maxima and minima.
Do you really imagine that low solar activity during the decades of cool intervals, such as the Maunder and Dalton Minima, and high solar activity during warm decades, such as the peaks of the Medieval WP, is purely coincidental?
What is “solar variation”? Pick the F10 (10 cm) signal cited above, a radio wave carrying negligible power. What does this metric tell us about solar variation that is relevant to the net radiation flux into our planet? I think the answer is absolutely nothing, but the people who cite it believe it is a proxy for a solar phenomena that does effect the Earth’s climate. Great. Show me a graph for the causative solar phenomena and temperature!
TSI (total solar irradiation) directly changes incoming solar radiation. Since we have been measuring TSI, its variations have been to small to have changed our climate.
Sunspots are cooler regions on the sun’s surface that emit more high-energy particles into the solar wind. The TSI increase with sunspot number is about 0.1% (peak to trough) and the variation between cycles is smaller.
The only viable hypothesis I know of claims that variation in the solar magnetic field in the vicinity of Earth changes cosmic rays which changes cloudiness. See any clear measures of these phenomena above?
Felis asks: “Do you really imagine that low solar activity during the decades of cool intervals, such as the Maunder and Dalton Minima, and high solar activity during warm decades, such as the peaks of the Medieval WP, is purely coincidental?
The only records that go back that far are SSN and cosmogenic isotopes. Cycle 59 (1950) was a great decade for sunspots, but a decade of cooling. Leads one ask how important sunspots can be.
Is it pure coincidence? Who knows? This is a question for the scientific method. “Gut hypotheses” may feel like real science, but they mean little without experimental testing.
Solar leads to cooling when very weak and it is going to do so from year 2018 and beyond.
Solar forcing from Milankovic (correct spelling !) cycle is on downturn, don’t expect any warming from there in the next 20-40ky +.

There is no “downturn” that can be witnessed by man in a lifetime. 20,000 – 40,000 years between cycles, so those points of turn take at least 100s of years. Anyone who thinks they can see these happening within years or a decade are fooling themselves.
Alley I like your approach I think you are fair but let me set the record straight if I could.
If you look at my website climatebusters.org which I did 5 years ago or so and look at the overview page, you will find the following:
I list the low average value solar parameters I think are needed to cause global
cooling following x years of sub solar activity in general(changed it shortly after to 10+years). Then it says IF these low solar parameters ARE THE RULE going forward for the remainder of this decade expect global cooling.
The problem or reality is the low average value solar parameters that I called for necessary to cause global cooling did not even come close to being realized until very late year 2017.
So according to what I said I would not expect global cooling because the low average
value solar parameters which I said are necessary for cooling did not come about until late 2017.
By the same token now that the two solar conditions I stated are necessary for cooling have arrived that I had called for, I am expecting global cooling with year 2018 being the transitional year and cooling thereafter. I put myself on the line and I also said if it does not happen now I will be WRONG. No excuses.
For GOLDMINOR my theory is DIFFERENT from all others in the following ways.
1. I list specific low average value solar parameters necessary for cooling.
2. I list number the of years needed for sub solar activity in general necessary for cooling.
3. I am just one of the few that states that when the geo magnetic field is in sync with solar like it is now it will compound given solar effects.
4. I am one of a few that says there is a solar /explosive volcanic connection and a galactic cosmic ray /cloud coverage connection to mention UV light overall oceanic sea surface temperature connection.
5. I have the confidence to say 2018 is a transitional year to cooling. Who else has?
I was going by what you had written in 2010.
It does matter that you expect 2018 to be the turning point. It would have to cause whiplash and do so soon, because 2018 is shaping up to be another top-5 warm year.
Fair enough. You do tend to evolve in this as you do it to some extent. It is kind of hard to stay exactly the same as the years go by. You do learn as you study the subject. That said my main theme is pretty much the same.
According to satellite data we are much cooler then a year ago. Dr. Spencer’s data. In addition overall sea surface temperatures are lower and still trending lower. Off around .2c from a year ago.
I think the nearest winter in the northern hemisphere will give us an answer as to how low solar activity affects the temperature on the Earth’s surface.
ren, nearest Winters are meaningless when the topic is global climate. You are speaking of a season. Even a year is not enough, but much better than what happens when the earth is closer to the sun, and at the same time the largest percent of land mass is tiled away.
Makes no sense to look at this cherry pick. Besides, this prediction and others like it have been failing for the past few decades. There already was a cooler year than the last, but only because we set three successive warm records.
Watch the man walking the dog, not the dog.
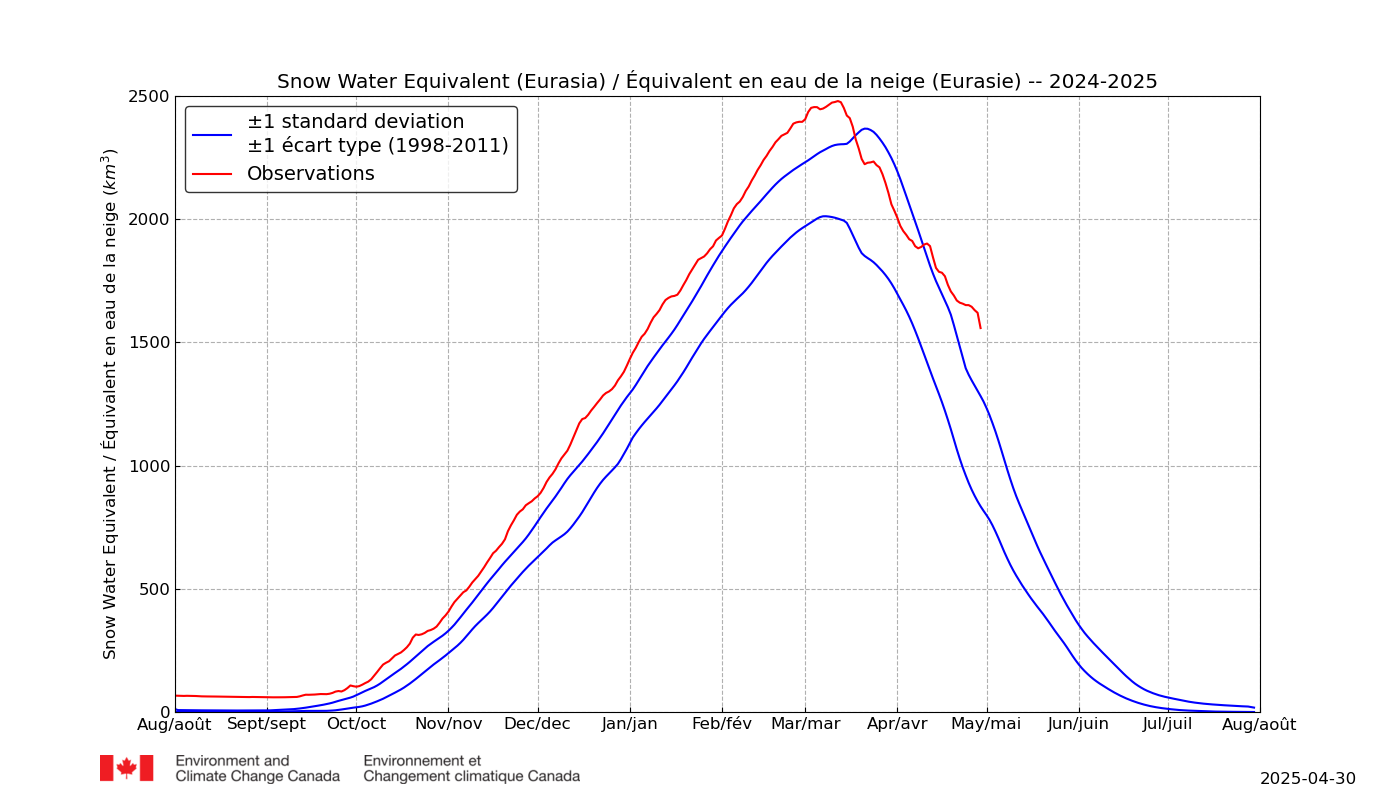
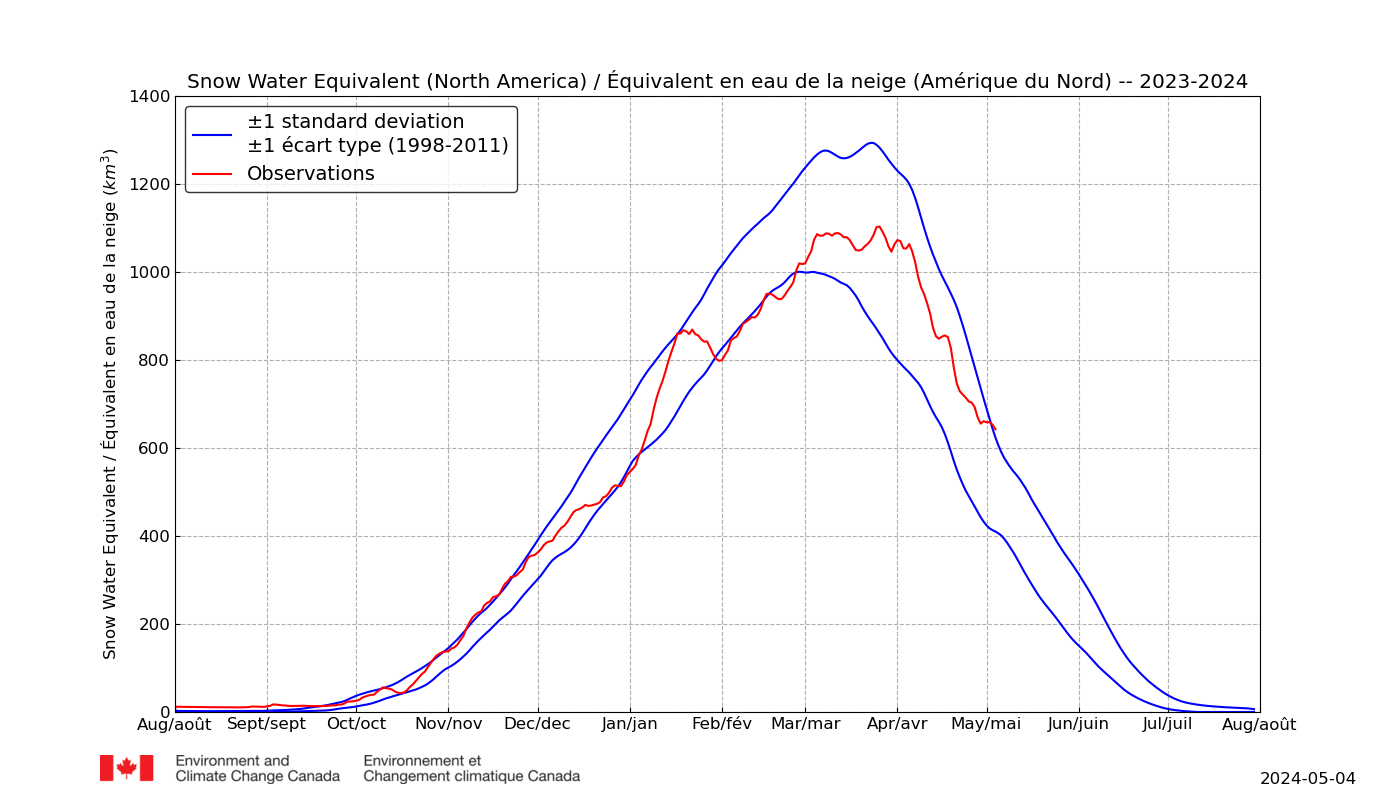
These plots present time series (updated daily) of the current amount of water stored by the seasonal snowpack (cubic km) over (a) Northern Hemisphere land areas (excluding Greenland).
Alley, the previous winter, however, distinguished itself in terms of the amount of snow.
We’ll know more when we get a few more decades of data. Only in the last 10 years has the polar vortex phenomenon been making news. Higher snow amounts and record-breaking cold in the storm tracks of the Eastern US and Western Europe etc. are expected with a warming planet. On either side of the storm tracks the climate is somewhat warmer and dryer, so the total averages gently trend upward.
We have to remember that we’re looking at a small snapshot in time and at an interesting continental set up in the northern hemisphere
aligned favorably with the Arctic air, Arctic Jet and Polar Jet and that the warming has so far been slight, so the changes likewise have been slight.
Higher snow amounts and record-breaking cold in the storm tracks of the Eastern US and Western Europe etc. are expected with a warming planet.–end quote
Flashback 2000: ‘Snowfalls are now just a thing of the past’: According to Dr David Viner, a senior research scientist at the climatic research unit (CRU) of the University of East Anglia,within a few years winter snowfall will become ‘a very rare and exciting event. Children just aren’t going to know what snow is.’ …
Warmer winters have significant environmental and economic implications, and a wide range of research indicates that pests and plant diseases, usually killed back by sharp frosts, are likely to flourish.
http://www.climatedepot.com/2018/01/04/flashback-2000-snowfalls-are-now-just-a-thing-of-the-past-children-just-arent-going-to-know-what-snow-is-uk-independent/
(Unfortunately for warmists, the internet doesn’t forget.)
Top: The total daily contribution to the surface mass balance from the entire ice sheet (blue line, Gt/day). Bottom: The accumulated surface mass balance from September 1st to now (blue line, Gt) and the season 2011-12 (red) which had very high summer melt in Greenland. For comparison, the mean curve from the period 1981-2010 is shown (dark grey).
http://www.dmi.dk/uploads/tx_dmidatastore/webservice/b/m/s/d/e/accumulatedsmb.png
Alley …ren is saying that this next winter should show what effect a solar minimum has on temps. That is a valid point, imo. I expect to see global temps drop below the zero trend line as seen on UAH over the next 2 years as a result of the current solar minimum.
SdP …to your #4, I discussed the connection between Iceland volcanoes and other volcanoes and solar back in Sept 2014 when Bárðarbunga erupted. At the time I also posted similar thoughts on an Icelandic blog site only to hear back from some of the Icelandic vulcanologists that they also knew about that.
To your #5… I stated back in early 2014 that 2018 would be the beginning of the shift to cooler conditions.
Yes we are more or less on the same page.
None of us who favor solar and are anti AGW are going to agree on everything, but we are all pretty close when you come right down to it.
Vukevic, since Milankovic/Milankovitch was Serbian, is not the only correct spelling rendered in Cyrillic? Perhaps the Croats would spell it Milankovic, but the Latin alphabet is somewhat variable in its pronunciation depending on the language that has adopted it, and other transliterations are just as valid for those languages. Cheers!
I´m no expert, just exposing some facts known to me.
In the south hemisphere, at about 33 deg. in the year 1975 there was a very cold winter with massive snow fall where there was none in the previous years. It is clear from Fig. 1 that year 1975 was after a weak solar cycle (N° 21). This year, 2018, there was a similar cold winter and I see from Fig. 1 that we are at a similar situation, ie. after a weak solar cycle (N° 24).
+Marc, indeed, SC24 has been even weaker than the weak cycle that peaked about 1970. But if warmists admit that a weak cycle has a cooling effect, then they will also have to admit that strong cycles have warming effects, and that would not leave much for CO2 to explain, and thus is dashed their dream of transitioning from national democracy to unaccountable institutions of “global governance” as Al Gore has named it.
David: All of these measures of “solar activity” aren’t organized by a mechanism by which they might be meaningful to climate
The only “solar activity” that we are sure can effect the climate is TSI (W/m2). This post doesn’t discuss TSI, but it is generally accepted that observed changes in TSI are about 1 W/m2 (0.25 W/m2 as a solar forcing or about 0.1% and likely too small to be of consequence. The biggest change in TSI occurs at UV wavelengths that are absorbed by the stratosphere.
The only other viable hypothesis I know of is that the strength of the sun’s magnetic field shields the Earth from cosmic rays that provide nuclei of cloud condensation and therefore increase the planet’s albedo. In that case, I’d expect to see data on 1) planetary albedo, 2) cosmic rays, and 3) the solar magnetic field. Only the second graph (with units of nanotesla) appears to refer to the solar magnetic field.
The aa Index is allegedly a measure of a magnetic field strength, but it appears to be very uncorrelated with the second graph.
The remaining graphs are measures of solar activity, but not clearly ones that have anything to do with the strength of the solar magnetic field near the Earth. Some appear to be proxies for the solar wind, but I’m not sure that any mechanism links the solar wind to climate since those particles don’t penetrate to altitudes involved in climate.
If any measure is supposed to be a proxy for the solar magnetic field/cosmic rays/albedo hypothesis, it would be nice to see the proxy plotted vs one of these three parameters. With noisy measures of “solar activity”, one can likely find some apparent correlation with climate, but correlations are dubious without a mechanism.
You might want to reconsider some of your labels: There might have been a 1950-1975 cool period – but not a “1970’s cooling period” (Figure 2) – that ended in the 1970’s that included solar cycle #19, one of the strongest on record. Likewise, no one I know believes the LIA lasted until 1935 as shown in Figure 3.
Although you are correct that the late 20th century warming trend started in 1976, that was initially unclear and those early years (the late 70’s) did not seem to be a lot different from the early seventies. Some of us can remember.
There is an interesting aspect of solar data, the Ap and Kp data, which do appear to have a very close relationship with climate variation – short term at least.
We have only been recording ‘Ap’ Data since 1932 but an analysis of what we know ‘so far’ throws up some interesting info. An outline breakdown can be found here – https://howtheatmosphereworks.wordpress.com/ap-index-historical-analysis/
The relationship between Ap and Climate is discussed here –
https://howtheatmosphereworks.wordpress.com/solar-activity-and-surface-climate/
Be interested if anybody has any useful additions to that data.
I think that’s the most important thing:
“This response may be viewed as similar in nature to the activity of ocean tides, where a very slight change in gravity causes a slight bulge in the ocean but often massive tidal response at sensitive coastal areas; so the incoming solar energy causes a slight bulge in the upper atmosphere, resulting in significant movement at sensitive points in the atmospheric profile, with the consequent response in surface level weather patterns.”
http://www.icecap.us/images/uploads/Solar_Changes_and_the_Climate.pdf
This goes into it also .
The article you sent on AP index and the climate is great.
My studies concluded an AP index 5 or less sustained for a period of time will impact the climate in a more obvious way. The lower the AP index the colder the climate.
A case can also be made for a very low AP index with isolated spikes being tied to explosive volcanic activity due to galactic cosmic rays bombarding the calderas of these kind of volcanos.
There’s an aspect which may invite further study; if overall Ap activity is low, contracting atmospheric structure, concentrating thermal bands equatorward, until an incoming Ap burst causes short term, patchy, expansion in the equatorial belt (effectively the Hadley cell), this will push local surface activity poleward. This may drag equatorial – hot – atmosphere poleward, both giving the impression of warming, where overall cooling may be a more accurate interpretation. Entropic radiation will then dissipate that thermal energy exacerbating the overall geo-heat loss and cooling.
Ap interaction with geomagnetic activity may also have its effect in volcanic activity, which may also go some way to explaining the apparent relationship between solar and geo-volcanic behaviour – with its often forecast results.
That sounds very much like what I have been observing of late as I save the daily earthnull pics. For example, note the surface winds moving northeast across the Indian Ocean. This pattern has been running strong for many months now. The result has been to push warm air masses north into Eastern Siberia. That is of great interest as I had noted about 5 years ago that when the NH gets hit by gsm cooling, the eastern region of Siberia experiences warming. Then others affirmed that this was correct when I made a comment regarding what I had seen. Guess what has been taking place in eastern Siberia over the last 5 months. Note the strong surface wind flows crossing the Indian Ocean, and the temps in Eastern Siberia. …https://earth.nullschool.net/#current/wind/surface/level/overlay=temp/orthographic=91.50,34.98,672/loc=90.351,15.322
As I have said this year could be the transitional year. Not many are calling for this and so far this year is cooperating. Both overall sea surface temperatures and global temperatures are lower in comparison to last year.
One misconception that many have is the climate when it changes does not change slow and gradually. Climate transitions can take place in a decade or less and Ice Core data backs this up time and time again.
My two solar conditions are now in and only time is going to show how long and deep this new down trend in global temperature will be.
If the down turn continues I will be on very firm ground because I called for the down turn BEFORE it happened in addition to giving the reasons why and how.
Of course there will detractors which is always the case . They will be on the outside looking in. That was a song title by Little Anthony and Imperials around 1961 or so. I have about 30,000 records from back then. I am getting off topic.
In closing the only thing I care about is being correct.
Another day goes by with the oceanic surface temperatures and global temperatures continuing the down trend. Looking good.