Guest essay by David Archibald
We have only 300 years-odd of detailed solar observations with telescopes, half that of magnetic records, half again in the radio spectrum and less than that for most modern instrument records (and 12 years of Watts Up With That to interpret it). So as the months pass our knowledge of solar activity is still growing appreciably. The evidence points to a major transition of activity in 2006 which has returned us to the solar conditions of the 19th century. 19th century-type climate is expected to follow.

Figure 1: F10.7 Flux 1948 to 2018
We now have 70 years of F10.7 data. The F10.7 flux is considered to be the most accurate measure of solar activity. The solar cycles are numbered. Solar Cycle 24 has about two years to go before the month of minimum. To date the F10.7 flux has had a floor of 64.

Figure 2: Interplanetary Magnetic Field 1966 – 2018
The interplanetary magnetic field has been in a downtrend since the early 1980s with the last three solar minima lining up. If this trend continues then it will get down to a monthly average of 2.8 in 2020 at the 24/25 minimum.

Figure 3: aa Index Monthly Smooted 1868 – 2018
We now have 150 years of daily aa Index data. This is a geomagnetic index of the Sun’s magnetic activity. This graph explains why the world warmed in the second half of the 20th century. In the 67 years of data up to 1935, the Sun’s magnetic shield of the Earth averaged 15.7 on the aa Index. In the subsequent 71 years of the Modern Warm Period up to 2006, this shield was 50 per cent stronger, averaging 23.2 on the aa Index. Since 2006, the aa Index has been at Little Ice Age-like levels with an average of 15.8 and falling as we go further into the 24/25 solar minimum.

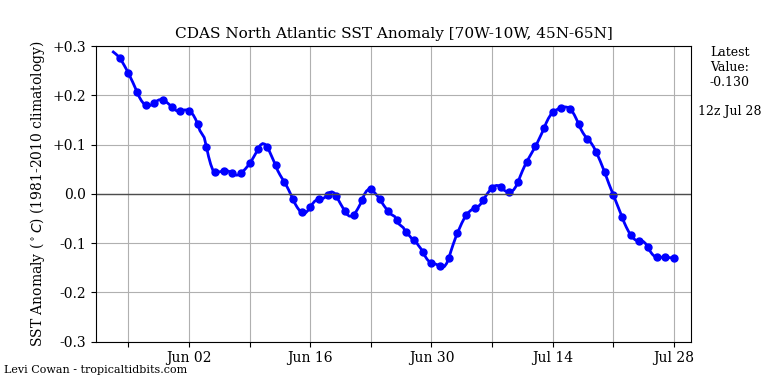
Figure 4: Average temperature along 59 N, 30-0W, 0-800m depth
This graph, from Professor Ole Humlum’s climate4you site, shows the Argo temeperature data of the area ccorresponding to the main part of the North Atlantic Current. The Argo floats were launched in 2004, just in time to capture the start of the temperature decline from the end of the Modern Warm Period in 2006. Where the temperature decline will stop is open to conjecture.

Figure 5: Alpha Particle to Proton Ratio in the Solar Wind
Another sign that the Sun is quieting down is the alpha particle to proton ratio in the solar wind which peaked in intensity in 1991. This ratio is now at a third of its peak with room for further decline into the 24/25 solar minimum.

Figure 6: Solar Wind Flow Pressure
This graph of the solar wind flow pressure confirms, for the period of the instrument record, the Sun was most active in 1991. Note that the second half of Solar Cycle 24 was far more active than the first half up to 2014, despite the declining F10.7 flux.

Figure 7: Oulu Neutron Count 1964 – 2018
The 1991 spike in the solar wind flow pressure resulted in a spike down in the cosmic ray flux at the Earth’s orbit as captured by this graph of the neutron flux data from the Oulu station in Finland. That was also the year of the Mt Pinatubo eruption, the cooling from which overwhelmed any solar signal in the temperature record.

Figure 8: Oulu Neutron Monitor Aligned on Month of Solar Minimum
The neutron flux is where the rubber meets the road in terms of the interaction of solar activity and climate. Cosmic rays are dominantly protons and helium atoms. They hit oxygen and nitrogen atoms in the upper atmosphere and cause a cascade of particles in the lower atmosphere which can be holding enough water for cloud droplet formation but lacks nucleation sites. The increased cloud cover during low solar acitivity increases the Earth’s albedo and the atmosphere cools.
Despite the solar wind and the aa Index being much stronger in the second half of the current solar cycle, the neutron flux is at a new high relative to previous cycles. The Oulu neutron flux is on track to reach 7,000 during solar minimum.

Figure 9: F10.7 Flux and Oulu Neutron Count 1964 – 2018
The Oulu neutron flux also illustrated the end of the Modern Warm Period in 2006. This figure shows it inverted against the F10.7 flux. The transition from the Modern Warm Period did not wait for the end of Solar Cycle 23 in 2008, the neutron flux shows an abrupt change to a lower level of activity in 2006.

Figure 10: Solar Polar Field Strength Aligned on Minimum
The strength of the next solar cycle can be determined by the solar polar field strength at solar minimum. That is tracking for Solar Cycle 25 to be much the same as the amplitude of Solar Cycle 24. This is a return to the solar conditions that characterised the 19th century.
David Archibald is the author of American Gripen: The Solution to the F-35 Nightmare
“A return to 19th century type climate” … only if we return to 19th century type scientific scrutiny.
(And that can be read two ways)
“There is nothing new to be discovered in physics now, All that remains is more and more precise measurement.” – Lord Kelvin
That was the scientist who thought that the sun was ‘powered’ by combustion! Nothing new to be learned indeed!
He also thought we’d burn up all the world’s oxygen within 500 years, burning fuel at the 19th century rate. I’d hate to think what that would mean at today’s rate.
Didn’t he date the Earth as being several thousands of years old based on the internal heat of the planet allowing one to literally believe in the Bible? Not knowing about nuclear energy and all.
Well, nice to live in the modern era where the science is settled.
No. He dated it to be tens of millions of years old, rather than billions.
So between the Bible and reality.
He said that’s how old it is, unless a new source of heat be discovered. He lived long enough to witness the discovery of radioactivity. Indeed he was in the audience when transmutation of the elements was first used to date a portion of the Earth.
Although the facts of the case differ slightly from the story as traditionally told:
https://www.3quarksdaily.com/3quarksdaily/2014/01/kelvin-rutherford-and-the-age-of-the-earth-i-the-myth.html
Solar activity was going up gradually (point or two at the time) in the last three months. Sunspot cycle 24 number in June in the old score (Wolf SSN) rose from approx 9 in May to 11 points while the new SIDC reconstructed number is at 15.9
Composite graph is here .
The SC24 is nearing what might be the start of a prolong minimum (with a possible late start of SC25 too) but even a ‘dead cat bounce’ from these levels appears to be unlikely.
David Archibald
“Figure 3: aa Index Monthly Smooted 1868 – 2018” ?? Smoothed ?
The “Smoot” is a unit of measure that is approved by the NBS. See:
en.wikipedia.org/wiki/Smoot
And the length of the Harvard Bridge is 364.4 Smoots +/- 1 ear.
…walked that bridge many times and have refurbished the paint as well.
That guy is my, I believe, second/third cousin twice/once removed. The Smoot(e) family is filled with over-achievers, crazy people, and giants… I fit right in.
Cousin-ship is defined quite definitely, but not as you have indicated. If you and he have your great grandparent in common, then he is your 2nd cousin (twice removed?). From his point of view though, you could be his 4th cousin (twice removed?).
Am I correct that you’re referring to Lord Kelvin? If so, then more likely, for him, you are better described as his great nephew.
If the common ancestor is your great-great grandfather, then it’s 3rd-once removed and 2nd-once removed from his point of view. (The ‘removed’ refers to how many generations off dead even separate you(s), which is not completely clear from your description.)
I trust that this makes the relationships as clear as mud.
“Figure 3: aa Index Monthly Smooted 1868 – 2018” I think “smoothed”. But good post.
A smoot is equal to 67 inches or 0.803357 ken. [gotta love that convertpad app on my phone. the units you can discover!]
In an age of modern instruments worldwide instead of garbage proxies, we are going to learn if solar cycles have any impact on climate at all. Oh the climate was this or that during the last low therefore it must occur again, is a theory, not a prediction. I would speculate the climate won’t be remotely the same as the 1800’s and this theory is going to drop dead.
Scientists predict milder winters in Britain and an end to Europe’s ski industry
Guardian, Jan 2001
Sunspots reaching 1,000-year high
BBC, July 2004
Is Mild Winter a Sign of Climate Change?
NPR, Jan 2007
Quiet sun puts Europe on ice
New Scientist, May 2010
Scientists: Don’t make “extreme cold” centerpiece of global warming argument
WaPo, Feb 2014
Cold winters have been caused by global warming: new research
Telegraph UK, Oct 2014
Why global warming does not necessarily result in warmer winters
Economist, Mar 2015
Global warming will make winters in Britain even COLDER
Sun UK, Oct 2016
Climate change could make summers hotter and winters milder
SanDiegoTribune, Jan 2017
Is It Okay to Enjoy the Warm Winters of Climate Change?
Atlantic, Feb 2017
A warming Arctic can actually make our winters colder
Popular Mechanics, Sep 2017
Climate change at work? Weather Service calls for third straight mild winter.
WaPo, Oct 2017
It’s cold outside. But that doesn’t mean climate change isn’t real.
USA Today, Dec 2017
Big snowfall, a cooler ocean and, yet, more signs of global warming
NBC, Jan 2018
Why climate change may be to blame for dangerous cold blanketing eastern U.S.
NBC, Jan 2018
Q&A: What does all this snow mean for climate change?
Guardian, Feb 2018
Why a Warming Arctic May Be Causing Colder U.S. Winters
NatGeo, Mar 2018
British farmers in turmoil as delayed spring plays havoc with growing season
-Guardian, April 15, 2018
It’s the coldest and snowiest April on record near the Great Lakes, and residents are ‘fuming’
-WaPo April 18, 2018
World wine output falls to 60-year low
Reuters, April 24, 2018
(frost and storms to blame)
The Midwest and Great Lakes just endured a historically cold April
-WaPo, May 1, 2018
July 3rd (2018) brings Wildly Wintry Montana Summer:
I have to admit that yesterday was the first summer like day. My house heater has been on every night so far this “summer”.
Been very cool and rainy all of June and bears are still wandering around the lowlands instead of moving up into the mountains.
Interesting times here in the Flathead Valley.
The Eastern US has had a cool and prolonged spring
Please ship some of that to Texas
Southern hemisphere (from friends and family at about 33 deg. south) the same situation. A very cold and long winter.
Which continent?
My wife in Chile at about that latitude is suffering, for them, a cold winter.
It has been cold down south for months as of now. The main wind pattern is one that pushes cold air and surface waters north up the coast, and that started 16 months ago. What you see in this view is a recent break from that pattern, which developed in the last 48 hours. …
https://earth.nullschool.net/#current/wind/surface/level/overlay=temp/orthographic=-75.82,-39.13,672/loc=-85.480,-40.647
Thanks!
My job means dealing with the HR teams around the world. I was talking with the South African HR team last week and they were saying that the cold temperatures in Durban were the lowest ever and they were talking about the snow in Capetown
They say that the waves are getting stronger but it doesn’t cool or warm the planet – because the warm parts are getting larger and so are the cool parts.
Dan Briggs – the summer ridge has finally reached you. The seasonal turnover has been delayed. By what? It’s probably the shrinking planetary wave number in the big picture.
Good news, it can’t get much smaller. (famous last words….because down here on the border we’ve gone from 12 inches of rain to 6 in the 1990s and now down to 3 for many years. It can’t get much worse here.)
I suspect that it will be quite some time before climate similar to the 1800s is seen again even if solar input remains at 1800s levels. First the world ocean must cool back to 1800s levels, and that could take awhile considering it has over a century of high solar activity warmth input.
And 3, 2, 1…..Cue Leif to say otherwise.
If I were Leif I’d be sick and tired of refuting the same bs over and over again. I guess he has more patience…
There is no BS in the article. Just data and opinion on future climate. I guess that is offensive to some.
“In this article”. Thats fair enough.
“This graph explains why the world warmed in the second half of the 20th century.“
Opinion. No mechanism.
Opinion that I do not share.
But you said
“There is no BS in the article. Just data and opinion on future climate.”
err no
““This graph explains why the world warmed in the second half of the 20th century.“
second half of the 20th century aint the future.
We have actually a pretty good idea what F10.7 [and the EUV] has been since the 1740s:
http://www.leif.org/research/F107-EUV-since-1740s.png
This is from http://www.leif.org/research/EUV-Magnetic-Field.pdf
Thanks.
Predictable I guess that the baseline low would change little, while peak EUV can vary quite a bit.
Peak EUV simply follows the sunspot number: many spots=high EUV
As is evident in your reconstruction, as for instance during the Maunder Minimum.
10 graphs, each showing why temperatures should have been falling and taken together falling hard. But instead they are rising.
Anyone find that at all odd? Could it be some other factor is…um, never mind.
Well it could be the temperatures are not actually ‘rising’ but the level of data fiddling is….. until you look at the satellite record.
The data “fiddling” COOLS THE RECORD.
ps, satellites have much more fiddling, waaaay more fiddling
and again I remind you Mosh that the data fiddling is required to cool the record only confirms that it needs to be fiddled cos its literally overheated from UHI effects.
The satellite data is not a direct temperature like a thermometer (electronic or conventional fluid type) and needs mathematical processing to turn the raw signal into a temperature.
Not all that unusually, when you look at sub sets of surface thermometers where UHI effect has been eliminated by proper siting, the temperature trend is fundamentally different (flatter or even slight cooling depending on the area). Cities can have UHI effects in the 5-10˚ range and even local anomalies close to sensors can provide several degrees of false reading.
.
Dunce. the COOLING happens in the ocean datasets.
Do you believe in UHI under the sea
maybe in a pinapple under the sea
PS.. no UHI in the land record either
Mosh If you dont believe in the UAH satellite record, that would be saying that if there ever was CAGW, you believe that Christy and Spencer would be intentionally telling us that everything was all right while the earth would be drowning in rising sea levels and people would be keeling over in the streets from global heat hell. Is that what you expect us to believe ? When the temperatures start to go down in the next 5 years in their satellite record you will be criticizing their data as bunk and instead saying that the fudged land data is the true temperature. Are we skeptics that stupid?
Mosh If you dont believe in the UAH satellite record, that would be saying that if there ever was CAGW, you believe that Christy and Spencer would be intentionally telling us that everything was all right while the earth would be drowning in rising sea levels and people would be keeling over in the streets from global heat hell. Is that what you expect us to believe ? When the temperatures start to go down in the next 5 years in their satellite record you will be criticizing their data as bunk and instead saying that the fudged land data is the true temperature. Are we skeptics that stupid?”
1. Note I never said i dont believe in their record. RATHER, their record
has MASSIVE adjustments over time that skeptics ignore. Specifically,
when Karl does a new series that actually cools the long term record, and slightly warms the current years, skeptics all scream about the past being changed. And when RSS makes changes, you all scream about the
science being not settled. However, when UAH makes changes due to deciding to do different adjustments, you all ignore this fact. You ignore what is MEANS in terms of structural uncertainty. Most of you dont even understand structural uncertainty.
So here is just ONE example that none of you can even discuss
https://moyhu.blogspot.com/2018/01/satellite-temperatures-are-adjusted.html
2. Their record, Like the RSS record, has been changed dramatically over the years. And not just slight changes but positive to negative changes.
Now, RSS try to establish uncertainty ranges by doing ensembles.
That is, whenever you decide to adjust you make assumptions: RSS does, UAH does. The next step is to TEST the assumptions by doing sensitivity tests, an ensemble. This tells you the uncertainty DUE TO analyst assumptions. For satellite records they are huge. I can tell you some of the assumptions. Do you know them? No. Similarly in land and ocean record we assess structural uncertainty by have several analysts using differrent data and different methods on the same problem. The structural uncertainty of satellites dwarfs the land and sea record.
So its not a question of “not believing’ in them. its a question of Relative strength ALL THINGS CONSIDERED.
3. What do I expect you to do? Nothing. It would be great if you praticed consistency.
why would you need to cool the Argo data? Or are you talking about the old data gathered from buckets?
“Komrade Kuma
The satellite data is not a direct temperature like a thermometer (electronic or conventional fluid type) and needs mathematical processing to turn the raw signal into a temperature.”
Nothing measures temperature directly, not even a glass mercury/alcohol thermometer.
Technically correct I suppose but the ‘reading’ you get is temperature not fluid density so its a bloody sight more direct than raw satelite data or even ‘adjusted’ global/regional temperatures.
The data “fiddling” COOLS THE RECORD.
“In the Climategate emails, Wigley also noted
Land warming since 1980 has been twice the ocean warming—and skeptics might claim that this proves that urban warming is real and important.
Wigley58 even went so far as to suggest that sea surface temperatures for the period should likewise be “corrected” downward by 0.15°C, making the 20th-century warming trend look greater but still plausible. This is obvious data doctoring.”
One of the sad side effects of the data doctoring by Zeke and Mosher is that there is a known amount of past energy that they cannot change the records on.
Hence their magic wand that takes their land temperature adjustments and shoves it into their historical sea data.
All made up.
Allowing Mosher [and Zeke] his favorite rhetorical line
The data “fiddling” COOLS THE RECORD.
–
One thing to comment on is the amount of interest that warmists develop when challenging articles hit the spot.To see Nick and Mosher, and ATTP over at Judith’s protesting like crazy means they know they are in trouble.
Some of the warped logic defending Hansen makes one cry.
Whereas the above just makes one laugh.
Ah Zeke
“Zeke Hausfather says: February 9, 2015 at 3:54 pm
Ironically enough, the net effect of adjustments on global temperatures (not land-only) is to reduce the trend bias, as the pre-1940 upward adjustments to SST are larger than the (mostly pre-1940s) downward adjustment of land temperatures from homogenization. I really need to get around to putting together an adjusted vs. raw land/ocean figure at some point…”
except the corrections wigly suggests are not made.
The ocean 70% of the globe is cooled and for a very specific field tested reason
“The ocean 70% of the globe is cooled and for a very specific field tested reason”
WR: How is the ocean cooled, the SST or the deep ocean? And for what very specific field tested reason?
anyone that thinks we have any clue what past ocean temperatures were to the accuracy required for the claims being made is naive in the extreme.zettajoules my arse (please excuse the profanity, i have trouble articulating how stupid some of these notions are).
They fiddle-cooled the mid 30s-40s, that’s for sure and heated up the following 40 year cooling period that had scientists worrying about a new ice age at the time. WUWT? They couldnt have a more rapid warming in the record before CO2 could be a factor nor a drop into a frigid cold period with rising CO2.
I was born in the late 30s and family and friends talked about this period’s heat for decades afterwards. Moreover I was a newspaper boy in the 50s in Winnipeg and when I went to collect payment for the papers on winter evenings, my mother insisted on walking with me because of the bitterest cold winters in her memory. These have all been egregiously adjusted.
Worse, they are still being adjusted! As Mark Steyn noted in a Senate Committee hearing on climate data fiddling, “How can you be so sure what the temperatures will be in 2100 when we dont know what they will be in 1950!”
There is another factor, it’s called El Nino.
How dare you, there is no other factor beyond the human made C of the O of the 2!!!! All hail the mighty C of the O of the 2 and all its’ wondrous and terrible works!! mostly terrible… worse than we thought…. much much worse of course!! 🙂
just in case it is required.. /sarc!
Cheers!
Joe
Joe do you dare mock the CO2?
EL nino and La Nina cancel.
always have, always will, because internal cycles cannot create energy.
To see the UN IMPORTANCE of El nino, merely select all the La Nina periods
Plot the trend
gues what
ITS WARMING!
There was an LIA
Steven,
Thanks for remaining civil and engaged while unfortunately some of the commenters here don’t appear to be able to.
Regarding:
“The data “fiddling” COOLS THE RECORD.
ps, satellites have much more fiddling, waaaay more fiddling”
I’m wondering just how much faith you place in the satellite temp. record?
And given:
“There was an LIA”
How much of the warming since then do you attribute to humans vs. natural recovery from the LIA and how does one decide?
During warm cycles, such as now, there are more Los Ninos. During cool cycles, such as the LIA, there are more Las Ninas.
really ? how long have we been measuring the effects of both to the accuracy required to make that claim.
A hidden face staring intently through the camouflaging underbrush. Our minds seek patterns to keep us alive. The mind would rather we jump at shadows than miss a predator’s stare. And so we look for patterns and guess at correlations. Constantly seeking and forever worried we might miss something that will spell our doom.
That is a heap of data we are collecting from a variety of sources. The monks that tracked sunspots and recorded them gives us a glimpse into a longer range of data.
Will the patterns resolve into the face of a predator or will we only find an oddly shaped array of branches and leaves?
It gives us something to talk about, if nothing else.
For my own opinion, I think we should be building more nuclear power plants and researching other ways of using fission to keep us warm when the weather turns cold.
I see solar and wind power as the current generation’s CCW program. It keeps the young adults gainfully employed and does not destroy too much.
Brother do you have some U235 to spare? I feel a cold spell coming on.
We should be building HELE coal fired power stations and researching the Thorium fuel cycle to bring Liquid Fluoride Thorium Reactors into reality…. The time and money and working lives wasted because of ecofascism and climate regulation in the last 3 decades is a crying shame.
Yes, “working lives wasted” says it all. I wonder if we will live to regret this squandering of talent and time.
sadly, wind power is very destructive and their rotting hulks will remind future generations just how stupid our politicians have been for several decades
Fortunately, these ugly turbines can be easily removed and used as a scrap metal.
I always shudder when I see one, especially nearby. Recently, one of those monstrosities fell under high winds on Highway 25, where I often drive to Colorado Springs. Having the whole “Kansas” part of Colorado to install them where no one would see or hear them, “authorities” decided to show them off along the highway. All this “wind power” scheme is a wasteful show-off at our expense.
They are actually difficult and expensive to remove especially the concrete bases and do not forget the lines of pylons and cables strung over the countryside. The offshore windturbines and especially their bases will remain as hazards to marine navigation for centuries. There is no money available for their removal as the subsidy farmers have done what they always do – declared bankruptcy and gone off in search of other subsidies to farm.
The ones I have seen are mostly composite stuff, even with rubber sound damping. Less than worthless.
The blades may be as well as some of the enclosures, however the main masts are not composite. The main structural supports are more like high tension transmission towers made with steel.
I meant the structures – prestressed composite cylinders with a rubber layer likely for sound, not the typical high tension masts. The 50hz noise quite loud even when still. These are typical in Germany and offshore. Blades of course a different composite.
plus, they’ll eventually slow the rotation of the earth
Alexander-
There is a great difference between “can” and “will.” This has been attested to many times here at WUWT, by people who have driven by decaying fields of wind turbines. I remember seeing an abandoned installation of wind turbines about 10 years ago at the southernmost tip of the big island of Hawaii.
So Stephen is right, their decaying hulks will be around a long time.
“how stupid our politicians have been for several decades”
Smart politicians are not allowed to climb the ladder because they can’t be corrupted. That’s why only the bad apples flood to the top.
Actually, “smart politicians” don’t try to climb the ladder since they know the media is only too wiling to invent whatever it takes to destroy them. There need not be a single item of truth in what the media claims, it still somehow is believed no matter how much “fakery” they put out. Pruitt comes to mind. I’m surprised he stayed on as long as he did.
Pity about Pruitt, not a politician at all. Still, he should have had 24/7 secret service cover.
Trump also not a politician – look at the unrelenting regime-change.
Who said real politics was easy?
“the Argo temeperature data of the area ccorresponding to the main part of the North Atlantic Current.”
Why choose this temperature record ?
I can’t see why the North Atlantic Current would have any special connection to solar activity, compared to any other temperature record.
If you look at subsets of the global record, then you must always find a connection.
in this case its subset cooling, not global cooling
sensible comment
You of course would never dare to call out logical lapses on the skeptics side
you cant see them until I point them out.
I didn’t actually notice that you did, just thought you were blathering.
Logically, subsets should even stop cooling in a warming world. All you need is a wind to blow from the cold highs to the warm lows. Happens all the time. See, Mosh, to go with this argument in a warming world, only works for a relatively short time. The relatively cold sets should be warming in an absolute sense. The poles during the Jurassic were “cool” regions but a heck of a lot warmer than now.
Even more so during the Cretaceous Period and following Paleocene and Eocene Epochs or the Paleogene.
Gary, you get a ‘cold subset’ when the waves intensify and with record breaking speed they bring down the cold from the long Arctic winter. Speed in the storm tracks is the important factor because the air gets modified.
Why choose this temperature record ? Probably because it’s the one we have an actual record of.
The correlations seem a bit weak between these measures of solar activity and temperature.
Unless your talking negative correlation; then they’re quite strong.
OZONE PRODUCTION BY GALACTIC COSMIC RAYS IN MAGNETOCONJUGATED
REGION OF THE EARTH
Y. K. Tassev, P. I. Velinov, L. N. Mateev
A great interest presents also the ozone formation
under the influence of GCR. It is well known that the unique source of charged particles in the lower stratosphere are the GCR, which consist from protons, a-particles and heavier nuclei (Z>3) with energy >1—2 GeV/nuc.
The GCR depose their energy mainly at a height of 10-20 km, where the maximum of the air ionization (maximum of Pfotzer) is. This ionization takes place In the lower stratosphere, where the photodissociation rate decreases essentially and becomes comparable, even less than the CR ionization rate. At fhe same time the charged particles are already able for reactionsin the atmosphere, whose constant reactions rate is greater with one or two orders than the respective value of free radical processes . The GCR are a source of
ozone formation in the lower stratosphere, because of radiolysis in the oxygen molecules.
In t h is way two mechanisms of ozone formation from GCR are observed:
first, the radiolysis of the oxygen molecules; second, a participation of ions in the ionmolecular
processes in the stratosphere.
https://www.researchgate.net/publication/288190725_Ozone_production_by_galactic_cosmic_rays_in_magneto-conjugated_regions_of_the_earth
Carbon-14 is produced in the upper layers of the troposphere and the stratosphere by thermal neutrons absorbed by nitrogen atoms. When cosmic rays enter the atmosphere, they undergo various transformations, including the production of neutrons. The resulting neutrons (1n) participate in the following reaction:
n + 14/7N→ 14/6C + p
Ozone and 14CO2 will in winter raise the temperature in the lower stratosphere above the polar circle, which leads to the escape of water vapor to the stratosphere and increase the amount of ozone in the upper troposphere. Therefore, in winter in North America temperatures will be very low.
http://sol.spacenvironment.net/raps_ops/current_files/rtimg/cutoff.gif
The highest rate of ozone and carbon-14 production takes place at altitudes of 9 to 15 km (30,000 to 49,000 ft) and at high geomagnetic latitudes.
https://en.wikipedia.org/wiki/Carbon-14
Production rates C14 i O3 vary because of changes to the cosmic ray flux caused by the heliospheric modulation (solar wind and solar magnetic field), and due to variations in the Earth’s magnetic field.
http://sol.spacenvironment.net/nairas/Dose_Rates.html
Brief Introduction to Stratospheric Intrusions
Stratospheric Intrusions are when stratospheric air dynamically decends into the troposphere and may reach the surface, bringing with it high concentrations of ozone which may be harmful to some people. Stratospheric Intrusions are identified by very low tropopause heights, low heights of the 2 potential vorticity unit (PVU) surface, very low relative and specific humidity concentrations, and high concentrations of ozone. Stratospheric Intrusions commonly follow strong cold fronts and can extend across multiple states. In satellite imagery, Stratospheric Intrusions are identified by very low moisture levels in the water vapor channels (6.2, 6.5, and 6.9 micron). Along with the dry air, Stratospheric Intrusions bring high amounts of ozone into the tropospheric column and possibly near the surface. This may be harmful to some people with breathing impairments. Stratospheric Intrusions are more common in the winter/spring months and are more frequent during La Nina periods.
http://www.cpc.ncep.noaa.gov/products/stratosphere/strat_int/
Not by me. Current solar activity is not conductive to significant cooling. Although small ups and downs in temperature should occur, we just entered the Modern Warm Period less than a century ago. By analogy to the Medieval Warm Period we should remain in this period until about 2250 AD when early 20th century temperature might be revisited, and serious cooling could start afterwards.
Any strong cooling prediction for the next couple of centuries is very likely to fail. David Archibald already has experience on that. Changes of a few tenths of a degree up or down are irrelevant. Temperature should stabilize ~ +1.5°C above pre-industrial.
I expect solar activity to start increasing. Already the present minimum should be less deep than the previous one and SC25 should have more activity than SC24. From then on is back to the Modern Maximum in solar activity. I know this will be a huge disappointment to a lot of folks expecting a new Little Ice Age.
More details at:
https://judithcurry.com/2018/06/28/nature-unbound-ix-21st-century-climate-change/
The solar wind pressure in 2019 should decrease further.

It is enough that in the winter in the northern hemisphere the temperature will drop by 0.5 degrees C.
“Current solar activity is not conductive to significant cooling.”
Its been declining for decades. What level would be?
You must observe the temperature of the oceans.

It is sufficient now. To keep putting this off is just a vote of no confidence in solar/climate connections.
It is not so much a question of declining or increasing. Paleoclimatic records show significant cooling after multidecadal periods with very low solar activity with a delay of a couple of decades. A centennial extended low with just two cycles below average should not produce much cooling.
What is very likely to happen is that there will be no net global warming between 2002-2035, and perhaps a slight cooling. That’s bad enough to alarmists, although they should be happy about it.
High solar activity correlates with warming. Low solar activity correlates with cooling. Solar activity has been high in recent decades, hence warming…
(mcleod, i don’t think i’ll ever get used to that zazove thing… ☺️)
Just call me Rudi. Rudi Zazove.
(that makes it even HARDER)…
Its a joke fonzie
Javier – very interesting and I hope you’re right. A world without ever-warming GHGs.
+Javier, as is often the case, you raise some interesting points that cannot be lightly dismissed. However, I have some questions. How can we be confident that the MWP will be a reliable analogue for the current warm period? Perhaps I am mistaken, but it seems to me that the LIA was anomalously long, and perhaps anomalously cool as well, which might signify that some important factor in the equation has changed, perhaps for the remainder of the interglacial. How do we know that we are really living in a prolonged Modern WP and not just a short interlude in the LIA?
Currently, not only is a de Vries cycle low expected in solar activity, but archaeologists studying pottery shards in Africa have discovered that earth’s magnetic field was weakening circa 1300 similar to how it is weakening today–although the story I read made no mention of the fact that 1300 was also the approximate onset of the LIA. (It was not “climate” research.) Further, TSI changes clearly have a statistical relationship (the reason is still a subject of debate, of course) with temperature changes, and currently TSI is plunging. Now you may be right that earth’s thermal inertia is so great that even all three of these factors in concert cannot quickly reverse earth’s temperature, but do we really have data sufficiently extensive and accurate that anyone can be strongly confident of that conclusion? Historical accounts have left me thinking that the climate changed rather abruptly at the end of the MWP/MCO.
What might be especially enlightening to know is what the climate was doing during the corresponding period to this period in the Eemian. Did the Eemian experience a LIA at a similar point in its run, and, if it did, what happened afterward? Does anyone know?
A little clarification: when I write “TSI is plunging,” I am thinking Mike Lockwoods 2013 finding:
“Following analysis of the data, Professor Lockwood believes solar activity is now falling more rapidly than at any time in the last 10,000 years.
“He found 24 different occasions in the last 10,000 years when the sun was in exactly the same state as it is now – and the present decline is faster than any of those 24.”
http://www.live.bbc.co.uk/blogs/paulhudson/entries/6d50a6bd-779a-32d6-bfca-06e4484d6835
Also, TSI has been declining with mean global temperature for about 6000 years now (due to the Milankovitch cycles), so I would suspect that the “background level” TSI tends to be generally lower now than it was circa 1300, and a solar minimum will drive it even lower.
While non-CO2-based climate theorists in the West have focused on Svensmark’s theory of solar modulation of cloud cover via GCR’s, and some lesser discussion of falling EUV’s effect on the elasticity of the jet stream, H I Abdussamatov has elaborated a theory of TSI’s effect on earth’s climate as in this paper:
https://www.omicsonline.org/open-access/grand-minimum-of-the-total-solar-irradiance-leads-to-the-little-ice-age-2329-6755.1000113.php?aid=12810
How soon will the impact on climate be measurable?
The changes in temperature in the US will be clear this winter.

ren – yes, the winters in the Eastern US will continue to be harsh I expect. Very mild and dry in the Western US south of the average latitude of the Polar Jet. Meteorologists are studying the mechanisms and they’re not that difficult to follow now, since 2011.
The solar conditions in my opinion are sufficiently quiet to cause cooling and year 2018 will be the transitional year.
Those who keep putting the solar effects versus the climate off to some time way off in the future I think are just covering for themselves and have a lack of conviction.
Already one can see overall sea surface temperatures are trending down and I expect the albedo is starting to increase slightly.
My theory in a nut shell is if these two solar conditions are meant which are 10+ years of sub solar activity in general (post 2005) followed by a period of time of very low average value solar parameters which are equal to or greater in degree of magnitude change and duration of time of solar minimum between typical sunspot cycles that cooling will result.
Overall low solar equating to lower overall oceanic sea surface temperatures and a slight uptick in albedo the result cooler temperatures.
Those that disagree with my assessment do not take into account the solar /explosive volcanic connection or the increase in clouds /galactic cosmic ray connection.
Maybe they don’t even think there is a oceanic surface temperature connection ,and last but not least they probably do not realize the geo magnetic field can act in sync or in opposition to solar. When in sync like it is now it will compound given solar effects.
So far so good because the trends are down and I say if cooling does not occur now -next few years it is not going to happen for a very long time.
AGW theory will live on right or wrong.
Although there is evidence that cosmic ray induced ionization contributes to the formation of aerosol particles, it seems to contribute less than 10% of the new particles. link
“We also examined the contribution of ions to new particle formation on the basis of novel ground-based and airborne observations.”
What do they mean?
CERN CLOUD used novel aerosol formation modelling even with access to the proton beam.
If you go back to previous solar cycles, you will see El Niño’s and La Niña’s occured at approximately the same times during each cycle since 1964. Just before the cycle minimum there was a weak El Niño and during the transition from one solar cycle to the next is a strong La Niña.
This year it appears a weak El Niño is forming so around 2020 or so should be a strong La Niña. The pattern of these are more than random. To me this correlation indicates there is a relationship between solar cycles and global temperature changes as an El Niño or La Niña represents a game changer as far as surface water temperatures that get fed north and south out of the Tropics via currents, as well as influencing the jet streams during winter.
We also are currently experiencing a hard temperature drop in the North Atlantic which will further influence global temperatures as there is a lag between the two. Arctic sea ice is holding this melt season and NE Canada has been brutally cold over the start of summer.
When La Niña is weak, a wave return below the surface of the Pacific Ocean is too weak. After a weak La Niña, El Niño is not likely create.
The graph Figure 2: Interplanetary Magnetic Field 1966 – 2018 looks a bit strange over the period of Cycle 20. The other cycles look like cycles and have a character similar to other data displays such as the 10.7 flux data displayed in Figure 1, but this is not the case for Cycle 20. Is this a data problem?
No, the data are good. Geomagnetic activity (the IDV-index) shows the same behavior.
+ThinkingScientist, cycle 20, whose downside coincided with the coolest part of the 1970’s, was unusually weak, although not as weak as cycle 24. Scroll down to the fourth chart (highs and lows in TSI) at
http://joannenova.com.au/2014/07/more-strange-adventures-in-tsi-data-the-miracle-of-900-fabricated-fraudulent-days/
Climate is controlled by natural orbital and solar activity cycles. The key point is the correlation of the millennial solar activity peak in 1991 with the millennial temperature peak and trend turning point in 2003/4.We could usefully annually celebrate the anniversary of Peak Heat Day as being July 4th 2003. The 12 year delay reflects the thermal inertia of the oceans. This Archibald post is a confirmation of my paper and long term cooling forecasts. The warming since the little ice age has nothing to do with CO2 but reflects simply the upward leg of the millennial cycle. All this is explained in
https://climatesense-norpag.blogspot.com/2017/02/the-coming-cooling-usefully-accurate_17.html
The coming cooling: usefully accurate climate forecasting for policy makers.

DOI: 10.1177/0958305X16686488
Energy & Environment
journals.sagepub.com/home/eae
ABSTRACT
This paper argues that the methods used by the establishment climate science community are not fit for purpose and that a new forecasting paradigm should be adopted. Earth’s climate is the result of resonances and beats between various quasi-cyclic processes of varying wavelengths. It is not possible to forecast the future unless we have a good understanding of where the earth is in time in relation to the current phases of those different interacting natural quasi periodicities. Evidence is presented specifying the timing and amplitude of the natural 60+/- year and, more importantly, 1,000 year periodicities (observed emergent behaviors) that are so obvious in the temperature record. Data related to the solar climate driver is discussed and the solar cycle 22 low in the neutron count (high solar activity) in 1991 is identified as a solar activity millennial peak and correlated with the millennial peak -inversion point – in the RSS temperature trend in about 2003. The cyclic trends are projected forward and predict a probable general temperature decline in the coming decades and centuries. Estimates of the timing and amplitude of the coming cooling are made. If the real climate outcomes follow a trend which approaches the near term forecasts of this working hypothesis, the divergence between the IPCC forecasts and those projected by this paper will be so large by 2021 as to make the current, supposedly actionable, level of confidence in the IPCC forecasts untenable.
See Fig 11
and Fig 12
Fig 12 Explanation
Fig. 12. Comparative Temperature Forecasts to 2100.
Fig. 12 compares the IPCC forecast with the Akasofu (31) forecast (red harmonic) and with the simple and most reasonable working hypothesis of this paper (green line) that the “Golden Spike” temperature peak at about 2003 is the most recent peak in the millennial cycle. Akasofu forecasts a further temperature increase to 2100 to be 0.5°C ± 0.2C, rather than 4.0 C +/- 2.0C predicted by the IPCC. but this interpretation ignores the Millennial inflexion point at 2004. Fig. 12 shows that the well documented 60-year temperature cycle coincidentally also peaks at about 2003.Looking at the shorter 60+/- year wavelength modulation of the millennial trend, the most straightforward hypothesis is that the cooling trends from 2003 forward will simply be a mirror image of the recent rising trends. This is illustrated by the green curve in Fig. 12, which shows cooling until 2038, slight warming to 2073 and then cooling to the end of the century, by which time almost all of the 20th century warming will have been reversed. Easterbrook 2015 (32) based his 2100 forecasts on the warming/cooling, mainly PDO, cycles of the last century. These are similar to Akasofu’s because Easterbrook’s Fig 5 also fails to recognize the 2004 Millennial peak and inversion. Scaffetta’s 2000-2100 projected warming forecast (18) ranged between 0.3 C and 1.6 C which is significantly lower than the IPCC GCM ensemble mean projected warming of 1.1C to 4.1 C. The difference between Scaffetta’s paper and the current paper is that his Fig.30 B also ignores the Millennial temperature trend inversion here picked at 2003 and he allows for the possibility of a more significant anthropogenic CO2 warming contribution.
Maybe the Millennial Turning Point would be a better name for the celebration rather than Peak Heat Day
Typo on figure 3. I suspect it should be ‘smoothed’, but I like ‘smooted’ too!
Summation: To AGW fanatics worldwide – “It’s the Sun, stupid!”
Its not just AGW fanatics. There are lots of people that think that the largest input variable has the least impact.
Never underestimate the power of Magical Thinking.
The Earth is no different than solar energy cells and needs a storage backup facility. Fortunately, it has one. A big one called oceans. As a result looking at squiggles in the solar changes is of little use. Sure, you might see some effect with the bigger squiggles, but you won’t see the big picture.
The Earth’s atmosphere’s temperature is primarily driven by heat release from the oceans. Look at the recent El Nino and how the global temperature followed.
http://www.woodfortrees.org/plot/uah6/from:2014/to/plot/hadsst3gl/from:2014/to:2018
With this in mind I expect global temperature to maintain the current plateau before dipping with what should be a change into a -AMO in the 2020s. It will then warm up again in the 2040s.
I would bet that the recent highs will be seen as the peak of this warm period with the passage of time. Look at what this graph shows of the two previous Warm Periods. Both reach a peak, and then move sideways with slightly decreasing temps after the middle of the trend. I think that is where we are at in this current Modern Warm Period.
http://www.uni-mainz.de/eng/bilder_presse/09_geo_tree_ring_northern_europe_climate.jpg
Goldminor, I agree. I think we have probably reach the peak of the modern warm period but it will still run for another century or two.
If we can get good measurements of ocean current speeds we might be able to detect the changes that would signal the end of this warming period.
and the heat in the ocean …..
It is the surface oceanic temperatures that matter and they are in a down trend.
Salvatore, I haven’t seen any downturn this century, just bumping up and down with ENSO variation.
The ENSO trend since the start of this century is pretty much neutral yet the SST trend is warming over the same period.
DW Rice, Not even wrong.
It really is cute when “scientists” declare that they “know” the temperature of our globe, and oceans. Small minds always tend to believe that they are larger.
Steven … if Dr. Gray was right the ocean heat changes are driven by changes in the speed of MOC. Makes a lot of sense and agrees with the data in Thirumalai et al 2018.
Earth has been in a long-term cooling trend since the end of the Minoan Warm Period over 3000 years ago, and probably since the Holocene Climatic Optimum, more than 5000 years ago.
That trend is still intact.
The trends are peaking and will start decreasing, one by one. It takes time.
http://www.woodfortrees.org/plot/hadcrut4gl/plot/hadcrut4gl/mean:240/mean:192/mean:144/derivative/scale:1200/plot/hadcrut4gl/mean:300/mean:240/mean:180/derivative/scale:1200/plot/hadcrut4gl/mean:360/mean:288/mean:216/derivative/scale:1200/plot/hadcrut4gl/mean:480/mean:384/mean:288/derivative/scale:1200
Surely that can’t be right. We are assured constantly by
warmist trollscompletely rational, objective people that we “should already be cooling”.Why would they lie?
https://www.iceagenow.info/grand-solar-minimum-intensifying-video/
This video supports my thoughts about solar/climate relationships and where the climate is heading over the next few years.
“Archibald (2006) predicted that climate during the forthcoming Solar Cycles 24 and 25 would be significantly cold. As at late 2008, the progression of the current 23/24 solar minimum indicates that a severe cool period is now inevitable, similar to that of the Dalton Minimum. A decline in average annual temperature of 2.2° C is here predicted for the mid-latitude regions over Solar Cycle 24. The result will be an equator-ward shift in continental climatic conditions in the mid-latitudes of the order of 300 km, with consequent severe effects on world agricultural productivity.”
So when are we to cool, again?
I say according to my studies and what I have come up with ,is this year is the transitional year to cooler . I have been saying this for a year or so.
OK, but many people said the same thing in the early 2000s, and promised that the next decade (after a several year lag, which I assumed to be three years) would show global cooling. That clearly did not happen (about 0.3°C increase since) so goalposts had to be moved.
We can only hope that the very small % of change in solar activity will cool the planet we are warming, but odds appear to be that CO2 is far outpacing anything solar irradiance can muster in these short periods.
Conversely, we are in for quite a bit of heat if we get hit with more CO2 (will happen, of course) and more solar irradiance.
Alley there are lots of variables in play, not least our variable star, but almost certainly a weak El Nino later this year will be followed by a seriously big La Nina and the planet should cool appreciably.
Natural variables rule, CO2 has no case to answer.
“Alley there are lots of variables in play…”
Yes, we have had lists of them for many decades.
“… not least our variable star…”
One of the least, actually. Its variation is very small and cyclical, but as we know solar irradiation is trending down as we warm.
“… but almost certainly a weak El Nino later this year will be followed by a seriously big La Nina and the planet should cool appreciably.”
Yes, the oceans are moving the heat around, not creating heat. Link successive El Ninos, and you get a warming trend. Link successive La Ninas, and you get a warming trend. Link all other years, warming. Link them all, warming.
“Natural variables rule, CO2 has no case to answer.”
Quite the opposite. CO2 is the only forcing that can explain the bulk of the warming. But we also have a cooling stratosphere (indicates an increase in CO2) nights warming faster than days (CO2, not the sun) and the poles warming faster than the average. No other forcing explains these observations.
What would be those natural variables? Natural focings only and we would be cooling.
Thanks Alley, you maybe right, without a doubt the lukewarm position is looking attractive.
Where do you see days getting warmer on average. Nights certainly are warmer in many areas around the globe. Although that has been changing over the last several years where more areas are now experiencing typical average night time temps versus what was seen in prior years. Something is changing in that regard and it is not towards warmer temps.
The poles always warm faster during a warm phase of the climate. Cool is on the menu for the next several years due to the ongoing solar minimum. It is what happens after that which will be of interest for those of us observing changes to the climate system. That part comes under the heading of best guesses which is all any of us have to go on.
You state that CO2 is clearly the main driver. So how do you explain what the satellites show over the last several years then? How do you explain the last 6 months of sat data showing a very narrow range of change? All of that despite top levels of CO2 continuously being added to the atmosphere.
Rss for example, …http://images.remss.com/msu/msu_time_series.html
“CO2 is the only forcing that can explain the bulk of the warming.”
No. CO2-Climate Change is Falsified by its multiple [up to 100%] CO2-Critical Prediction Failures. It takes only one such fail to produce doubt about the validity of an hypothesis. And another, competing hypothesis is not necessary to this Falsification.
Until we can explain a 15C rise in a decade in Greenland and large areas of the northern hemisphere without the benefit if increased CO2 (Severinghaus and Brook, 1999), we have no basis for assuming that we have catalogued all the natural forcings.
‘….poles warming faster than the average.’
Under the AGW regime the coldest places should warm the most. That isn’t happening in Antarctica, with the only melting happening in West Antarctica because of submarine volcanoes.
Subglacial.
Agreed.
ironicman – I was told a decade ago that the circulation around Antarctica (700mbs) has intensified cutting off more of the warmth from the north. I don’t know if it’s been confirmed.
Not true, the surface winds for a time, mainly from around 2014 to mid 2016, were pushing warm air and surface waters directly into portions of the continent. That pattern started to shift about 16 months ago back to more protective winds and ocean surface flows. temps have been dropping in the center of Antarctica as a result.
For over a decade the Klimatariat at BoM have been pushing the line that the subtropical ridge had intensified because of global warming, they knew this was accurate because it happened during the 1940s.
They assumed under the AGW theory it would remain intense, but last July the STR collapsed and has remained in that state ever since. So in my book global cooling has begun because the centre of the blocking high pressure is too far south for this time of year.
It feels like a rerun of the 1950s and 1960s.
+Alley, from where do you get the +0.3C temp rise since AD 2000? Is that from global satellite data or repeatedly adjusted surface station data? Or does it depend on carefully selected starting and ending points? Your claim seems to contradict even Michael Mann, who has finally admitted that the “pause” in global warming is real.
Further, only a misanthrope would “hope” for global cooling. Earth has cooled many times, and it has always been hard for man, whereas warming has always made our existence easier.
Salvatore, let’s be sincere, you have been predicting cooling since at least 2010. You like predicting and never ever have you predicted warming or no change in temperature.
All that tells me is that climate is complicated. Yeah, we knew that. By no means does it mean that CO2, in any way, shape or form is the major, or even minor “control knob”.
That is so not true because I based the cooling on two solar conditions which never materialized until this year.
I was wrong with my solar prediction but not on the solar /climate connection.
I have all the solar parameters I said were necessary for cooling on my website climatebusters.org which was done many years ago.
They never came to be until this year. So if this year is transitional and cooling continues after that I will be on pretty firm ground.
You can be given a partial pass, but note that you were making statements in 2010 where you insisted the cooling was happening already, and that the next three years would be telling.
“Your conclusions are in a word wrong, and that will be proven over the coming years [not sure how many that is, but it’s been 8 so far], as the temperatures of earth will start a more significant decline (which started in year 2002 by the way) [a large increase 2002-2017] due to decrease in solar activity among other items. Those items being (going forward)increasing volcanic activity,cold PDO ,with AMO to follow, SOI index being more positive, along with the atmospheric circulation being more meridional due to low solar activity which produces less UV light which warms the stratosphere in such a way due to ozone changes that produces a more meridional circulation. AO,NAO will in turn be more negative, and polar vortex will expand in size.
[OK, possible not all of these happened to your satisfaction until now]
If one goes back in history no matter what time period without exception when the sun displays low solar activity the temperatures of earth always goes down, but time lags are on the order of several years.”
[several, as in 8?]
…
“Your study, the CO2 man made global warming hoax, don’t mean anything because in the next few years we will know ,who is right and who is wrong.”
[So there it is. The next few years, so we knew in 2013? Let’s see what happens this year, now that all the planted have aligned.]
“I will be proven correct along with many in my camp that predict this will be the decade [the decade of 2010s saw a large temperature increase] of global cooling and a large part of that cooling will be due to LOW solar activity. Mark my words.”
Words duly marked.
wrong Alley
@ur momisugly Alley …there is also something you are missing with his comments. Take a look at the first several quotes you posted, and note the sentence structure. Those are not SP’s words. Those are someone else’s thoughts which SP has taken as his own without attribution as to where those words come from. The last several quotes are his words. As his words typically come across as pidgin English.
Any time where his comments are stated in fluent English means that he is using someone else’s words, or a mix of different thoughts from a number of people. He never says where those words/thoughts cane from.
My suggestion to goldminer is go to my website climatebusters.org
I took a look. Are you claiming that you wrote the material which is shown there?
yes
Always wondered why you write so clearly at times, when at other times you write so poorly. Which one is the real Prete?
They are both me. Sometimes I am rushing.
Sal ..maybe cut back on the coffee consumption then.
Yes. Goldminor I will be reading your future post, always interesting.
“Those are not SP’s words.”
Except for my comments in [] brackets, they are all his.
@ur momisugly Alley …that isn’t what I meant. Yes, he wrote those words, but the words/thoughts came from elsewhere. Mostly Del Prete writes in an unusual style, English not being his first language is likely the reason for that. Other times he sings like a nightingale. When he is singing like a nightingale that indicates that he is using someone else’s words. I noted this years ago with him, and have commented on this aspect of his writing style before.
“Yes, he wrote those words, but the words/thoughts came from elsewhere.”
OK. So? He says they are his own words, so we are going to believe him and not you. And even if he pasted someone else’s, he is owning the timeframe. We are past his initial predictions, and are on to new and even tighter (more exciting) predictions that 2018 will be a turning point.
Soon we will discover that the turning point itself will take 20 years, since there is no way that solar irradiation will give us the incredible temperature drop that would be needed to outweigh the increase, even if we are using only the past 30 years.
The true turning point, if it takes place, will be what happens at the end of this solar minimum around mid 2020. The solar minimum should drop global temps as they normally do. Then we wait and see over the next 3 or 4 years after that if a new step change has taken place leading to higher temps or not.
Let’s just keep moving the goalposts and see where that gets you. In the mean time, every single “but it’s the sun” prediction or projection has been wrong, and for several decades.
” but note that you were making statements in 2010 where you insisted the cooling was happening already,”
To be fair, climate cooled significantly for about a year and a half during 2008-2009. the end of solar cycle 23. This both perplexed warmists, who had no explanation, and excited some natural cycle theorists, who, in retrospect, were too quick to extrapolate.
Further more I will say this which is because my two solar conditions have now been met if cooling does not take place I will be wrong.
I do not like the misrepresentation of what I said.
@ur momisugly Javier ….how do you call any of his comments prediction? They are so general in scope, always. He gives no clue as to why he holds his opinions, nor any specific dates of when something will take place according to his so called prediction. Basically, he repeats the same statement over and over again as the years pass.
Salvatore observes everything on a regular basis, knows the current solar and climatic data. 10 years for climate change is not much.
ren …I am not saying that he doesn’t follow the story.
Agreed. 10 years is not much, which is why a transitional year is absurd.
Observing solar activity and temps across decades is more telling. He does repeat his same statements, which really are predictions once he writes “the next few years” which was written eight years ago.
Now he writes that 2018 will be a transitional year, but it would take decades and a drop in global temps (a real decadal drop, not a hiatus) to show that solar irradiance is trouncing greenhouse gasses. It simply had not been happening for decades now.
“10 years is not much, which is why a transitional year is absurd.”
Alley, I think you have a point here. We are near the cycle low anyway, so only several years into the future will we be able to look back and say whether the end of SC23 was a transitional year, or just an unusually challenging cycle bottom, like 2008-09 was.
When do we cool again?
Don’t know. The earth has been warming up since the mid 1650’s – without any influence from CO2 – just as it did earlier from the Minoan Optimum Warm Period (MWP) (cold, then back hot again) to the Roman Warm Period (then cold again and back hot) to the Medieval Warming Period (MWP) (then cold again and back hot) to today’s Modern Warming Period (MWP).
All pervious cycles experienced long periods of hot but cyclical periods. All previous warm cycles had an extended peak much longer than today’s brief 20-30 years. The (natural) warming trend in EVERY cycle was itself cyclical: up and down over a 66-70 year period, but on the net, always overall positive.
Most likely, we will see at least one more short cycle peak before the world begins a catastrophic drop back to the problems of frost and famine in 2350-2550. If CO2 is indeed causing a slight temperature increase, then that increase is the cause of the “pause” (a flattening of the natural increase) rather than an actual decrease as we experienced between 1935-45 and 1975.
Note that this 30 year decrease in global average temperatures from their 1935-1945 peak actually occurred as worldwide CO2 levels increased.
Note that your much-feared “pause” in global average temperatures occurred as CO2 releases increased by 1/3 their previous amounts.
Oh, by the way. For the first time ever, measured sea ice areas in the Sea of Okhotsk, and Bering Sea did NOT melt out completely in August of either 2016 nor August of 2017. 2018 Hudson Bay sea ice is now much much higher than previous 10 year averages. Gulf of St Lawrence sea ice is melting out many weeks longer into the summer than ever recorded before. If sea ice extents at latitude 60 north do in fact mean a cooler planet, we may be seeing that trend develop.
Up north? In the central Arctic area? Less sea ice year around means greater heat loss to the infinite cold blackness of space from the exposed Arctic Ocean.