2017 Global CO2 emissions

Guest essay by Ed Hoskins
The following calculations and graphics are based on information on worldwide CO2 emission levels published by BP in June 2018 for the period from 1965 up until the end of 2017.
https://www.bp.com/en/global/corporate/energy-economics/statistical-review-of-world-energy.html
The data can be summarised as follows:

Some initial points arising from the BP data:
- Having been relatively stable for the last 7 years global CO2 emissions grew by ~1.3% in 2017. This growth was in spite of all the international “commitments” arising from the Paris Climate Agreement.
- The contrast between the developed and developing worlds remains stark:
- developing world emissions overtook Developed world CO2 emissions in 2005 and they have been escalating since.
- in terms of their history and the likely prognosis of their CO2 emissions.
- Since 1990 CO2 emissions from the developed world have decreased, whereas the developing world has shown a fourfold increase since 1980. CO2 emissions in the developing world are accelerating as the quality of the lives for people in the underdeveloped and developing world improves. At least 1.12 billion people in the developing world still have no access to reliable mains electricity.
- As a result CO2 emissions / head for India and the rest of the world’s Underdeveloped nations (~53% of the world population) remains very low at ~1.7 tonnes / head, (~40% of the Global average) meaning that the state of serious human deprivation and underdevelopment is continuing.
- By 2017 CO2 emissions from the developing world were some 65% of the global emissions.
- India and the underdeveloped world will certainly be continuing to promote their own development to attain comparable development levels to their other peer group developing nations.
- India’s growth in CO2 emissions 2016 – 2017 was by a further 4.1%
- China, (considered here as a “Developing Nation”), showed CO2 emission growth of 1.4% in 2017.
- China’s CO2 emissions / head for its population of some 1.4 billion has now approached the average emissions / head in Europe.
- China’s CO2 emissions / head was already higher than most of the EU Nations other than Germany.
Even as long ago as October 2010 Professor Richard Muller made the dilemma for all those who hope to control global warming by reducing CO2 emissions, particularly by means of CO2 reductions from Western Nations, clear: in essence he said:
“the Developing World is not joining-in with CO2 emission reductions nor does it have any intention of doing so. The failure of worldwide action negates the unilateral action of any individual Western Nation”.
http://www.youtube.com/watch?v=U5m6KzDnv7k
Representation by Region
This analysis divides the world’s nations into seven logical groups with distinct attitudes to CO2 control:
developed nations: population ~1,184 million – ~39% CO2 emissions.
- United States of America, now President Trump is rescinding many of Obama’s climate initiatives including USA support for the Paris Climate accord: population 321m : 4.4% — 15.2% CO2 emissions.
- Japan, the former Soviet Union, Canada and Australia, (JP RU CA AU), are developed nations, ambivalent towards controls on CO2 emissions and not necessarily adhering to the Paris Climate Accord: population 356m : 4.7% — 13.1% CO2 emissions.
- The European Union (28), (including the United Kingdom): population 507m : 6.7% — 10.6% CO2 emissions., currently believing in action to combat Global Warming, and their governments are generally enthusiastic supporters of the Paris Climate Accord as the European Union. However it should be noted that the populace of the EU(28) is losing enthusiasm for Green agendas: subsidy support for Renewables is being curtailed and it is likely that many of the pioneering commitments of the past 25 years made to controlling climate change will not retain subsidy support and therefore will be abandoned in future.
developing nations: population ~6,123 million – ~84% — 61% CO2 emissions
- China and Hong Kong: developing very rapidly, with no effective commitments under the Paris Climate Accord: population 1,390m : 18.5% — 27.9% CO2 emissions. China is responsible for the continuing development of its own Coal-Fired installations, multiple Coal-fired installations in the Third World and for the development Fracking for its own Gas fields. Although China makes gestures towards Renewable Energy and has benefitted from Solar PV manufacture, nonetheless its actions are hardly in accordance the the Paris Climate Accord.
- India is developing rapidly from a low base with no virtually commitments under the Paris Climate Accord: population 1,333m : 17.4% — 6.8% CO2 emissions. India is continuing the rapid development of its own Coal-Fired installations. Although India makes gestures towards Renewable Energy its actions are hardly in accordance the the Paris Climate Accord.
- South Korea, Iran, South Africa, Mexico, Saudi Arabia, Brazil, Indonesia and Taiwan, (KR IR ZA MX SA BR ID TW): the more advanced developing nations, still developing rapidly, with minimal commitments under the Paris Climate accord: population 833m – 11.7%– 12.1% CO2 emissions.
- Rest of World (~160 Nations), like India the remainder of the underdeveloped world is developing rapidly from a low base. These nations have no real commitments under the Paris Climate Accord other than the anticipated receipt of “Climate Funds” from developed nations: population 2,630m : 36.3% — 14.0% CO2 emissions.
These data is set out in tabular form below.

These graphs of total CO2 emission history show that up until 2016:
- there has been an overall reduction of CO2 emissions from developed economies since 1990.
- the USA, simply by exploiting shale gas for electricity generation, has already reduced its CO2 emissions by some 16% since 2005. That alone has already had a greater CO2 emission reduction effect than the entire Kyoto protocol.
http://www.oilandgasonline.com/doc/u-s-fracking-has-carbon-more-whole-world-s-wind-solar-0001
- CO2 emissions from the developed economies ambivalent about action on CO2 (JP RU CA AU) have hardly grown since 2005.
- the European Union, EU(28) has reduced its CO2 emissions by ~12% since 2005
However, CO2 emissions from the developing world as a whole overtook the developed world in 2007 and are now ~60% larger than the developed world’s CO2 emissions.
There has been a very rapid escalation of Chinese CO2 emissions since the year 2000.
- China overtook the USA CO2 emissions in 2006, and Chinese emissions are now ~62% higher than the USA. After a brief hiatus till 2016 the escalation in Chinese CO2 emissions now continues. Chinese emissions have grown by +75% since 2005 and China continues to build coal fired powerstations to supply the bulk of its electricity as its industrial and domestic demands grow.
- India has accelerating emissions, growing from a low base, by +63% since 2005. India is building coal fired powerstations to increase the supply of electricity as ~25% of its population still has no access to electric power.
- there is inexorable CO2 emissions growth from the Rest of the World economies, from a low base, they have grown by +80% since 2001.
Recent CO2 emissions growth

Global CO2 emissions had previously plateaued. But since 2016 they have shown a significant uplift. Unsurprisingly the emissions growth has occurred in the developing nation groups India, Rest of World as their quality of life is progressively improving. After a fall in 2015 -2016 in 2017 the was a significant uplift in Chinese emissions. In spite of the Europe wide efforts EU(28) emissions have also been growing overall.
Notably the only Nation that has consistently reduced its CO2 emissions is the USA.
With increasing installation of Coal-Fired generation throughout the developing world it is now likely that Global CO2 emissions will continue to show significant growth thus entirely negating the objectives of the Paris Climate accord.
CO2 emissions / head
Possibly more significant than the total CO2 emissions output is the comparison of the CO2 emissions / head for the various nation groups. This measure represents the level of development of various Nations.

- In 2003 China overtook the world-wide average and surpassed the rapidly developing nations.
- China’s CO2 emissions / head have increased ~11 fold since 1965.
- China’s emissions / head have recently increased in 2017 to 6.71 tonnes / head.
- The EU(28) with active legal measures had reduced emissions until ~2013. Much of that downward trend is largely attributed to their declining economies and the displacement of industrial processes to countries with laxer environmental regimes.
- But recently the EU(28) has seen an upturn in CO2 emissions/head because of increased coal burning for electricity generation particularly in Germany.
- The overall EU(28) and China are now closely matched in CO2 emissions at ~6.9 – 6.7 tonnes / head
- India’s CO2 emissions have grown by 4.7 times since 1965 and are now showing acceleration. That emissions rate is likely to grow substantially with continuing and increased use of coal for electricity generation.
- India and the bulk of the underdeveloped, (~55% of the world’s population), still remain at a very low level of CO2 emissions levels / head of about 1.70 – 1.76 tonnes / head, this level is about 1/9 of the level of the USA and about 1/4 of the level in the EU(28).
- The USA has already reduced its CO2 emissions / head by ~20% since in 2005. This has mainly arisen from the substitution of shale gas for electricity generation replacing Coal.
- The USA has again reduced its CO2 emissions/ head in the last year to ~15.50 tonnes/head.
- Russia is actively involved in backing anti-fracking campaigns in Europe and in the USA via its support of various NGO groups. This is an obvious policy to protect the largest Gasprom markets for Russian Gas in the West. In the past this has retained an energy stranglehold on Western nations, as has been well demonstrated in the Ukraine. The export of Fracked gas from the USA to Europe and indigenous fracking for example in the UK will progressively break such a stranglehold.
- Russia, Japan, Canada and Australia have only grown their emissions/head marginally by ~1% since 2005.
To bring CO2 emissions / head in the developing world up to:
- the present global average level would require a further ~11,000 tonnes per annum or an additional +33%
- the current levels in China and Europe would require a further ~22,000 tonnes per annum or an additional +66%.
European Union CO2 Emissions
When the participating nations particularly in the environmentally active / Green aware EU are compared with Chinese CO2 emissions/head, an interesting picture arises, as follows.
- Average EU(28) CO2 emissions now approximate closely to China.
- EU(28) CO2 emissions overall have increased slightly in 2017, notably in Germany and remarkably France but not in the UK.
- Chinese CO2 emissions at 6.71 tonnes/head for its 1.4 billion population are already ~51% higher than the worldwide average. China’s emissions/head grew slightly in 2017.
- China’s CO2 emissions/head now substantially exceed those in the UK.
- However China has no real commitment under the Paris Climate Accord to constrain its CO2 emissions till after 2030.
- The UK has seen a significant drop in CO2 emissions reaching 5.62 tonnes/head in 2016.
- Germany virtually alone amongst the EU(28) still substantially exceeds the CO2 emissions/head level of China.
- At 4.56 tonnes / head French emissions have increased beyond the world-wide average 4.44.
- Still at 4.56 tonnes/head, France, has the lowest CO2 emission rates in the developed world. This is entirely due to the long-term commitments by France to electricity generation by Nuclear energy. That fact makes President Macron’s stated intention to reduce Nuclear generation from ~80% to 50% particularly anachronistic. This is especially so as French CO2 emissions are now showing an increase from their low base+.
- China’s CO2 exceeded France’s CO2 emissions / head in 2009 and are now ~46% higher.
- The EU(28) CO2 emissions / head as a whole is now ~7% higher than China
- Germany, one of the largest CO2 emitters in Europe, has emissions/head ~105% higher than the worldwide average but it is only ~45% higher than China.
- Germany’s emissions / head have increased recently because they are now burning much larger quantities of brown coal to compensate for the “irrational” closure of their nuclear generating capacity.
- Following the Fukushima disaster, the German government position of rapidly eliminating nuclear power in a country with no earthquake risk and no chance of tsunamis should be irrational and non-tenable.
The unique performance of France as a developed country in limiting its CO2 emissions must question the logic of Green attitudes in opposing of Nuclear power. If CO2 emissions really were a concern to arrest Catastrophic Anthropogenic Global Warming / Man-made Climate Change, these results, particularly from France, show starkly the very real advantage of using Nuclear power for electricity generation.
But even France’s commitment to Nuclear power is now being questioned. Green attitudes in the French government are thus now threatening to destroy one of France’s supreme national assets, i.e. its commitment to reliable Nuclear energy for electricity generation, which if it were an advantage, have no significant CO2 emissions.
The futility of Western de-carbonisation
Actions in the West in response to the Alarmist Green agenda have already caused
- gross risks to Western energy security
- substantially increased costs for private energy users
- damaged the economics of all Western manufacturing industries.
Western industrial companies are bound to seek more congenial energy / business environments, with laxer attitudes towards CO2 emissions to maintain the performance of their businesses. So the futility of the expenditure of vast resources on Green activities in Germany and throughout the Western world becomes clear.
An estimate of the additional 60 year lifetime cost commitment of some €2.0 trillion that has already been committed for the installation of Weather Dependent Renewables in Europe is given at
“India and the bulk of the underdeveloped, (~55% of the world’s population), still remain at a very low level of CO2 emissions levels / head of about 1.70 – 1.76 tonnes / head, this level is about 1/9 of the level of the USA and about 1/4 of the level in the EU(28).”
55%. This is worth emphasising.
Because it forebodes how bad things will get when they catch up?
Yahhhhhhhhhhhhh i cant wait until India’s CO2 emissions catch up. The atmosphere needs more CO2 NOT less. And im not being sarcastic
Go India go
Zazove wanted this emphasized
No… Because it’s a YUGE fracking market for US coal, LNG & petroleum products… 😎
That’s fracking awesome!
https://wattsupwiththat.com/2018/06/18/what-if-india-and-china-used-natural-gas-and-oil-like-the-u-s-what-a-wonderful-world-it-would-be/
😎👍👍
It would be useful if you tried to list how we are going to produce 250 million barrels of oil per day in 2040. I realize it’s easy to graph numbers using a spreadsheet, but that’s hot air unless you can figure out where the oil going to come from.
You need to follow the link to the post… “What If India And China Used Natural Gas And Oil Like The U.S.?”… What a wonderful world it would be!
“What if’s” are fun… Not forecasts.
The oil will come from wherever it is now.
ZAZOVE : ” 55%. This is worth emphasising.”
WHY ?
.
Who wants to live like a THIRD WORLD PERSON ?
Right. So eff’um?
If green power is so much cheaper to deploy and run, then why does the developed world need to pay extra for the power plants the developing world is already building? Why do we need to subsidize them to build ‘green sources’ instead of presumably more expensive “bad sources”?
I wonder if the EU low emissions per capita gets a hand from France’s nuclear power profile (~72% of electricity production)?
Here’s a list of per capita CO2 emissions for countries. It stops at 2015. At that time, Germany’s per capita CO2 emissions were nearly twice those of France. It could be because of France’s nuclear power.
The other big deal is fracking. The emissions of Canada and America are way down from 1980 levels. Some of that is due to offshoring manufacturing to China but a bunch is due to greater use of fracked natural gas.
I still don’t see these charts normalized against temperature. If we could subtract out that used for heating and plot just everything else…, Another way of saying this: heat used to keep from freezing to death is not optional, and therefore one should expect Canada, Germany and Siberia to have a (possibly MUCH) greater energy consumption/head than Italy, Greece or Indonesia, for example. That comparison tells us nothing, really. It’s not until you find statistics for everything except heating that you can begin to make a case for “profligate” energy consumption. Which is all these charts are about, after all.
The energy used for heating in cold countries isn’t that much. Industrial use, transportation, lights, computers, pumps and other uses add up to much more.
Show me. Show me the charts, the graphs, the etc. And even if we take out strictly heating, how much of what remains is related to a colder atmosphere year round? In Houston, my plumbing designs did not include heat trace on water distribution. When I design a building in Michigan, it must. If I do a fire sprinkler design for a parking garage in Houston, I can use a wet system, when I design the same for Michigan, I must use dry stand pipe, or the pipe will burst every winter. That’s why I want to see it normalized against temperature, rather than just subtract out what we think is heating, the normalized then shows we still have a relationship between consumption and temperature even above and beyond heating alone.
Furthermore, many poor countries, or at least the residents of poor countries, do without air conditioning, and since they never had it they just don’t miss it, even at the equator (I have been to Djibouti, I didn’t see a lot of air conditioned residences, unless they were occupied by foreigners). Poor countries away from the equator, or even at the equator but at higher elevation, MUST have heating, or they die. That’s why I want to see the heating normalized out.
France is ~1/7 EU population. This is enough to give a hand, but not enough to be a major explanation. A Germany-like France would double emission, increasing EU emission by ~15%, and this is unrealistic upper bound scenario.
It does state so in the article.
This is the biggest crockofsh1t…..we are total idiots for even doing this
…China is running all over us with a free pass….and the rest of them are right behind China trying to catch up
We better wake up and get out heads out….we don’t owe the rest of these countries anything….and they will be the first to tell you they owe us nothing too….that’s after we’ve sent them $trillions in aid already
Latitude : ( Love your atitude {sic.} !! )
****You are BEGINNING TO DEVELOP THE “TRUMP” OUTLOOK !***
America ( USA….not the SemiSocialist Rest of America ! ) has for MANY YEARS
FINANCED THE United Nations ( despicable , corrupt and now SURPLUS ! )
FINANCED THE DEFENCE OF EUROPE , SCANDINAVIA , S.KOREA , JAPAN ,etc
Sorted out wars in Kuwait , Iraq , Afghanistan , Syria , Serbia , Croatia ,
Bosnia-Herzegovina etc and NEVER had a word of thanks for it’s efforts !!
You even seem to be echoing HIS attitude to CAGW and the total iniquity
and inequity of allowing “under-developed-countries”
( who can afford their own NUCLEAR ARSENALS ………and yet STILL
require foreign aid !! ) to have open-slather when it comes to COAL
and GAS and OIL use for energy production , while ALL the
WESTERN COUNTRIES are being held-to-ransom !
I also notice great attention is paid to China and India and very little mention
of Pakistan , Indonesia , Myanmar , The Philippines, Vietnam and so on which
have quite considerable populations …….and they all get open-slather as well !
AND IN AUSTRALIA we are handicapping ourselves with stupid bloody
windmills,batteries and super-subsidized-solar !!
WHAT A JOKE !
Trevor, lighten up on the caps, man. It makes your comments hard to read and I find myself more and more just wanting to skip over them.
Trevor: It is pretty funny watching the earnest, but certain suicide of the West. The ROW is laughing themselves into delirium while Western greenie propaganda marches on, with only a handful of citizens calling out the little Emperors with no cloths and so clueless., waging their finders in outrage. We need a new Shakespeare to immortalize this pernicious folly.
This article is informative only so far as it goes, but it fails on perspective. To wit:
1) The presumably human-originated-only CO2 emissions numbers seem large, but what is that as a percentage of the estimated total annual emissions from ALL sources, including natural sources whose outputs may be increasing during the Holocene period (e.g., from additional biomass decay, from decreasing solubility of CO2 in seawater as it warms, from increased volcanoes and sea floor rifts/vents due to continental rebound from the last glacial period, etc.).
2) There is absolutely no discussion of the “sinks” of CO2 on Earth and whether a possible increase in the annual amount of binding such CO2 over , say, 20-50 year periods (e.g., the observed “greening” of the Earth with CO2 being bound up in growing trees) is significantly larger or smaller than the annual mass of human-originated CO2 that is released (i.e., “sourced”).
Only about 3% of CO2 emissions are man made. If they don’t like CO2 they should really be going after mommy nature.
“Only about 3% of CO2 emissions are man made. If they don’t like CO2 they should really be going after mommy nature.”
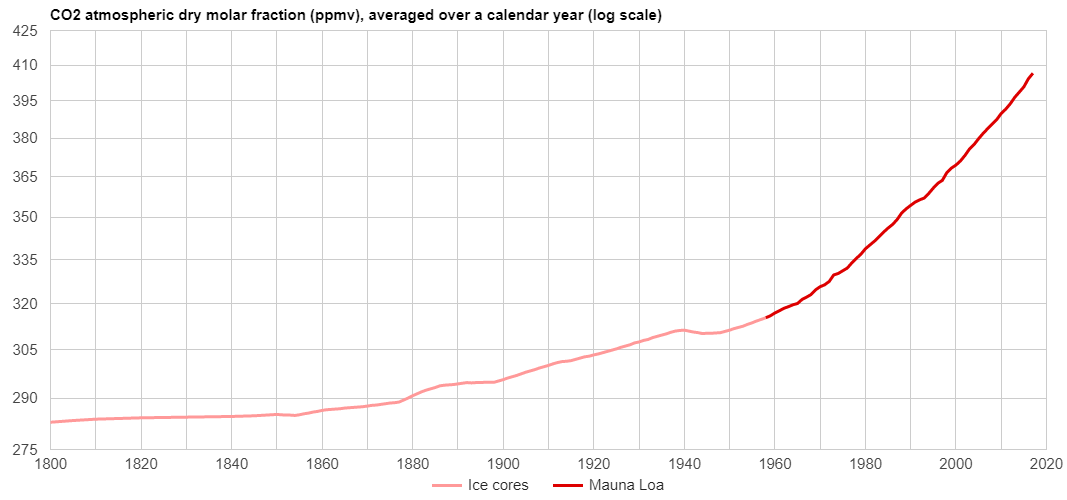
Complete nonsense that crops up far too often. Here (from here) is a graph of the total mass of carbon in the air over the last 1000 years, set against our contributions from FF and land changes. With a 44% airborne fraction, they match perfectly. The “natural emissions” are cyclic and lead to no net gain. Rotting vegetation emits carbon that was taken recently from the air, and the sea emits carbon dioxide in summer that was absorbed the previous winter. That has been going on for centuries with no net change. It’s different now.
Nick,
You said, 1) “The “natural emissions” are cyclic and lead to no net gain.” Except from warming water that out-gasses the excess that is no longer soluble.
2) “Rotting vegetation emits carbon that was taken recently from the air,” Except from the permafrost areas of the north.
3) “the sea emits carbon dioxide in summer that was absorbed the previous winter.” Except coastal and tropical upwelling zones.
Clyde,
All those exceptions applied in all the centuries when CO2 wasn’t going anywhere. As said above, the recent rise to levels far beyond anything in the last 850000 years can be entirely accounted for in terms of the tonnage we have emitted.
J N
Nick, and how about what’s beyond the last 850 000 yr’s. You agree that there were times where CO2 was far above the current value, when the man did not even exist. Why do you only choose this period to compare nature with and without man activities? What’s the logic in that? For a geologist, 850 000 it’s a small time frame, sometimes below the error of some isotopic dating methods…
Where did you get the idea that the last 850 000 were some sort of a measure reference or some sort of actual earth atmospheric state average?
But it is quite long enough to demonstrate that something very unusual happened in the last century of that period when we started digging up and burning FF.
And who says to you that man, among several sources of CO2 mobility in nature, is the culprit? Isn’t that to simplistic? Aren’t there lots of unknowns? Aren’t we measuring CO2 nowadays with unprecedented equipment that no proxy can match? Can we really compare CO2 mostly measured in Ice bubbles with direct measurements from the atmosphere? See my other post. I’m not saying that you are wrong or right, but sure your opinion is as valid as Rob’s data. After all, Rob’s number is in all IPCC AR’s if you pay attention.
there are numerous post here, not from Nick or trolls.
https://wattsupwiththat.com/2010/08/05/why-the-co2-increase-is-man-made-part-1/
etc.
Except it didn’t. EVERYTHING you can cite as unusual has happened before, so it’s not even unusual, let alone very unusual.
What’s so special about 850 ky?
Antarctic ice cores? They are the only paleo CO2 indicator that supports the claim that >300 ppm is unprecedented in 850 ky.
This claim is contradicted by every other method of estimating preindustrial C02 levels.
https://wattsupwiththat.com/2018/06/05/the-total-myth-of-ocean-acidification/
Just about every method of estimating pre-industrial Late Quaternary CO2 levels apart from Antarctic ice cores shows much larger magnitudes and ranges of CO2 concentrations with far more dynamic CO2 development through time… because they are all higher resolution measurements than 99% of Antarctic ice cores For that matter, the magnitude, range and dynamism of Antarctic ice core CO2 varies with resolution.
https://wattsupwiththat.com/2017/03/28/breaking-hockey-sticks-antarctic-ice-core-edition/
This is a composite of the following ice cores:
-51-1800 yr BP:’ Law Dome (Rubino et al., 2013)
1.8-2 kyr BP: Law Dome (MacFarling Meure et al., 2006)
2-11 kyr BP: Dome C (Monnin et al., 2001 + 2004)
11-22 kyr BP: WAIS (Marcott et al., 2014) minus 4 ppmv (see text)
22-40 kyr BP: Siple Dome (Ahn et al., 2014)
40-60 kyr BP: TALDICE (Bereiter et al., 2012)
60-115 kyr BP: EDML (Bereiter et al., 2012)
105-155 kyr BP: Dome C Sublimation (Schneider et al., 2013)
155-393 kyr BP: Vostok (Petit et al., 1999)
393-611 kyr BP: Dome C (Siegenthaler et al., 2005)
612-800 kyr BP: Dome C (Bereiter et al., 2014)
These ice cores are of vastly different resolutions. Petit et al., 1999 indicate that the CO2 resolution for Vostok is 1,500 years. Lüthi et al., 2008 suggest a CO2 resolution of about 500 years for Dome C. It appears that the high resolution Law Dome DE08 core was just spliced on to the lower frequency older ice cores.
If I apply a smoothing filter to the DE08 ice core in order to match the resolution of the lower resolution ice cores, I get a considerably different picture.
The is due to the FACT that, with the exception of Law Dome DE08, Antarctic ice cores cannot resolve century-scale CO2 shifts. No Antarctic ice cores can resolve century-scale CO2 shifts in the Early Holocene or Pleistocene. Most can’t even detect such shifts.
David, very nice post. Most CAGW strong believers tend to privelige Ice cores as the only source of pre-industrial CO2 data. I “sense” cherry picking in this argument. Even so, I have precisely the same idea relative to the compatibility of Low frequency/Hight frequency measurements. Despite problems in comparing different methods for measurement, as I said in other post, most of the present High frequency measurements, with a spike in CO2, would be filtered as noise when compared with low frequency and low resolution data from ice cores. Probably, in the future, let’s say 3000 years from now, the XX century measurements from CO2 will be a couple of points in a graphic, probably with something between 250 and 400 ppm. Your example in the end of your post is a nice demonstrantion.
The ice cores are great low frequency records of CO2. There have been several papers that have demonstrated that the filtered stomata chronologies fit the ice cores. It’s just insane that no one has seriously tried integrate the Antarctic and Greenland ice cores with stomata data.
Instead, they just literally dismiss the Greenland ice cores and stomata… basically because they are “noisy”… The Greenland ice cores may be affected by authigenic carbonates from volcanic dust (like Antarctica is volcano-free) and the stomata data could be affected by precipitation, sunlight, etc… ignoring the fact that the stomata chronologies have been scrupulously controlled for other environmental factors.
If I threw out high frequency seismic data simply because it was noisy… I’d find a lot less oil.
J N
Nick, that’s probably wrong because, in the original article “Gases in ice cores” from MICHAEL BENDER et al, the mechanisms of diffusion of gases through Ice (and I reinforce “through Ice”) were not well known and are still poorly understood. Probably, the hexagonal structure of Ice acts as a nanostructrural filter that selectively diffuses gases. For this reason, and taken into account that different air gases diffuse in a different manner, probably CO2 concentrations from Ice cores can not be compared with the ones now measured directly from the atmosphere. It would only be possible if we could get direct measurements from the atmosphere since 1000 or compare with nowadays deposits of Ice submitted to the same pressure as the ones in Ice cores (after let all the diffusion processes through the Ice occur). Your graphic, as the ones in the original article, are simply comparing peanuts with oranges. Considering this, your posted graphic means almost the same as saying that we only add 3% of CO2 annually to the atmosphere. H2, O2, N2, CH4 and Ar can diffuse through the hexagonal ice structure. Diffusion of these compounds was already predicted theoretically by several authors. However, we cannot ascertain whether defects in the crystal matrix or local disorder induced by guest species are relevant or not for the diffusion mechanism. Efforts to obtain gas sorption equilibrium data to quantify this assumption is still an ongoing effort. Using hexagonal ice sample size around 7 × 10⁻³µL is too small to measure gas sorption uptake. Neverthless, adsorption isotherms of light gases, such as H2, N2 and CO2 in hexagonal ice, were already reported in the literature, for exemple:
https://www.sciencedirect.com/science/article/pii/0021979782900832?via%3Dihub
https://pubs.acs.org/doi/10.1021/jz200453u
For much deceiving that could be, there’s always a “but” in science.
” the mechanisms of diffusion of gases through Ice (and I reinforce “through Ice”) were not well known and are still poorly understood”
We have CO2 samples from Camp Century (Greenland), Byrd Station. Siple Station, Dome C, EPICA, Vostok. They all agree. Hard to believe that is just a coincidence of simultaneous diffusion.
Why not? Admitting that the amount of stored Ice is mostly the same or equivlent and the atmosphere it’s the same as well as the Ice cristal structure? And why shouldn’t the values be equal and not by coincidence, as you say but, even so, not comparable to the ones measured directly from the atmosphere. One more time you are concluding oranges from peanuts, sorry to say. It’s not your fault, it’s a common mistake that most scientists that, unfortunately, work in climate, tend to ignore. It’s a gross violation of the scientific method. By comparing Ice bubbles gas concentrations with atmospheric ones, you are mixing, in a wrong way, completely different methods. I’ve yet to see a serious work with a normalization and accurate comparability of these two methods. Everything that it is being done with a graphic such as yours is scientific dishonesty. To be able to check the validity of this mixed methods, you have to let actual gas bubbles accumulate, let them flow and be pressed and diffuse through ice and probably, some centuries from now, if someone can pick a sample and analise it, it will probably see some comparable value.
not hard to believe, since diffusion would follow the law applying to diffusion in ice.
Would be hard to believe if it were different ice.
Presumably it is different ice, because snowfall and sublimation rates, and thus thickness and density are different.
The Greenland ice cores indicate that CO2 was frequently in the 300-350 ppm range during the Early Holocene, as do plant stomata… Forams even indicate pCO2 of >400 in the Early Holocene.
It’s not nonsense.
http://www.geocraft.com/WVFossils/greenhouse_data.html
Concentration is not even remotely matching emissions in the 2000’s.
http://oi63.tinypic.com/11gniqg.jpg
@Nick Stokes – 1) Correlation isn’t causation. Dr. Roy Spencer disagrees with your correlation argument anyway. http://www.drroyspencer.com/2014/08/how-much-of-atmospheric-co2-increase-is-natural/ 2) If man made CO2 were significant, the NASA CO2 tracking satellite should have found significant CO2 plumes from each major metropolitan area. It didn’t. https://www.nasa.gov/feature/goddard/2016/eye-popping-view-of-co2-critical-step-for-carbon-cycle-science 3) And here’s a website that completely disagrees with you: http://www.geocraft.com/WVFossils/greenhouse_data.html
Correct Red. According to one of the satellite sourced researchers: “The human fingerprint in any given year is relatively small. ‘Human emissions within the past year may add only something like three parts per million to that total,’ Hakkarainen noted. The challenge was to isolate the recent manmade emissions from natural cycles and long-term accumulations.’ ”
That is to say the human contribution to atmospheric CO2 is 0.75%…
https://earthobservatory.nasa.gov/images/89117
What this all implies is that the exogenous warming of the planet has released lots of CO2 from the oceans… that accounts for rising CO2 emissions… not humans.
“Dr. Roy Spencer disagrees with your correlation argument anyway. “
On the contrary. Read it with the update in bold:
“NOTE: The following post has led to many good comments. The best argument advanced that I am wrong is from a ~1,000 year record of CO2 from the Law Dome ice core (a record I was unaware of) which suggests the recent CO2 increase is almost entirely anthropogenic in origin.”
“2) If man made CO2 were significant, the NASA CO2 tracking satellite should have found significant CO2 plumes from each major metropolitan area. It didn’t.”
https://earthobservatory.nasa.gov/images/89117
“A group of scientists from the Finnish Meteorological Institute (FMI) have used OCO-2 data to make satellite-based maps of human emissions of carbon dioxide. Those satellite observations match well with ground-based estimates.
The maps on this page depict carbon dioxide anomalies in the atmosphere; that is, places where CO2 levels were higher than the normal fluctuations that occur with the seasons. They are based on work published in November 2016 by Janne Hakkarainen and colleagues at FMI. The maps depict widespread carbon dioxide around major urban areas, as well as some smaller pockets of high emissions. The highest values in the study were observed over eastern China, with other hot spots in the eastern United States, Central Europe, the Middle East, and Japan.”
The West Coast is no slouch when it comes to heavy industry. What distinguishes these areas is not anthropogenic emissions, but greenery.
“The researchers analyzed and processed OCO-2 data to account for seasonal changes, as well as the background level (already near 400 parts per million). That left them with the signal of emissions from motor vehicles, power plants, and other industrial processes. But to be sure their signal was true, the team turned to another sensor, the Ozone Monitoring Instrument (OMI) on NASA’s Aura satellite. Built by a Dutch-Finnish team, OMI can measure nitrogen dioxide, another gas emitted during fossil fuel combustion. Carbon detections from OCO-2 lined up with NO2 detections by OMI, confirming the extra carbon dioxide was a result of human activities.”
I noted the same thing about the absence of CO2 plumes on the West Coast. Furthermore, Some of the heaviest CO2 emissions on satellite were the Applachians and Smokey Mts National forest.
Take a look where China is green:
As noted above: “The human fingerprint in any given year is relatively small. ‘Human emissions within the past year may add only something like three parts per million to that total,’ Hakkarainen noted. The challenge was to isolate the recent manmade emissions from natural cycles and long-term accumulations.’ ”
@Nick Stokes – This says there is no statistically significant support for your position. Once the uncertainties are calculated, the atmospheric carbon balance still balances with or without man-made contributions. https://www.researchgate.net/publication/281436286_UNCERTAIN_FLOW_ACCOUNTING_AND_THE_IPCC_CARBON_BUDGET_A_NOTE
Old Mephistopheles is shivering in his skivvies (it’s a cold day in hell), apparently, because I have to agree with Nick at least in part. It’s deceptive for us skeptics to argue that human CO2 emissions are a small fraction of natural emissions unless we also concede that natural carbon sinks largely balance natural emissions, while human activities are overwhelmingly emissions unbalanced by sinks.
It would be the case that if the earth is actually warming for entirely natural reasons, then CO2 in the atmosphere would be rising for natural reasons, due to the solubility of CO2 in water being temperature dependent. It could also be true that undersea volcanic activity is putting out more CO2 for whatever unknown reasons. But there is certainly no doubt that human activity is generating CO2, and the amounts seem to correlate well with the increased CO2 in the atmosphere. We’re almost certainly responsible for above-equilibrium concentration of CO2 in the atmosphere.
Where I don’t agree with Nick, of course, is on the consequences of higher CO2 concentration. If we drive CO2 up to 0.082% of the atmosphere from the current 0.041%, it may raise temperatures by another little bit (is it 0.5 degree, is it 2 degrees, is it zero?). There doesn’t appear to be a good correlation between CO2 and temperature, judging from recent periods of “pause” in the warming, which says that we do not really understand the mechanism for recent warming.
Since there has been an observed temperature rise in the last century concurrent with a CO2 concentration rise, it would be prudent to consider the possibility that all of that rise is caused by CO2 acting as a greenhouse gas. If so, it seems reasonable that we should reduce regulatory impediments to expanding the use of nuclear power, hydro, and natural gas. Just in case the answer is more than 2 degrees, we will have taken prudent, cost-effective steps to mitigate the situation. More likely though, another doubling of CO2 is enough to improve agricultural output and generally benefit humanity, but not enough to catastrophically melt ice or cause the ocean to rise dangerously, or any of the other horror stories pushed by the CAGW alarmists.
It’s not necessary to subsidize nuclear, hydro or natural gas, just get government out of the way. I wouldn’t continue to subsidize wind, solar, or any other type of energy, but give them all a level playing field and if they prove cost-effective, then they will also flourish and benefit society.
Very good point. Added to this is that models tying human-caused CO2 to the rise in atmospheric CO2 assume that all other sources average out to a constant rate. We don’t know how much the total production of CO2 per year is and from which sources, let alone whether they are fairly constant or not. Nature rarely operates in a steady-state fashion, let alone at equilibrium. Look at animal populations for a start.
This agrees with you. https://www.researchgate.net/publication/281436286_UNCERTAIN_FLOW_ACCOUNTING_AND_THE_IPCC_CARBON_BUDGET_A_NOTE
The ongoing volcanism in Hawaii is a case in point: the USGS and media talk of gas emissions but the only gas mentioned is sulphur dioxide and rarely hydrogen sulfide, though concentration levels are never disclosed. There isn’t a peep about carbon dioxide which is odd, because it is characteristic of mantle degassing.
Although CO2 emissions have accelerated over the last half-century, negative feedbacks like terrestrial greening have removed about half of that CO2 from that atmosphere, and the logarithmically diminishing warming effect has further reduced the “CO2 forcing” from the remaining “airborne fraction” (the part of the emitted CO2 which remained in the atmosphere). The result has been a just-slightly-more-than-linear CO2 forcing increase over the last forty years, and perhaps half that over the preceding twenty-five. Look how straight (linear) the graph of log(CO2 level), i.e., CO2 forcing, has been over the last forty years:
https://www.sealevel.info/co2.html?co2scale=2
Additionally, the period of most rapid temperature rise also coincided with the widespread adoption of “scrubber” technology to remove particulates from coal exhaust, which presumably contributed to the warming.
Assuming that the approximately-linear forcing trend continues, a reasonable guess is that the warming from rising CO2 levels over the next half-century will be similar to the warming seen over the last half-century, which was modest, and not at all worrisome. We might expect another ½ to ¾ °C. That’s equivalent to a shift in isotherms / growing zones of only about 50 to 100 km (30 to 60 miles), in a half-century, which is hardly noticeable.
http://sealevel.info/zones-2015_258pct.png
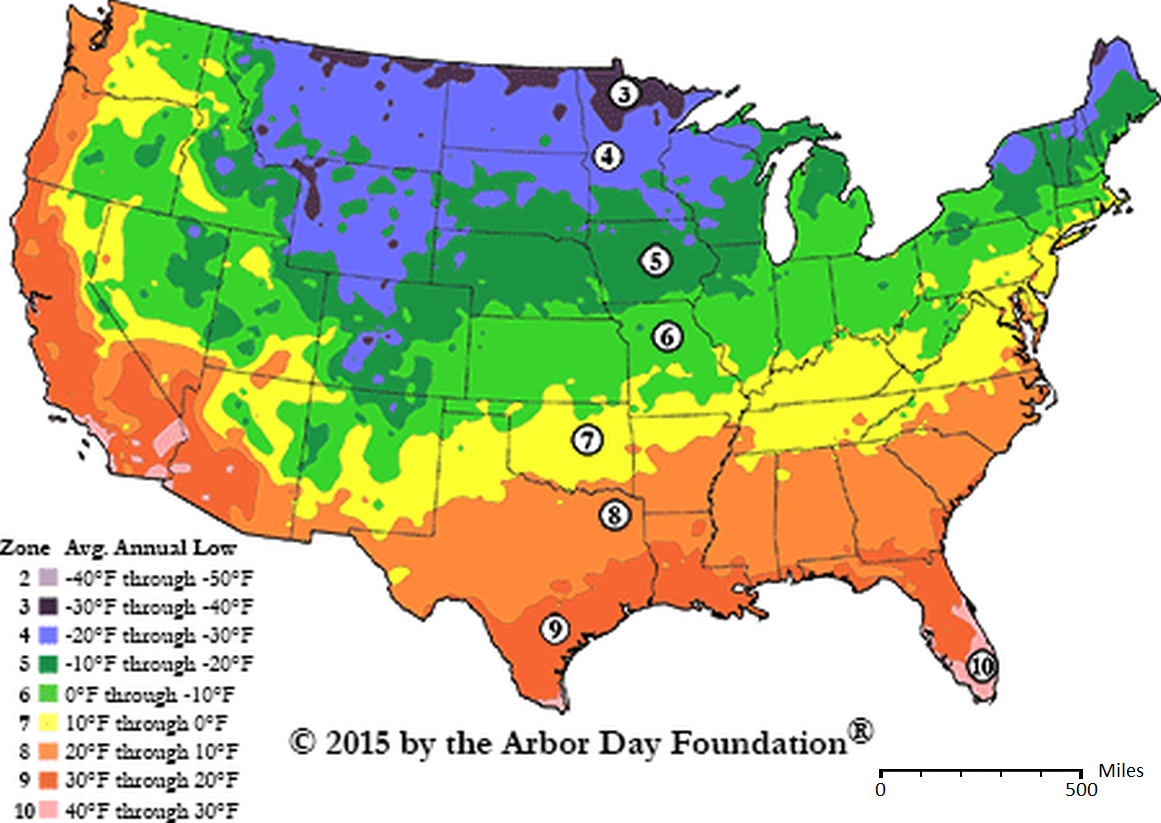
I thought they moved 10 up to somewhere around Cleveland already…..snark
Being a resident of Northern Ohio, I can tell you that it has been in the mid to upper 90’s the last few days here. On the other hand, Joe Bastardi at Weatherbell Analytics says that these are likely the hottest days for Northern Ohio this summer, so I guess we haven’t quite gotten to Zone 10 yet.
But you’ll be there next summer, unless we (but not they) all repent now and give up ALL our evil CO2 releases, which of course means giving up all energy consumption! At least this is the gospel according to Mickey Mann & Co.™!
“Actions in the West in response to the Alarmist Green agenda have already caused
– gross risks to Western energy security
– substantially increased costs for private energy users
– damaged the economics of all Western manufacturing industries.”
These things are not a bug in the Green agenda, they are a feature of the Green agenda.
However, the vast majority of reasonable observers can see there is no malicious “Alarmist Green agenda”, but on the contrary, the EFFECTS of AGW will most likely result in:
– gross risks to Western energy security
– substantially increased costs for private energy users – and everyone else, and
– damage to the economics of all Western manufacturing industries.
You and the author are not of their number as you appear to be looking through the wrong end of the telescope.
Don’t be silly.
The gross risk to Western energy security is the war on carbon and nuke funded and helped by Russian interest (nothing new here, they already did in the 80s)
Increased costs for private energy users are all about the tax on energy used to subsidize expensive, not working, “renewable”.
The damage to the economics of all Western manufacturing industries is the silly policies to subsidize for instance Mittal so that he moves foundries out of Europe because, you know, they emit a lot. Well, they will emit as much and more in India, but, eh, who cares? It will then show in a developing country instead of Europe. And THAT is really “looking through the wrong end of the telescope”.
zazove, you posted, rather incredibly: “. . . the vast majority of reasonable observers can see there is no malicious ‘Alarmist Green agenda’, but . . .”
Really, then how does one explain the recent State of California edict that all homes built after 2020 must have solar panels installed (see: https://wattsupwiththat.com/2018/05/15/californias-boneheaded-solar-remedy-for-climate-change/ )?
This is tantamount to forcing the buyers of such homes to pay relatively large sums of additional money for something they may not need or desire, and it certainly cannot be argued that it is required for safety reasons. This is state government forcing the public to purchase a commercial product to comply with a not-so-hidden-agenda that is based on controversial, largely-unsubstantiated science, coming from a Alarmist minority, that the use of fossil fuels MUST be replaced by renewable energy sources. The State of California did not ask the voters to approve such a mass-impact action. In my world, I define such an actions as malicious.
Yes, RicDre, definitely a feature, not a bug. When they were pushing global cooling back in the 1970s, the solution was to destroy western civilization by stopping the use of fossil fuels. When they flipped to global warming, the solution did not change. Should have been a clue, but most people have the memory of a fruit fly.
I’m prepared to give Nick, zazove and most others the benefit of the doubt and assume that they are sincere and misguided, rather than deceivers. If they were right, their concerns would be noble. There are probably only a small number of bad actors who have good reason to know that they are pushing a lie but do so for selfish reasons of gaining or maintaining power, wealth, or prestige. Candidates for that category would be Al Gore and Michael Mann, probably Elon Musk, certainly George Soros.
If you ask me, and nobody has, the vast bulk of ordinary people who believe that we have AGW and it may be CAGW have never given a moment’s serious (open-minded) consideration to the arguments and evidence offered by skeptical scientists. A few have taken time to understand the scientific arguments of the alarmist viewpoint and are firmly convinced that since they think that they understood the argument, and it seemed plausible to them, that it must be true.
Now a great many of the people on both sides of this divide, choose their position on the question based on which political tribe they belong to. If they favor the Democrats then they understand that they are expected to be climate alarmists in order to be fully part of the in-group. If they favor the Republicans then it’s just the opposite.
Because there are so many cases where people take a position about “climate change” based on their political tribal allegiance rather than on any actual thinking about the evidence, we find many cases where uninformed people make a flawed case for their side. If a poorly-informed skeptic makes a weak case against CAGW, that tends to reinforce the beliefs of the alarmists who have a good grasp of the alarmist theories about climate change.
In some countries, the CAGW hypothesis has become the state religion and “respectable” parties, left and right alike are loathe to offend the pieties of green religion that has almost entirely supplanted traditional religion. It is analogous to politicians of an earlier time who in their private lives were the absolute negation of traditional religious values, but who felt it necessary to pretend to be a believer when in public. Today’s politicians may know that the CAGW agenda is a crock, or as likely, they are focused on gaining and maintaining power and do not care one way or the other. They just do and say what is necessary to gain or maintain power. I consider them as culpable as the out-and-out deceivers. They have the means and I think, the obligation, to get competent advice, but calculating that it doesn’t pay to rock the boat, they either maintain their invincible ignorance or suppress their doubts if any should pop up.
I’m regularly accused of being a conspiracy theorist for thinking that CAGW can be the work of green socialists. They ask me, how can so many people be actively colluding? Of course, they are not. As I said, the vast majority are not conscious of the fact that they have chosen sides without giving it any thought. Most people are conforming to the expectations of their peers and/or acting prudently and rationally (but selfishly) in light of their financial or political interests. They do not care enough about the truth to let it impact their investments or their political careers. As liars, we are all most effective at lying to ourselves.
This article is kinda frustrating for me, because it doesn’t address the single most important metric.
James Hansen in 1988 posted a graph of temperature predictions under 3 scenarios: (a) business as usual (exponential growth in CO2 emissions), (b) reduced linear growth in emissions, (c) no net C02 emissions after 2000.
Many climate alarmists still try to say that observations since then aren’t sufficiently different from scenario (b) to falsify Hansen’s predictions.
With the increased emissions from China and India, where have emissions gone in comparison to Hansen’s scenarios? Are they greatly exceeding the emissions in scenario A, about equal to scenario A, closer to scenario B, below scenario B?
I’ve assumed actual emissions exceed scenario A, because scenario A was labeled “business as usual” and certainly couldn’t have predicted China and India. But maybe scenario A was intentionally exaggerated – not the last time we’ve seen alarmists try a trick like that.
Anyone know the answer?
If you take 1950 to 1988 as the reference period then exponential growth of atmospheric CO2 would have resulted in 386ppm by now and 502ppm by 2100. I have no idea what Hansen actually used and it means little because his understanding of atmospheric physics was naive at best.
I doubt that anyone in 1988 would have predicted the emergence of China as the manufacturing centre of the global economy with the CO2 output to match that tag.
It would be reasonable to conclude that CO2 production has quite dramatically exceeded Hansen’s expectations.
The RCP of 8.5W/sq.m that was eventually introduced as the catastrophic case for CO2 by the IPCC would require much greater acceleration than Hansen predicted.
I have no idea what Hansen actually used and it means little because his understanding of atmospheric physics was naive at best.
I doubt that anyone in 1988 would have predicted the emergence of China as the manufacturing centre of the global economy with the CO2 output to match that tag.
It would be reasonable to conclude that CO2 production has quite dramatically exceeded Hansen’s expectations.
Hansen just worked on projecting growth of global CO2 concentrations, whether it originated in China or the US didn’t matter. As I showed above his projection for 2017 fell between A and B. Naive understanding or not his judgement that Scenario B was the most plausible has proved to be accurate (within 6months over 30 years). So your assumption has proved to be incorrect.
With the increased emissions from China and India, where have emissions gone in comparison to Hansen’s scenarios? Are they greatly exceeding the emissions in scenario A, about equal to scenario A, closer to scenario B, below scenario B?
Hansen’s Projections for CO2 were as follows for 2017
Scenario A: 408ppm
Scenario B: 402ppm
Scenario C: 368ppm
ML annual value 2017: 406ppm
Why the bloody heck is BP reporting on global CO2 emissions?
BP e-branded a few years ago to “Beyond Petroleum”. They also made the most efficient PV panel IIRC. That to me suggests they, however mad it sounds, could be considering divesting from fossil fuels and joining the “renewable energy” gang to make some serious money by actually doing nothing.
China’s emissions totals are probably wrong. BP is probably underestimating them. Others give almost 31%. China has been caught almost every year submitting frauduent figures.
China’s emissions totals are wrong. BP is underestimating them.
A Chinese expert gives 30%
https://www.belfercenter.org/publication/chinas-carbon-emissions-report-2016
China has been caught almost every year submitting frauduent figures. World totals at conversion of CO2=3.67 Carbon The total of 33444 / 3.67 = 9.11Gt of carbon. Reporting is done to the UN once every 2 years. The last time China reported its emissions to the UN was 2012. China is not a developing nation. China has 45% of the world’s skyscrapers.
From BBC
“German researchers measuring Russian emissions must submit their monitoring equipment for inspection by Russia’s secret service and transfer their atmospheric data onto CD-ROMs, submitting it to the Russian government, before they’re allowed to access it.
What could possibly go wrong?”
“In India, the reporting of methane emissions from natural sources, a greenhouse gas 20 times more powerful than carbon dioxide, is uncertain by a factor of 50%. For nitrous oxide, another greenhouse gas, it’s 100%.”
Does anyone believe that the rapid rise in Chinese CO2 emissions came to a screeching halt in 2013 and have remained unchanged since then? Chinese economic growth has allegedly averaged 7%/yr over the same period, so the CO2 efficiency of their economy must have improved by 30% since 2013.
Much of the discussion here so far suffers from two serious gaps in knowledge.
1. If ECS is a valid concept, what is its value and its uncertainty? Importantly, is a value of zero excluded? Why is finding a value proving to be so elusive?
2. It is often asserted that there was a steady historic concentration of CO2 in the air of 180 ppm or so. The big questions are, what mechanisms have set this steady level and what man-made mechanisms can perturb it? Is it bounce-proof or fragile in terms of human lifetime observations?
Many people imagine they know the answers, but they do not. These are profound questions, about as big as the Meaning of Life.
They have been addressed unsatisfactorially mostly by a plethora of small inquiring minds, minds often attatched to agendas that are horrifying.
There is too much emphasis on temperature as a prime indicator. This causes analytical weakness. For example, connections are often made between sea level and temperature, but it is near impossible to find a published nation linking the two. Is this like the ECS uncertainty again?
Why is energy policy being made when there is as yet no ECS figure, no rejection of it being zero, and no sea level-temperature predictive, physical equation?
Climate science continues to be science at its poorest. Geoff
ECS is a concept applying to a linear system. Which climate is not. Hell, the concept of equilibrium temperature itself doesn’t apply, so how could ECS?
“The big questions are, what mechanisms have set this steady level and what man-made mechanisms can perturb it?”
An excellent question. Maintaining a tight, steady state level requires wide bandwidth regulation. Otherwise, one tends to have random walk-like behavior in which variability increases as the square root of time.
Yet, to be immediately sensitive to human inputs, the regulation has to be very unresponsive, and low bandwidth.
This is a contradiction. One cannot have both high and low bandwidth at the same time.
Yes, an informative and specific essay, thanks. Save us from poring through the detail ourselves. And raises the fundamental question very clearly.
Namely, why do the Greens refuse to advocate that China lowers its total tonnage of emissions?
Why are the Greens continuing to plead that China should be given a free pass because of the lowness of its per capita emissions, when they are not low, they are larger than most (other) countries in the developed world?
Why are the Greens continuing to pretend that lowering US or EU emissions, and letting China and India grow as much as they like, will save the planet by reducing global emissions?
Its obvious idiocy, logically and in math terms.
But the interesting question that needs to be brought home is why they are doing it.
Perhaps because even greens believe that all humans have a right to live free from poverty and as people here constantly remark cheap energy is essential for prosperity.
That’s all right and good and everyone should have energy that he can pay for. However, I ask myself, why are the Greens fighting in their very own home countries (in China it will hardly be possible to have independent Greens) cheap energy and its extraction and distribution? While they turn a blind eye in the cases of India and China?
The answer is not difficult, the Greens are disguised communists and socialists. For the goal of socialism, they would even swallow the toad of Chinese coal. Everything serves this purpose.
Well then just admit that trying to stop CO2 emissions is futile and get on with our lives without carbon taxes. It is economic suicide to cause inflation in any economy without a good reason. Whether the companies pay the carbon tax or change to a more expensive fuel source their costs will go up and we all pay more through higher prices.
Yes, reducing CO2 to the levels the alarmist say is necessary is a lost cause, without the wholesale use of nuclear powerplants.
Macron of France promised he would take
ALL other unemployed alarmist “climate scientists” global –
wether Australian, New Zealanders, Canadian and so on.
He soon learned that France needs money for other purposes too.
Really interesting and useful post. Thank you.
According to consensus science the only thing that matters in avoiding climate catastrophe is reducing the atmospheric CO2 levels, and every CO2 molecule emitted anywhere is equally responsible for rising global temperature. But it’s unfair that the developed world enjoys the benefits of higher fossil energy use while the developing world suffers in poverty. If the developed world stopped emitting CO2 tomorrow we still all be doomed unless the developing world stopped too. I love the cognitive dissonance — folks: you can save the planet or you can be fair; you can’t do both.
If we held an honest world-wide referendum on the question, one vote per person, how do you think it would turn out?
So to save the planet we not only have to be unfair, we also have to be undemocratic and probably dishonest as well. I’d love to see someone take that message to the next Earth Day rally.
Alan Watt : ” I love the cognitive dissonance ”
.XXXXXXXXXXXXXXXXXXXXXXXXXXXXXXXXXXXXXXXXXXXXXXXXX
“cognitive dissonance
the state of having inconsistent thoughts, beliefs, or attitudes,
especially as relating to behavioural decisions and attitude change.”
XXXXXXXXXXXXXXXXXXXXXXXXXXXXXXXXXXXXXXXXXXXXXXXXXX
Alan ……I don’t THINK that you can accuse ANYONE HERE OF cognitive
dissonance ! It seems to me that EACH PERSON has VERY CONSISTENT
THOUGHTS , beliefs and attitudes and I doubt VERY MUCH if any one of
them has changed their mind or their attitude IN ANY WAY !
The CAGW believers STILL believe!
The CAGW Skeptics STILL disbelieve !
AND NO……it IS NOT a matter of compromising one’s INTEGRITY , HONESTY
or MORAL CODE . This is a DISCUSSION AREA and lots of us are DISGUSTED !
” I’d love to see someone take that message to the next Earth Day rally.”
Nah ! I still believe in IMPROVING THE EARTH ….and my sentiments are
still very much along those lines : as I once read on a bumper sticker in Tasmania
” Improve the soil……dig in a greenie ! ”
When I was a kid it was called ARBOUR DAY and we each planted a tree !
Years later SOME of these trees still can be found , usually on isolated loops
of the roads , like billabongs on a small creek , where they have been by-passed
by road-realignment or else wiped-out by road widening !
A bit like CAGW discussions here really. A lot of effort for little result !
You may well be correct that nobody changes camps, but I for one have learned a great deal from the claims of CAGW believers and the counter-arguments of skeptics, as well as vice versa. Overall, the thing I have learned is that the climate system is extremely complex. Most of the people who are convinced that they understand it (on either side), are clinging to valid science but mistakenly believe that they have the whole picture when they actually grasp a truth that is potentially irrelevant or only occasionally significant. What comes to mind more than anything is the story of the blind men inspecting an elephant.
I used to be a strong believer in the Svensmark hypothesis, but thanks to Willis’ many analyses of the data, I have become skeptical that galactic cosmic rays have a major impact on climate. I used to be sure that CO2 is a greenhouse gas that has some significant warming effect on the atmosphere. Now I’m not sure that the effect isn’t largely counteracted by other factors. All I think we really know is that temperatures have risen very modestly with a poor correlation with CO2 concentration. If CO2 has driven this change at all, we can say that we won’t see all that much warming even if we bump up a couple more hundred parts per million.
And not a single kilogram of all that carbon matters since CO2 has never been shown to drive world temperatures.
But, but , but . . . it correlates so well!
sarc/off
The current issue (3 July) of the Proceedings of the National Academy of Sciences USA has an interesting (but quite technical as you’d expect) article on the difficulties of measuring CO2 emissions by country, and the various methodologies to do so. The calculations for CO2 emissions of power plants are easy and accurate, problems arise with estimating CO2 production from farms, land use are difficult, and subject to outright fraud. Here the link — http://www.pnas.org/content/115/27/6873 — not sure if it’s behind a paywall. Definitely worth a read