Guest Post by Willis Eschenbach
Posted without comment, except a hat tip to Dave Burton and Willie Soon …

There is no statistically significant difference between the two trends. Well, I guess that qualifies as a comment …
Best to everyone on a day full of sunshine,
w.
My Usual Request: Quote the exact words that you’re discussing, so we can all understand who and what you are referring to.
UPDATE: I’m sure Willis won’t mind that I added “Man-made Climate” to the title, because search engines aren’t as smart and interpretive as he and I – Anthony
Asking the question is answering it.
Not very original. This has been pointed out by numerous people over the years. Two examples from the top of my head:
In 2015 by Euan Mearns:
http://www.euanmearns.com/wp-content/uploads/2015/09/naturalvmanmadewarming.png
http://euanmearns.com/the-atlantic-multidecadal-oscillation-and-the-temperature-record/#comment-12317
In 2017 by Rud Istvan:
https://wattsupwiththat.com/2017/07/06/why-climate-models-run-hot/
so what you are trying to say is its an oldie but a goodie?
I usually don’t attempt to say things. Rud Istvan cites Richard Lindzen as the first to point out this similitude. I can’t attest to that. I would say it is “vox populi.”
Javier April 20, 2018 at 10:12 am
You are an inherently unpleasant man who will go to any length to unsuccessfully try to bite my ankles. I didn’t say it was original. To the contrary, I gave a hat tip in the head post to the two people who put me on to this, and I quoted Phil Jones saying the same thing in the very first comment … and now you say it was not original???
What is not original is you maliciously pointing out what I already pointed out twice as though I’d claimed it as my own. For shame. Go spread your slime elsewhere, thanks. All you are doing here is further damage to your already tattered reputation.
w.
You see a lot of unpleasant people around:
https://wattsupwiththat.com/2018/04/17/the-astounding-non-success-of-sparky-cars/comment-page-1/#comment-2792692
The simplest explanation is that you are projecting the way you are onto others.
Willis
I find that Javier in fact has a very good reputation and I enjoy all of his posts as I do yours.
Like yourself he has and is still trying to contribute to climate understanding.
He is polite and generous in his replies to questions to his posts.
You both have a lot to contribute, why not stick to that.
“You both have a lot to contribute, why not stick to that.”
Yes, Javier, stop sniping over minutiae, and Willis, just ignore him when he does. Problem solved.
Remember, we are both on the same team.
Anthony Watts April 20, 2018 at 1:41 pm
Thanks, Anthony, and in a perfect world that would be a perfect solution.
I wish that would solve the problem, and I would that we were on the same team. However, he’s off riding his goofy solar pseudocycle and accusing me of plagiarism … neither of which indicates teamwork on my planet.
My problem is that when I ignore someone like that, someone jumps up to agree with the person making the accusation. Then there are two, then there are four agreeing with him, and pretty soon we got a convoy, all of them patting each other on the back and agreeing with each other about how I’m a meeean, terrible human being who is trying to pass off the work of others as something original despite the fact that I clearly said it was not an original idea.
Care to guess why I was careful to indicate that the underlying idea was not mine? Yep, you got it … I’ve played this game too long. I was trying to ward off just that kind of accusation, but nooo … Javier made it anyhow.
You do understand that Javier just accused me of plagiarism, I hope … and I am very loath to just ignore slimy lying accusations that are that profound. Falsely accusing me of plagiarism is not “sniping” on my planet, it is a serious and very nasty accusation.
In addition, there are lots of folks coming here for the first time who, through ignorance, will gladly take such false accusations at face value, particularly when others are chiming in to agree, unless I defend myself against that kind of lies and libel.
So yes, if nobody accuses me of plagiarism, I won’t defend myself. But if they do make such a vile accusation, I’d be a fool to sit silent and let them do it, and I don’t think that you would either …
My very best to you and yours, and at your request I’ll do my utmost to ignore sniping in the future … but not accusations of plagiarism.
w.
I didn’t do such thing. I said it was not very original (obviously the article), and then I provided evidence of what I said. But if you want to take it as an accusation of plagiarism, who am I to correct you?
My opinion, is that your naive approach to science would benefit enormously from a little checking of what others have done and published before. That would prevent you from having “eureka” moments over things that are well known. But suit yourself.
Anthony, you present it as if I was the instigator of something because an attitude problem. The truth is the attitude problem is not mine:
Every time I post something on solar variability I am attacked and insulted (cyclomania, as a type of mental disease), and Willis goes as far as publishing rebuttal articles starting with:
https://wattsupwiththat.com/2018/03/15/data-in-bondage/
As Leif Svalgaard says, science is a blood sport. It you are willing to give, you must be willing to take. So it is up to Willis really. If he wants to play nice, we play nice. If he wants to play rough, we play rough. What is not acceptable is that Willis and Leif get a free pass and everybody else must yield.
I started posting on this site because of witty articles and technical comments that provide both references and follow up advice. Probably more insight than a peer reviewed paper. However, sometimes comments become petty and lessen the professional and reputable site of WUWT.
Just a woMann’s observation.
Javier April 20, 2018 at 4:21 pm
Pass. I trust the readers to see through this shallow excuse.
w.
I never really understood this “plagiarism” (big word, tried to spell it right), since when are thoughts copyrighted?
Do I need to credit the person that first coined the term “righty tighty/ lefty loosy” , every time I write a shop manual.
I understand that we “stand on the shoulders of giants”, but come on…
It is no excuse since it is your misinterpretation. Where I am from, not being original means that somebody did it before, not necessarily that you are copying from somebody. That requires that you had knowledge of the previous works. You can be ignorant (and thus not copying) yet still not original. But perhaps in English it is different, I wouldn’t know. In any case I wasn’t saying that you copied, just that you were ignorant of previous works. But you can take offense to that too, if you want.
Javier April 21, 2018 at 4:51 am
Javier, I said three times that there was previous work. I credited two people BY NAME in the head post and one more BY NAME in the very first comment.
For you to come along after my clear statements and accuse me of not being original is a clear indication of malicious intent on your part. As I said. I trust the readers to understand that.
Regards,
w.
It happen long before the start of the industrial revolution
(first posted on WUWT on February 20, 2015 here
El Chichon (1982) is also evident. While only rated a VEI 5, it injected seven million metric tons of sulfur dioxide into the stratosphere.
There were also four VEI 4 eruptions in 1973-76. VEI 5 Mt. St. Helens (1980) had less global effect.
Iceland’s volcanoes proximity to England due the Arctic jet stream have significant effect on the CET.
The four northern Ring of Fire eruptions in rapid succession during the mid-70s were in Guatemala, Alaska, Kamchatka and the Kurile Islands.
Javier said (about Willis): “My opinion, is that your naive approach to science would benefit enormously from a little checking of what others have done and published before. That would prevent you from having “eureka” moments over things that are well known. But suit yourself.”
I almost never sense “eureka” from Willis. Instead, I sense “here is what the data says,” sometimes using others’ work(s) [and cited], but always more in a tone of educating and simplifying, which I find refreshing. He asks for feedback, and asks for others to quote from his post…how difficult is that? Javier, in this instance, I find YOU to to be the one who “can’t let it go,” who sounds “jealous,” and generally snippetty/unpleasant. Not that my input matters one iota to you, except that I’m publicly saying “I’m less likely to take Javier seriously going forward.” Just my personal opinion, of course.
Everybody is entitled to his opinion. This goes a while back. People might disagree with the climate hypothesis that I present, but they are backed by tons of published peer-reviewed scientific literature, so disrespecting comments about me for holding them are out of place. Don’t you agree? If you have read enough of WUWT you should know that Leif and Willis show a lot of disrespect for anybody that defends an important role for solar variability on climate, and particularly for anybody that dares to defend the existence of long cycles in the Sun that affect the climate on Earth. But if anybody treats them the same way they complain loudly.
The 396 W/m^2 upwelling and net 333 W/m^2 GHG energy loop as shown on the K-T power flux balance diagram (Figure 10 Trenberth et al 2011jcli24) is calculated using the S-B equation with an assumed emissivity of 1.0 and an average surface temperature of 16 C, 289 K. Because of the conductive/convective/advective/latent heat participating processes of the atmospheric molecules the actual and correct radiative emissivity is about 0.16, i.e. 63/396.
This GHG energy loop is an inappropriate calculation with zero physical reality.
Without this energy loop the radiative greenhouse effect theory fails.
Without RGHE man-caused climate change does not exist.
It’s called “science.”
Don’t be frightened, spit out the Kool-Aid and give it a try.
Please note in Trenberth 2011 that the 333 Watts hitting the ground (he says ‘absorbed’) does not, in his cartoon, induce any warming of the air to create thermals, and doesn’t drive any evapo-transpiration. The energy absorbed from incoming insolation (168 Watts) does both.
It is remarkable that the surface of the Earth know which absorbed energy stream to turn into convective cooling and which to merely reflect.
If the amount of energy Trenberth says is delivered to the atmosphere by convective heat transfer is as low as he says, solar water heaters wouldn’t work.
According to Trenberth, back radiation, unlike direct radiation, is absorbed by the earth but doesn’t heat it (!) and is re-radiated in its entirety without warming the air in contact with it either. Amazing.
Geez Willis, it is right there in blue.
(See, this is just one more instance where crowd sourced “peer review” comes to the rescue.)
I think the climate problem started out “Strong”, but is mostly “Mann”-made of recent..
But then again, I don’t know Schmidt.
Willis, could you please extend the graphs by four years each?
Why the blip?
JF
Julian, always good to see your name come up in the comments list … hang on …
…
OK, here you go.
w.
I think the blue graph is the colder one. 8<)
Not only are the two trends similar – the higher frequency patterns too. And the trends are ~60 years apart. History rhymes.
I’ve been saying this for years.
I’ve even linked to the data and challenged other Guardian readers to explain why the rate of warming is the same before and after 1950.
Strangely, those comments breach Guardian guidelines and get deleted.
Where?
In virtual reality.
What this comparative analysis shows is the effect of temporal-connection, the 4 dimensional climate science equivalent of a spatial teleconnections. We know from various studies that in climate science a temperature rise (the effect) precedes rising CO2 emissions (the cause) and here is the first indisputable evidence that the temperature rise in the first decades after 1900 was not a natural event. It was instead a precursor signal of the effective prior forcing temporal-connection of modern day industrial carbon dioxide emissions causing an abnormal temperature rise in the first decades of the 20th century.
Nonscientist – you don’t agree that warming factors increased the CO2, resulting in further warming that caused more CO2 to be released and so on: a positive feedback?
MIR
No. Feedback is time positive and relates to future warming whereas temporal-connections are defined as time negative phenomena. Clearly not the same thing.
Comparing the global SST 65 year trend from the coldest AMO phase years of 1910 and 1975, to a 65 year trend from the warm SST spike in 1945:
http://www.woodfortrees.org/graph/hadsst3gl/from:1900/plot/hadsst3gl/from:1910/to:1975/trend/plot/hadsst3gl/from:1945/to:2010/trend
or in more detail
http://www.vukcevic.talktalk.net/AMOq1.gif
(from 2015)
… just an editorial comment:
Some might say that adding “Man-made” to Willis’ original title is sexist, since I know, for a fact, that there are lots of women drivers spewing much CO2 into the atmosphere. We, therefore, should choose a title that is INCLUSIVE of all gender identifications. Might I suggest the following:
What Exactly Is the Man-woman-human-gay-lesbian-bi-questioning-gender-neutral-…made Climate Problem?
This alone would add a note of “originality” to an article that one commentator obviously found bland. (^_^)
Side bar: Are people who drink coffee … every … single … day unoriginal ?
Humyn. Please!
Thanks, Chimp,
I was not up to speed on that word:
Humyn: Variant of human. Used almost exclusively by pompous feminists.
Then there’s “womyn” too. I guess that’s used by a REALLY pompous feminist.
Myn oh myn ! (i.e., Man oh man !) … all I see is the “my”, … which says it all without the other letters.
Robert,
IMO “womyn” came before “humyn”, because radical feminists objected to the spelling of “woman”. They wanted no part of a beastly, testosterone-drenched, smelly, hairy, patriarchal, oppressive, probably heteronormative, sexist “man” in their word! When it was pointed out that “human” also contains “man”, the response was a given.
“Woman” should be spelled “woeismean”
What is the correct term for a person who fishes? If not fisherman, then fisherperson?, … fishermyn?
And, oh, what do do, … what do do … about problematic common words such as:
almanac
management
romantic
claimant
commander
commandeer
… and my favorite
manic
Femin@zis have this all figured out. “Man” is OK if it doesn’t refer to a non-male person (although that word contains the problematic “son”).
Fisherman should be “fisher”. Mailman should be “letter carrier” or something of that ilk. Chairman of course is “chairperson” or “chair”. This even though the suffix “-man” is grammatically neuter.
Well, this is just English, of course.
What about words derived from Latin ? “Homo sapiens”, for example? It doesn’t have the word, “man” in ENGLISH, but it has the Latin word for “man”. Now what ?
If “homo” causes a problem, then certainly words like “homogenize” would cause a problem. And then there’s the modern problem of the “homo” part, which has come to mean something entirely different than Latin speakers intended. It can get crazy, if you let it. (^_^)
It’s like looking really hard at water stains, where you can find almost any shape you want, depending on how you look at it. The problem is in the looker, NOT in the word. Of course, I’m just stating the obvious that you already know.
Robert,
Probably wouldn’t matter to a PC N@zi, but the “homo” in “homogenize” is from the Greek for “same”, rather than the Latin for “man”.
Using the Wood For Trees website I plotted the linear trend line for both graphs. Then I pulled up the raw data. The slope of the earlier data is 0.00766983 per year. The slope of the later graph is 0.0113233 per year. That’s a 47% increase. Just saying.
Because the HadCRU Team members have systematically cooled the past, and pressed the present as much warmer as possible with the satellites watching.
0.0113233 – 0.00766983 = 0.00365347
And if instruments cannot measure to a thousandth of a degree, then the 47% is also statistically insignificant, right ?
Willis’ bottom plot is the 1895-1943 Natural trend. However, I can’t find anything unusual in the HadCrut data, just a lot of natural temperature cycles responding to oceanic and solar influences.
https://imgur.com/GvY40Ix
https://m.imgur.com/GvY40Ix
– Chimp (1:26 pm):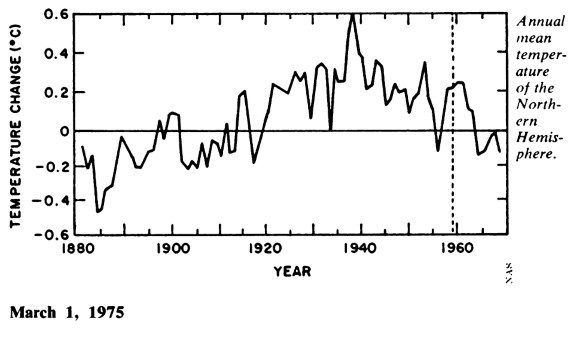
“And, the graph of 1944-56 would also show that global average T declined during that interval despite rising CO2. That period too has been warmed by the gatekeepers, since the cooling was dramatic.
The cooling was even more pronounced when CO2 was higher than the 1940s and ’50s, during the ’60s and ’70s, until the PDO flip of 1977.”
= = = = =
O substantiate that point…
“…the weather in the first part of this century has been the warmest and best for world agriculture in over a millennium, and, partly as a result, the world’s population has more than doubled. Since 1940, however, the temperature of the Northern Hemisphere has been steadily falling: Having risen about 1.1 degrees C. between 1885 and 1940, according to one estimation, the temperature has already fallen back some 0.6 degrees, and shows no signs of reversal.”
Chilling Possibilities, Science News, 1975
K,
But now of course the Team has so adjusted the “record” that the worrisome cooling after WWII has been flattened out of existence.
“Climate science” is not science but politics, misusing and abusing the prestige of science, to the detriment of real science, leading to the death of millions and squandering of trillions of dollars.
‘But how can you stop people remembering things?’ cried Winston, again momentarily forgetting the dial. ‘It is involuntary. It is outside oneself. How can you control memory? You have not controlled mine!’
Where is exactly the meaning of this article? The two graphs show both the standard Man-made Climate theory of the instrumental temperature records since the 1850’s, arguable the start of massive CO2 emissions although still a fraction of current scale and yet it’s not a fact that the atmosphere would somehow inhibit some simple linear response to emission in each multidecadal period.
Wikipedia spells out the common line: “Most of the observed warming occurred in two periods: around 1900 to around 1940 and around 1970 onwards; the cooling/plateau from 1940 to 1970 has been mostly attributed to sulphate aerosol.”.
The two graphs simply show the two known warming periods and the cooling/plateau stage as claimed already by Warmists! What is the point of showing them as having some “point” by just their similarity? That we should have panicked a hundred years ago? That the 19th century emissions somehow could not have any similar effect on global temperature records? Those would be very technical claims, if being made at all here. But yeah “no comment added” as there’s no actual point being made.
thomasjk
April 20, 2018 at 9:42 am
The earlier trend was global, Bob, thus a World War rather than a conflict in which militarily advanced nation-statest tried to bomb a developing country back into the stone age.
GK Chesterton said something like:
“Progress is a comparative for which we have not settled on the superlative.”
I believe in this case, the same could be said of your choice of the word “developing”
This type of wording always annoys me. There is a statistical difference between the two trends. One is wamring about 50% faster than the other. What you should say is the difference between the two is not statistically significant.
The fact that whatever statistical test you used to compare the two trends failed to reject the null-hypothesis does not mean youve shown the two trends are the same.
Have you tried looking at different periods to see if you can find a statistically significant difference? Why not start by not stopping in 2005?
Bellman April 21, 2018 at 8:06 am Edit
I’ve changed the wording to say “statistically significant difference”, which was the intent of the statement … but then you knew that.
Nor did I claim that they were “the same”. If you include enough decimals, two trends are NEVER the same … so what? The question is, do they represent different processes? Or to put it another way, if CO2 is an issue, why doesn’t it create statistically significant warming?
Be my guest, I look forward to you returning to tell us of your results.
w.
I’m glad it wasn’t you intention to claim the two were the same, but you don’t need to go to many decimal places to see the difference.
1895 – 1943: 0.77 ± 0.32 °C / century
1957 – 2005: 1.13 ± 0.31 °C / century
And how do you test that? Two trends that are the same, or in this case not proven to be significantly different, does not imply they have the same cause.
This is especially true if, as I assume, you have carefully selected the two periods that give the smallest difference. Why look at a period from 1957 – 2005? Temperatures were dropping for the first 10 – 15 years, and warming has continued for the next 13 years. If we extend both these periods by that amount we get:
1895 – 1956: 0.74 ± 0.22 °C / century
1957 – 2018: 1.33 ± 0.21 °C / century
And now by my reckoning the two are significantly different.
You don’t need to go to too many decimal places to see the difference.
1895 – 1943: 0.77 ±0.32 °C/century (2σ)
1957 – 2005: 1.13 ±0.31 °C/century (2σ)
The more recent period is warming almost 50% faster than the earlier.
But if you want to see if there is a difference in the current warming why not look at the most recent years.
1970 – 2018: 1.75 ±0.27 °C/century (2σ)
I’m sure you could find a statistically significant difference between 0.77 ±0.32 and 1.75 ±0.27.
I’m not sure why you chose 1895 – 1943 as your first 48 year trend. If you had started in 1902 you would have a trend very similar to 1957 – 2005, but still very different to the most recent 48 years.
1902 – 1950: 1.14 ±0.28 °C/century (2σ)
1957 – 2005: 1.13 ±0.31 °C/century (2σ)
1970 – 2018: 1.75 ±0.27 °C/century (2σ)
“There is no statistically significant difference between the two trends. Well, I guess that qualifies as a comment …
Tr1 = f(G,A,N)
Tr2 = f(G2,A2,N2)
why should there be a difference. I certainly dont expect one. In fact AGW tells me NOT to expect one.
As I was going up the stair
I met a trend that wasn’t there.
It wasn’t there again today;
I wish, I wish it’d go away.
Anthony Watts April 22, 2018 at 8:39 am
So this joker has just been a troll all along? That makes perfect sense … because he made no sense at all.
What drives these … charming folks to this kind of nastiness? That kind of behavior is pathetically sick.
Thanks for watching over the website and catching this slimeball, Anthony. Well spotted.
w.
Javier April 20, 2018 at 9:53 am
Javier, several things have become apparent after looking more closely at your chart.
First, your lines do NOT agree with Phil Jones’s statement. It’s most apparent where Phil puts the end of a rising trend at 1940, while your graph puts it at 1945.
Second, there is no sign of a “~ 60-year oscillation” in either Phil’s statement or in his trends. If we count trough-to-trough, there is a 50-year and a 65-year interval. If we count peak-to-peak there is a 60-year and a 50-year interval. And that ignores the fact that temperatures kept rising after the end of Phil Jones’s trends.
I hate this kind of handwaving where anything even remotely near to some given period is counted as evidence in favor of that period. For example, I’ve seen claims that the period of the so-called “Gleissberg Minimum” is anywhere from 65 years to 100+ years:
This allows anyone to claim just about any length of apparent period as being evidence of a putative “Gleissberg Cycle”.


However, a periodogram or a CEEMD analysis of the sunspot record shows no power in any of those bands. There is a peak at around 100 years, on the other hand, longer than any of the claimed “Gleissberg Cycles” above … but it fades in and out over the period of record.
Third, once again you are using a cumulative sum of the sunspots. As I’ve pointed out repeatedly, this can be adjusted to give any trend you’d like by simply choosing an appropriate zero point. Here are three cumulative sums of sunspots that only differ by using a different zero point:
As you can see, you can make a cumulative sum take any trend, so matching it to trend X means NOTHING.
Fourth, the real problem with claiming a long cycle of some sort in the temperature record is that it is too short to draw any real conclusions. Here’s the full HadCRUT4 record:
The red line is a centered Gaussian average. As you can see, there is a very short interval at the start … and if there truly were a ~ 60-year period, temperatures should have started dropping around 2005. But they didn’t.
To sum it up:
• The red lines you’ve shown on our chart are not what Phil Jones was talking about.
• You’re claiming a “~ 60-year cycle” when no such clear cycle exists.
• You’ve used a version of a sunspot cumulative sum that is TUNED to match the temperature trend, so there is no surprise that they roughly match.
• The temperature record is far too short to claim that a 60-year cycle exists, particularly since both the earliest and most recent parts of the record show no such cycle.
Regards to you, and to all,
w.
PS—Javier, if you do wish to use the cumulative sum of the sunspots, there is a way to do it. This is to take the cumulative sum about the mean of the data, which ensures that it starts and ends at zero. Then detrend the temperature data.
This ensures that we are not misled by any trends in either dataset, but we can compare the shape of the variations. Here’s that graph:
As you can see, the correlation is not very good (R^2 = .1255, not statistically significant). Nor does lagging the temperature help, the correlation gets worse with any lag.
Re: “…except a hat tip to Dave Burton and Willie Soon”
Thank you, Willis, but I believe that the comparison is from Warren Meyer via Burt Rutan and Anthony Watts at WUWT, back in 2013:
https://wattsupwiththat.com/2013/08/20/when-somebody-hits-you-with-that-new-ipcc-is-95-certain-talking-point-show-them-this/
http://www.sealevel.info/1895-1946_1957-2008_temperature-compare.png
Those graphs are of temperatures, only. But in the fifty years covered by the 1895–1946 graph CO2 rose by 15 ppmv (5.3%), and in the fifty years covered by the 1957–2008 graph CO2 rose by 70 ppmv (22.5%).
I do not doubt that rising CO2 level contributed to warming, but the similarity of the two graphs, despite the dissimilarity of the two CO2-forcings, obviously doesn’t support the case for CO2 being the “principal control knob” for climate.