Astronauts on the International Space Station may be at risk during long missions
THE WORSENING COSMIC RAY SITUATION: Cosmic rays are bad–and they’re getting worse. That’s the conclusion of a new paper just published in the research journal Space Weather. The authors, led by Prof. Nathan Schwadron of the University of New Hampshire, show that radiation from deep space is dangerous and intensifying faster than previously predicted.

The story begins four years ago when Schwadron and colleagues first sounded the alarm about cosmic rays. Analyzing data from the Cosmic Ray Telescope for the Effects of Radiation (CRaTER) instrument onboard NASA’s Lunar Reconnaissance Orbiter (LRO), they found that cosmic rays in the Earth-Moon system were peaking at levels never before seen in the Space Age. The worsening radiation environment, they pointed out, was a potential peril to astronauts, curtailing how long they could safely travel through space.
This figure from their original 2014 paper shows the number of days a 30-year old male astronaut flying in a spaceship with 10 g/cm2 of aluminum shielding could go before hitting NASA-mandated radiation limits:

Galactic cosmic rays come from outside the solar system. They are a mixture of high-energy photons and sub-atomic particles accelerated toward Earth by supernova explosions and other violent events in the cosmos. Our first line of defense is the sun: The sun’s magnetic field and solar wind combine to create a porous ‘shield’ that fends off cosmic rays attempting to enter the solar system. The shielding action of the sun is strongest during Solar Maximum and weakest during Solar Minimum–hence the 11-year rhythm of the mission duration plot above.
The problem is, as the authors note in their new paper, the shield is weakening: “Over the last decade, the solar wind has exhibited low densities and magnetic field strengths, representing anomalous states that have never been observed during the Space Age. As a result of this remarkably weak solar activity, we have also observed the highest fluxes of cosmic rays.”
Back in 2014, Schwadron et al used a leading model of solar activity to predict how bad cosmic rays would become during the next Solar Minimum, now expected in 2019-2020. “Our previous work suggested a ~ 20% increase of dose rates from one solar minimum to the next,” says Schwadron. “In fact, we now see that actual dose rates observed by CRaTER in the last 4 years exceed the predictions by ~ 10%, showing that the radiation environment is worsening even more rapidly than we expected.” In this plot bright green data points show the recent excess:

The data Schwadron et al have been analyzing come from CRaTER on the LRO spacecraft in orbit around the Moon, which is point-blank exposed to any cosmic radiation the sun allows to pass. Here on Earth, we have two additional lines of defense: the magnetic field and atmosphere of our planet. Both mitigate cosmic rays.
But even on Earth the increase is being felt. Spaceweather.com and the students of Earth to Sky Calculus have been launching space weather balloons to the stratosphere almost weekly since 2015. Sensors onboard those balloons show a 13% increase in radiation (X-rays and gamma-rays) penetrating our planet’s atmosphere:
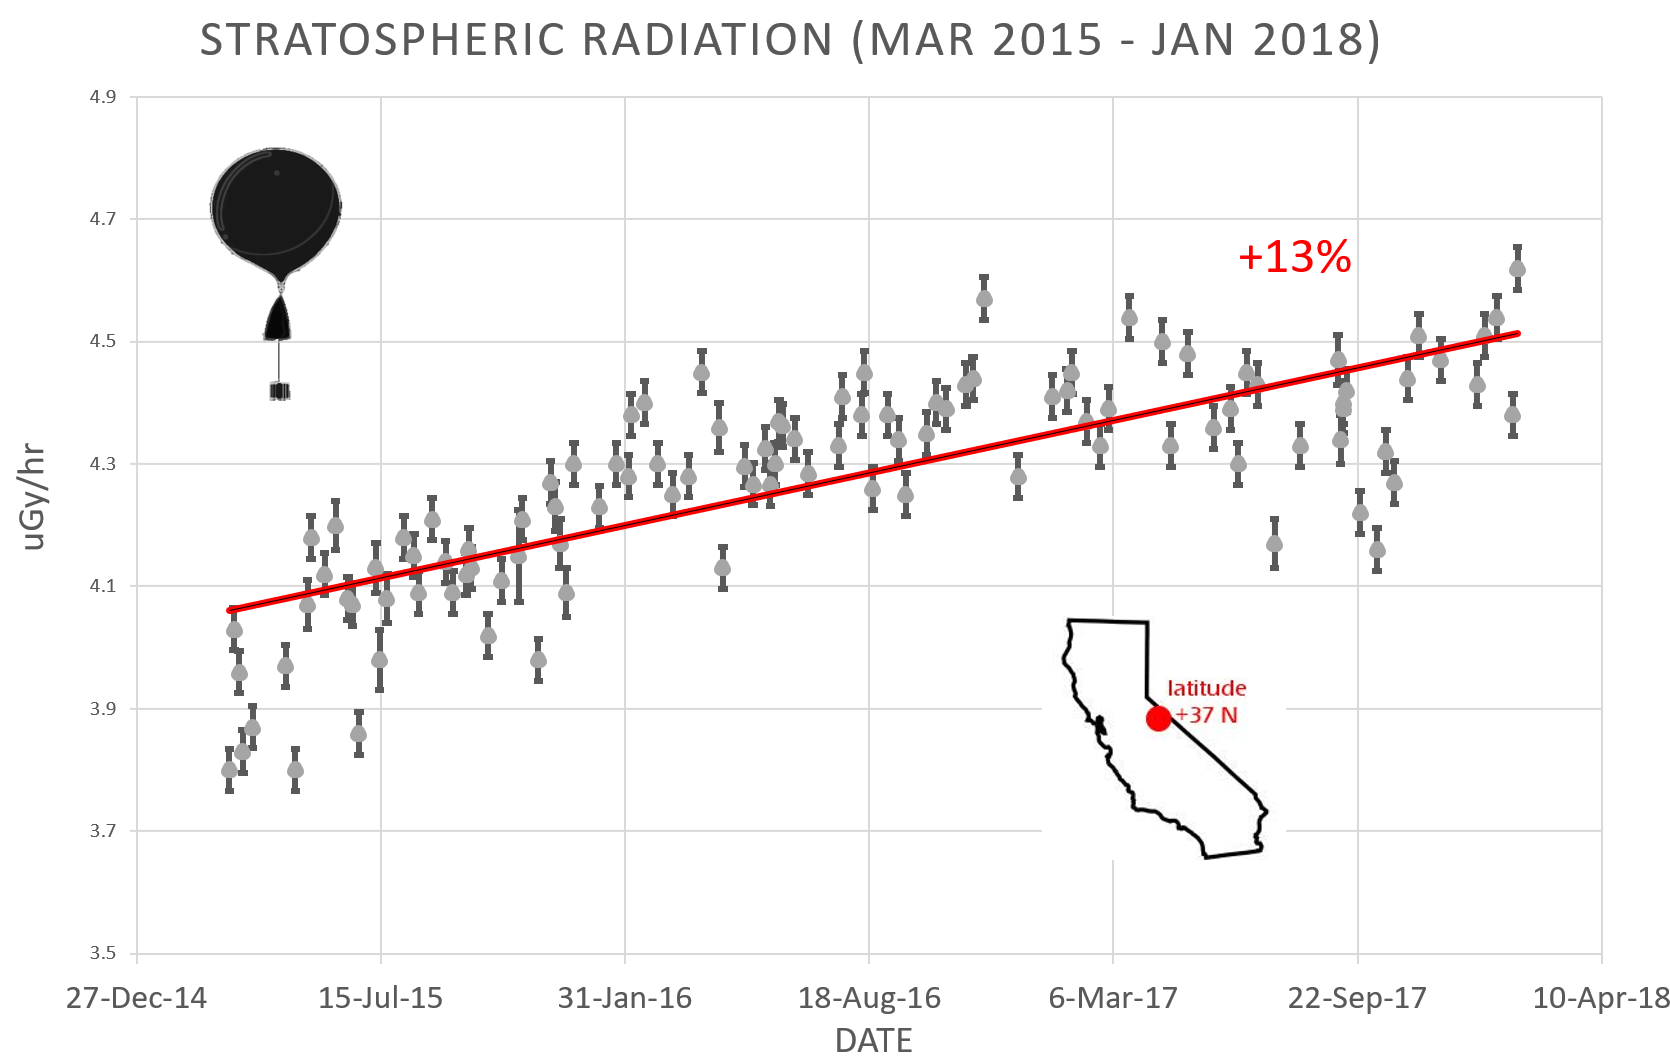
X-rays and gamma-rays detected by these balloons are “secondary cosmic rays,” produced by the crash of primary cosmic rays into Earth’s upper atmosphere. They trace radiation percolating down toward our planet’s surface. The energy range of the sensors, 10 keV to 20 MeV, is similar to that of medical X-ray machines and airport security scanners.
How does this affect us? Cosmic rays penetrate commercial airlines, dosing passengers and flight crews so much that pilots are classified by the International Commission on Radiological Protection as occupational radiation workers. Some research shows that cosmic rays can seed clouds and trigger lightning, potentially altering weather and climate. Furthermore, there are studies ( #1, #2, #3, #4) linking cosmic rays with cardiac arrhythmias in the general population.
Cosmic rays will intensify even more in the years ahead as the sun plunges toward what may be the deepest Solar Minimum in more than a century.
From NASA Spaceweather
It’s the usual ‘worse than we previously thought’.
Nit Pickers …How about wave particle duality??
These are all phenomena we knew NOTHING about before. No doubt many major climate changes happened while we were unaware of them. The climate activists take this to mean that there was NO change at all until humans started putting CO2 out – upon which all these phenomena started happening….
just a wee question:
Are the ‘radiation levels’ mentioned, based on the Linear No Threshold ratings, or the Hormesis approach to ‘safe’ levels???
This would have seemed to be better news back when comic book writers posited that cosmic rays could turn you into a superhero.
Replying to myself as Willis’s comment is too far down the tree…
Genuine question: is a cloud signal big enough to alter the climate big enough to show in the data? I can imagine it would be pretty damped in terms of temperature, but cloud amounts should respond quicker. However, the change you are looking for is a couple of percent in albedo, IIRC, and do we have data that chops that finely? Satellites possibly?
Then there’s the fact that different cloud layers affect temperature differently. The ones that do the heavy lifting are in the two to three thousand feet boundary layer above the oceans, low level stratus and stratocumulus. Maybe the amount of cloud at different levels responds differently to different stimuli. Can we detect changes in three-dimensional cloud structure? I’m well out of date, but I recall the met officer (USian) at Goose Bay reporting something like ‘three tenths at two thousand feet, eight tenths at ten thousand feet,no precipitation’ while outside the snow drifted silently down and the base was wel socked in. The RAF met man at home used to stick his head out of the window, glance around and report the sky in octas (oktas?), probably with only a little more accuracy.
The albedo change we are looking for is tiny, so much so that when there was a proposal to alter low level cloud albedo by seeding aerosols the engineers knew they would have to produce a much greater effect than necessary to convince the politicians (not many scientists among politicians in the UK) that it was working.
So would it show?
While I’m here… Oil sheen. Aerosols. Reduced boundary layer cloud. Is the data good enough to show a 2% of less effect?
JF
(I’m not a natural nagger, in spite of the training at home, but I’ll get the hang of it eventually….)
Julian, there is data on global dimming and brightening due to fluctuating cloud cover and aerosol concentrations. ETH Zurich leads research in this. Overview and links here:
https://rclutz.wordpress.com/2017/07/17/natures-sunscreen/
Observed changes in surface solar radiation
Ron, thank you, it’s fascinating stuff and I’ll have to think about it.
quote
The spatially-averaged NSWR over the whole Mediterranean Basin was found to increase in MERRA by +0.36 Wm⁻² per decade, with higher rates over the western Mediterranean (+0.82 Wm⁻² per decade), and especially during spring (March-April-May; +1.3 Wm⁻² per decade). However, statistically significant trends in NSWR either for all-sky or clean-sky conditions are observed only in May. The increasing trends in NSWR are mostly associated with decreasing ones in cloud optical depth (COD), especially for the low (<700 hPa) clouds.
unquote
I've flown over the Med and we go to Spain every year so I have seen how polluted the surface is. My contention is that oil pollution is suppressing wave formation and hence the production of salt aerosols — fewer and less dense low level stratocu. Surface albedo would also be lowered. It's amazing how little oil is needed to smooth the waves — I've seen a small bay in Ibiza smoothed by just the sun tan oil on the bathers. The drift of oil sheen would tend to concentrate it at the Western end, but that's just me predicting after the event.
I have suggested that closed bodies of water exposed to city run-off etc will show anomalously high warming.
https://seawifs.gsfc.nasa.gov/OCEAN_PLANET/HTML/peril_oil_pollution.html
When your use of this info takes you eventually to the presentation in Oslo, will you invite me along? We won't invite Willis, he's had his chance.
JF
Cosmic Climate Change. As it has always done.
Jasper Kirby of CERN
To prove or disprove the role of cosmic rays in cloud formation, put your cloud chamber in a deep mine that cosmic rays cannot penetrate. Without ions and charged particles in your chamber, try to make clouds. I predict you will need lower than saturation temperature of water vapor to make clouds.
New study: Driving cars causes increased attacks from outer space!
Well, there was this young reporterette who asked if Global Warming was causing more asteroids and comets to hit the earth.
David L. Hagen March 6, 2018 at 10:50 am
Sorry, David, but that link doesn’t work for me despite repeated attempts … however, I did find the following:
This is in opposition to Svensmark in a couple of ways. Svensmark claims the effects take a full seven days to be seen … but this makes no sense, as the effect of the cosmic rays is immediate, as Harrison and Ambaum found.
They also cannot find any significant effect from larger or smaller Forbush events … not reassuring.
Next, I get very nervous when someone says something like this in the Svensmark abstract:
This reeks, REEKS of data sniffing, particularly given the extremely rare nature of large Forbush events.
Svensmark also says:
While I understand and use Monte Carlo tests, they are very, very tricky. You have to be able to generate pseudodata that corresponds to all of the statistical properties of real data, including the Hurst exponent, which is not always an easy task.
If you have a link to the study that actually works, I’d like to read it, but the abstract does NOT inspire confidence …
w.
PS—I also get very nervous when Dr. Nir Shaviv is an author of a paper, because he sees nothing wrong with claiming he’s found a solar-ocean connection in a paper without one scrap of solar data or measurements … see here for details.
PS—Finally got the link to work on the fifth try … go figure. More comments to follow.
w.
First comment: they do not adjust their statistical results for autocorrelation … I’m sorry, but that alone disqualifies the study.
Second comment: their SSMI data indeed shows a decrease in liquid water content … but in all of their graphs it starts dropping five to ten days BEFORE the Forbush Decrease. Time travel?
Third comment: the same is true for the ISCCP cloud data, it also starts dropping before the FD …
Fourth comment: the same is true for three of the four ISCCP cloud fraction datasets, it starts dropping before the FD …
Fifth comment: they’ve averaged the results from 3 to 13 days after the FD for their analysis … cherry picking, anyone? Why not 2-8 days, or any other choice?
Sixth comment: their PC analysis also starts dropping a few days before the FD. Are all of these involving time travel?
Sorry, amigo, but color me totally unimpressed with Svensmark’s FD analysis. Bad statistics plus time travel plus cherry picked time intervals doesn’t equal validation …
w.
Hmm, a progressive process, with monotonically dysfunctional results? Maybe, in a limited frame of reference. Maybe in the far-domain, but that is prophecy.
Must be from the ‘it came from outer space’ dept…
Bad and getting worse?
We’re doomed!
Cosmic Ray App (Google it) is written by me, runs on iPhones and iPads and detects cosmic rays! So now you can see them too. Take part in the cosmic ray observer project. http://cosmicrayapp.com
adrian smits March 6, 2018 at 8:39 pm
Unfortunately, there are a couple problems with the question.
First, your question assumes that there is absolutely no interaction between say temperature and clouds. However, in fact, there is a complex interrelationship between the two that cannot be simply teased apart.
Second, your question assumes cause and effect … there’s a Sufi story of interest here.
As the Mulla used to say, “Anyone looking for both cause and effect in the same story is a fool …”
Next, although it’s very easy to say things like “all other things being equal”, or the Latin equivalent “ceteris paribus”, in the real world all other things are NEVER equal.
Finally …
Sorry if this is less than satisfactory, but I fear that your question is simply not answerable in its current form.
w.
lsvalgaard March 5, 2018 at 3:51 pm
They forget [or omit…]
———————————-
As reported by, http://www.spaceweather.com/ today.
“”THE SUN IS BLANK: Sunspots are becoming scarce. So far in 2018, the sun has been blank–that is, without sunspots–for 33 days. That’s fully half of the time. Inspect the face of today’s sun:
http://www.spaceweather.com/images2018/08mar18/hmi200.gif
Could you find any dark cores? Answer: No. The last time the sun was blank more than 50% of the time was in 2009, near the end of the deepest Solar Minimum of the Space Age. Now the sun is entering a new Solar Minimum, and it is shaping up to be even deeper than before.
Periods of spotlessness are a normal part of the 11-year solar cycle. However, the current Solar Minimum may be remarkable as the ambient solar wind and its magnetic field are weakening to low levels never before seen in the Space Age. The flagging pressure of the solar wind, in turn, is allowing more cosmic rays to penetrate the solar system. These rays are being detected not only by NASA spacecraft in the Earth-Moon system, but also by space weather balloons in Earth’s atmosphere. Scroll down to the news item “The Worsening Cosmic Ray Situation” to read more about this phenomenon.””
Seems they might be omitting a few things. Or, is something up with this.
My bold, for emphasis.
Mario Lento March 7, 2018 at 11:32 pm
Mario, I can’t tell you how many people I’ve seen make this claim about enthalpy … but I can tell you how many of them I’ve seen back it up with actual analysis.
None … including you.
I’ve done the analysis. What it showed was that overall, enthalpy moves in lockstep with temperature and there was no gain by including it in calculations.
Your move …
w.
Willis,
I do believe you have done an analysis of “entropy”. That is irrelavent to what I wrote about enthalpy, which is related to heat in a system. My claim is that “temperature is not heat.” Further, various measurements of earth’s temperature alone at the timescales measure do not tell you how much heat there is, where it went and where it is stored.
In summary Willis, my claim does not need proving, as it is a fundamentally understood principle.
My bad, Mario, writing too fast and wrote “entropy” in place of “enthalpy”. Fixed now, and my point remains.
w.
Thx Willis: Stalemate or Checkmate, depending on our perspective. My statement, which I think needs no proof is that heat is not temperature. Are you saying you have proven that by measuring temperature, you can account for all the heat?
Mario Lento March 8, 2018 at 9:41 am
No. I’m saying that in measurements of natural climate variations, in general, enthalpy moves in very close synchrony with temperature. As a result, using total enthalpy in place of temperature does little except for making the calculations much more complex.
This makes physical sense, of course, because in general evaporation, and thus latent heat, is some function of temperature. As a result, the enthalpy calculation reduces to some function in the form of f(T, g(T)) …
My suggestion to you is to do what I did—find a location with measurements of both temperature and humidity, calculate total enthalpy, and see how well it tracks the temperature. I found that they generally move in lockstep, although of course YMMV … I used the formulas here, although there are others.
Best regards,
w.
Thank you for pointing out my misunderstanding of what you meant earlier regarding “latency and thermal capacitance are meaningless”. You clearly did not mean that.
As a skeptic, I do think you do great work, and as a scientist, which I consider you to be in the way you act and do work, I respect your work. I am not a scientist, but work in process control of many areas of science and physical systems. I think there are too many subtle nuances including imperfect data, and assumptions (related to this Planet) of what the imperfect data tells us. My skeptical side and understanding of how processes work, forces me to feel the need to point out principles which I see as significant issues. To measure heat, we need to know things that are not captured in the data, so to me temperature being used to track heat is, in my opinion, “almost” futile.
temperature being used to track heat is, in my opinion, “almost” futile.
Heat is measured by the change in temperature, so using changing temperature to track heat is very sensible
Leif wrote: “temperature being used to track heat is, in my opinion, “almost” futile.
Heat is measured by the change in temperature, so using changing temperature to track heat is very sensible”
That is an incomplete strawman argument. Heat is not temperature as you know. Of course your statement alone is a general reasonable statement, but is sidetracks from my correct statement. We need to know other things to calculate heat. I submit, to hold those other things as constant and known, as you posited in prior posts, proves my point. They are neither constant or known in the timescales needed. This is circular reasoning.
“The quantification of heat via the temperature change of a body is called calorimetry, and is widely used in practice.”
Heat is not a property of a body but is indicated by the change of temperature, which then is a very good measure of heat. When you have a fever, how do you measure that? with a thermometer. That is the way it is done, and there are no subtle aspects about this.
Come on Leif: In your example, you need to take the temperature while your mouth is closed, to prevent the cooling causes by your open mouth cooling in response to the latent heat energy changing due to evaporation and heat transfer from cool air entering your mouth. That measurement is a controlled process. We can not do that with the atmosphere. In your example, you can tell the temperature of the exhaust in a combustion engine by measuring the the water temperature in the cooling system. No mechanic would agree that it is possible to know the exhaust temperature by measuring the water temperature.
For the atmosphere, the temperature is a good measure, because other variables change so little when averaged over 30 years. Now, your contention is that temperature is useless, so measure the enthalpy [or whatever] and use that as an indicator for global warming, if you can, and show a figure with the result. People that measure heat content [be careful: heat content (a bodily property) is not the same as heat (not a property)] use temperature to do that. Nothing wrong with that, perfectly fine.
By the way ‘heat transfer’ is meaningless, as heat IS the transfer. Perhaps you meant ‘energy transfer’, but heat and energy are not the same.
I am not suggesting we should measure something like enthalpy, I am saying because of the reality that temperature is not heat. Further that temperature measurements in discrete points of time (which is the topic of discussion) cannot be used to show a net increase or decrease in heat of the planet without knowing where the heat went.
Heat is a form or energy, and yes I meant heat changing forms of energy such that at a given temperature, the amount of energy in a system can vary wildly by up to 2 orders of magnitude.
Heat is a form of energy,
No, not at all. Heat is the transfer of energy. Even wikipedia knows that: https://en.wikipedia.org/wiki/Heat
Some cause of confusion may be that ‘heat’ in English is often [and perhaps wrongly] used for both heat-content [i.e. energy] and energy transfer [i.e. heat]. In most other languages that confusion does not arise as two different words are used: one for the heat content and another one for heating [the process of transferring energy]
I always learn something from brilliant minds, and so thank you!. I meant Heat as in the total energy of molecular motion in a substance, while temperature is a measure of the average energy of molecular motion in a substance.
Heat as in the total energy of molecular motion in a substance,
It is hard to be precise. What is meant by ‘molecular motion’. If I drop a stone the molecules in it certainly moves [down to the ground], but that is not heat [until the stone hits the ground]. So you mean the random motion, but the molecules can also vibrate, and in the end all those motions make up the internal energy of the substance, which happens to be proportional to its absolute temperature [via Boltzmann’s constant]. So temperature is very useful: that is what we can actually measure.
See e.g. https://en.wikipedia.org/wiki/Microstate_(statistical_mechanics)
Yes, and thank you Leif! The amount of energy in the stone is proportion to the average temperature of that stone and the heat capacity of the material. With air it’s more complex, since it depends on the state of the components. water droplets at a temperature hold a vastly different amount of energy than water in gaseous state at the same temperature. So knowing the temperature depends on what (including its state) and how much of that is being measured. Am I wrong here?
In other words, temperature alone does not tell you how much energy there is in what is measured.
Am I wrong here?
I think so, because the various gases are in thermal equilibrium because of collisions. There are not different temperatures for the Nitrogen, the Oxygen, the Argon, the Dihydrogenoxide, and the CarbonDioxide.
Makes sense, just water is the one hole in this. Water depends. And the subject here is that of changes in state of water. If there is a net change in water state due to GCR, then that might be measurable and might lead to some interesting science.
Water is a bit special, but it really doesn’t matter. The water in your pipes freezes at 32F regardless of the humidity of the air. The various properties of water in the end still determine its contribution to the air temperature, which is the macrostate property we are interesed in. Temperature is a simple, and useful, measure of all that.
But the make up of clouds is not known based on temperature. What is the state… little ice crystals or water vapor, or water droplets.
But where and when they form is very dependent of temperature and in turn influences the temperature. There is also a good correlation between temperature and clouds both ways [I think that Willis looked into that]. If you make any claims about this, you must be specific, not just wave you hands and think it is ‘interesting’ science. There is no correlation between cloudiness and GCRs. Lots of cliams, but nothing believable or compelling.
I recall reading years ago, Willis’ excellent following of clouds as regulating temperature into space. Reminded me, somewhat at the time, of the Iris Effect by Lindzen… but different.
If there is no delta cloud cover related to GCRs then OK. I thought that there was some work done to show effect on how and where clouds form as related to GCRs. Thank you for engaging with my hand waving, which is what I do.
Just FYI…
(Copying below (in parts to try to avoid the spam bin –grr), with a few edits, a comment I made in October, 2014, here: https://wattsupwiththat.com/2014/10/17/climate-dialogue-about-the-sun/#comment-1766295 )
I. Model Simulations re: Solar Radiation and UV Are Largely Inconclusive
Comment: {thus, anyone asserting that he or she knows that UV does NOT affect climate significantly is not in line with current science}
[Source: Atmos. Chem. Phys., 13, 3945–3977, p. 1 (Abstract) (2013) –
emphasis mine
Link: http://www.atmos-chem-phys.net/13/3945/2013/acp-13-3945-2013.pdf CITED IN: https://wattsupwiththat.com/2013/10/28/solar-spectral-irradiance-uv-and-declining-solar-activity/%5D ]
(continued – 2)
II. UV Photochemistry – Atmospheric Chemistry – Climate Implications
A. Source: http://onlinelibrary.wiley.com/doi/10.1029/2007JD009391/abstract;jsessionid=F260393BA633AC61CE096310650A8316.f04t03
Comment:
I could not locate the above paper where it was offered for free (only made a quick attempt to search online). TO DO: See if Gray (or other co-author) posted it on a personal research site such as Leif S. does on his. – Note: Apparently (as of paper’s date of 2008), NO one has evidence, i.e., data/experiments, that proves UV-ozone – climate mechanism. That is: at this point, there are ONLY MODELS, programmed with accurate but inadequate variables (too little known to establish cause-effect).
*************************************************
B. Source: Gray et al. 2010
Gray, L.J., J. Beer, M. Geller, J.D. Haigh, M. Lockwood, K. Matthes, U. Cubasch, D. Fleitmann, G. Harrison, L. Hood, J. Luterbacher, G.A. Meehl, D. Shindell, B. van Geel, and W. White, 2010: Solar influence on climate. Rev. Geophys., 48, RG4001, doi:10.1029/2009RG000282.
http://pubs.giss.nasa.gov/docs/2010/2010_Gray_etal_1.pdf
1. Abstract – with my edits — (this paper IS available – I summarize it below, with emphases, the abstract)
(continued – 3)
2. Paper (via the above-linked .pdf) Summarized (with my comments)
Introduction
UV – Ozone
1) … UV … has a relatively large 11 year SC variation, as shown in Figure 3 (bottom). Variations of up to 6% are present near 200 nm where oxygen dissociation and ozone production occur and up to 4% in the region 240–320 nm where absorption by stratospheric ozone is prevalent. [Gray, et. al., at 4]
************************************
2) At stratospheric heights Figure 3 shows a variation of ∼6% at UV wavelengths over the SC. This region of the atmosphere has the potential to affect the troposphere immediately below it and hence the surface climate. … The direct effect of irradiance variations is amplified by an important feedback mechanism involving ozone production, which is an additional source of heating… [Haigh, 1994; see also Gray et al., 2009].’ [Id. at 5]
Comment: Questions: 1. What is the evidence that establishes: (1) the nature of; and (2) the significance to climate of the UV-ozone mechanism? 2. What EVIDENCE refutes the hypothesis that UV significantly affects climate?
****************************************
3) … we acknowledge the possibility that short‐term processes which occur repeatedly may lead to an integrated longer‐term effect. [Id. at 6]
Comment: Q’s: Any evidence of long-term effect? Any evidence DIS-proving long-term effect?
4) UV — Measurement
Work at present is aimed at improving our knowledge of the short UV wavelengths, which is required for accurate modeling of irradiance absorption in the stratosphere and upper atmosphere (see Figure 3). Improvements made to date suggest that UV irradiance during the Maunder Minimum was lower by as much as a factor of 2 … . However, this work is still in its infancy. The model estimates match observed spectra between 400 and 1300 nm very well but begin to fail below 220 nm… . [Id. at 9]
Comment: Thus, Mario, your measured “perhaps” and I believe there is likely to be – type language above is far more in line with the current state of the science than over-confident assertions that changes in UV almost certainly do NOT affect climate. We just don’t know. Your being curious and open is good and shows scientific integrity.
*******************************************
5) Ozone – Upper Stratosphere
Ozone is the main gas involved in radiative heating of the stratosphere. Solar‐induced
variations in ozone can therefore directly affect the radiative balance of the stratosphere with indirect effects on circulation. Solar‐induced ozone variations are possible through[:]
(1) … UV spectral solar irradiance, … modifies the ozone [Id. at 12] production rate through photolysis of molecular oxygen, primarily in the middle to upper stratosphere at low latitudes [Haigh, 1994][;]
(2) changes in the precipitation rate of energetic charged particles, which can indirectly modify ozone concentrations through changes in the abundance of trace species that catalytically destroy ozone, primarily at polar latitudes [e.g., Randall et al., 2007][; and
(3)]… transport‐induced changes in ozone … [from] indirect effects on circulation caused by the above two processes. … On the 11 year time scale, the mean irradiance near 200 nm has varied by ∼6%, over the past two solar cycles … [Id. at 13]
In the upper stratosphere where solar UV variations directly affect ozone production rates, a statistically significant response of 2% – 4% is evident. … The density‐weighted height integral of ozone at each latitude gives the “total column” ozone, and a clear decadal oscillation in phase with the 11 year solar cycle is evident in both satellite data … The ozone response in the lower stratosphere is believed to be the main cause of the total column ozone signal because of the high number densities at those levels. [Id.]
Comment: So far, only lower stratosphere shows evidence of significant ozone signal. Q: What evidence is there that this is ultimately propagated to Earth’s climate? And, again, what evidence is there that this is impossible or insignificant v. a v. climate?
***********************************************************
6) General Comment Re: Attributing Causation of Climate
… correlation coefficients, which suggest a link but are not sufficient to indicate any causal mechanism. In addition, there is substantial internal variability in the climate
system,… . [However s]ince the climate system may react in a nonlinear way the response function can be quite different from the forcing function… [Id. at 24]
(continued – 4)
7) Re: Models and UV – Ozone Mechanism (hypothesis)
(1) Atmospheric models that include a good representation of the stratosphere, including interactive ozone chemistry, are available, but they do not generally include a fully coupled ocean at present. The prime solar mechanism for influence in these models is therefore the change in stratospheric temperatures and winds due to changes in UV irradiance and ozone production, and the influence on the underlying troposphere and surface climate involves stratosphere‐ troposphere coupling processes. This mechanism is often referred to as the top‐down mechanism … .” [Id. at 24-25]
(2) … latent heat flux anomaly across the air‐sea interface of ∼0.5 W m−2, which was larger than the direct solar radiative forcing by a factor of ∼3 and also explained the correct phase of the response. This therefore represents a different kind of amplification of the 11 year solar cycle and is not associated with changes in trade wind strength or cloud cover since these did not have the correct magnitude or phase. This result implies a role for the top‐down influence of UV irradiance via the stratosphere. White et al. [2003] also noted [however] that time sequences of tropical tropospheric temperatures lead those in the lower stratosphere, which appears to argue against the top‐down influence. They suggest, however, that this should not be interpreted as a tropospheric signal forcing a stratospheric response because the stratospheric temperature response appears to be in radiative balance and hence is in phase with the 11 year solar cycle, while the troposphere responds to anomalous heating and advection which peaks during the period leading up to solar maximum and not at the maximum itself. This is a good example of the difficulties and dangers of interpreting observed signals from different parts of the atmosphere and especially in using their time response to try to infer cause and effect. [Id. at 26]
******************************************************************
8) Stratospheric — Tropospheric UV – Ozone Feedback Mechanism
… by imposing idealized ozone changes taken from simple 2‐D chemistry models … demonstrated that the SC signal extended down into the troposphere, primarily at subtropical latitudes… [Id. at 27] However, they did not reproduce other features, such as the observed poleward and downward propagation of the signal at polar latitudes [Matthes et al., 2003] or the secondary maximum in the equatorial lower stratosphere (20–30 km). There is general consensus that this latter feature results from transport processes [Ed. i.e., horizontal, such as tradewinds, I believe. J.M.] … . More recent improved models … simulat[e] an improved vertical structure of the annual mean ozone signal in the tropics, … However, it is still not clear to which factor (SSTs, time‐varying solar cycle, or inclusion of a QBO) the improvements can be ascribed. … despite these general improvements, there are many details that are not reproduced by models. Further studies, including fully coupled ocean‐troposphere‐stratosphere models with interactive chemistry, will be required to improve the simulated ozone signal and distinguish between
the various influences. [Id. at 27-28]
(continued – 5)
9) Stratosphere – Troposphere Coupling Mechanisms
… at equatorial latitudes Salby [HURRAH FOR SALBY — yes, he DESERVES a cheer! :)] and Callaghan [2005] identified an interaction between the stratospheric B‐D circulation and the tropospheric Hadley circulation … but again, this does not provide a chain of causality. [Id. at 29] There are many proposed mechanisms for a downward influence from the lower stratosphere into the troposphere … response in tropical vertical velocity was not uniformly distributed in longitude but was largest over the Indian and West Pacific oceans, … despite having imposed SSTs, suggesting that their tropospheric signal was a response to changes in the stratosphere and not to the bottom-up mechanism of TSI heating of the ocean surface … .
This would be consistent with the results of Salby and Callaghan [2005] (see Figure 25), whose analysis suggested that the stratosphere and troposphere are linked by a large‐scale transfer of mass across the tropopause resulting in a coupling of the B‐D circulation in the stratosphere and the tropical Hadley circulation in the troposphere.
[Id at 30]
Much work is still required to fully characterize the nature of these complicated interactions and hence to verify these mechanisms. …
Comment:
In a way… this is all just a BIG WASTE OF TIME – EXCEPT… it must be done to refute (even though they have not come even close to meeting the burden of proof which IS theirs) the AGWers. Unless humans are likely (LAUGH-OUT-LOUD) to produce even 10% of the net CO2 or aerosols or what-EVER hypothesis the Envirostalinists would seize upon to control the economies of the world, WHO CARES? We cannot do a THING to alter the course of the climate of the EARTH. Now, of course, to the extent that such research would help us plan aviation or aerospace or outer space ventures or would aid in planning shipping on the oceans or other practical applications, then, more power to all the hardworking, genuine, scientists. And no matter what, of course basic science is always good – but, when public (what is done with private funds is only the business of the owner of those funds) funding is involved, how about focusing on a few more important areas of study? E.g., nuclear power efficiencies or a cure for diabetes or cancer treatment…
10) UV –Ozone Mechanism v. ENSO (El Niño Southern Oscillation)
UV‐ozone feedback mechanism appears to cause enough heating near the tropical tropopause to significantly affect the tropical hydrologic cycle, with regional impacts on precipitation that are also broadly similar to those related to ENSO changes… . [Id. at 33]
Comment: It may be entirely ENSO which is the controlling forcing. Q: Is the relative strength of ENSO v. UV-solar precipitation forcing known?
*********************************************************************
End of Janice’s Summary of Gray, et. al. (and others above)
(from this October, 2014 comment: https://wattsupwiththat.com/2014/10/17/climate-dialogue-about-the-sun/#comment-1766295 )
I apparently was mistaken, Mr. Eschenbach. Thank you for bringing that to my attention. I thought GCR’s and atmospheric chemistry (and some physics) were related topics vis a vis clouds and climate, etc..
I’m surprised to see you characterize my fairly well organized, orderly, summary of Gray, et al. as merely a “mish mash,” but, I take it that your key point is that my bringing Gray, et al. into the discussion here was unhelpful at best (and, apparently pretty irritating).
I apologize for the mistake.
Janice Moore March 8, 2018 at 5:56 pm
Janice, I have exactly zero idea what your point was in all of that. How about telling us in two or three sentences what you conclude from that total mish-mash of quotes and links and ???
Thanks,
w.
And (sigh) another mistake. My reply was mis-posted, here: https://wattsupwiththat.com/2018/03/05/nasa-cosmic-rays-hitting-earth-are-bad-and-getting-worse/comment-page-1/#comment-2760715
Janice Moore March 8, 2018 at 6:48 pm
Oh, please, get off your high horse. I said nothing of the sort.
One thing I’ve learned in writing for the web is that in general, the author is the WORST person for judging whether their writing is “well organized” or “orderly” … in this case, I’m sorry, but your comments were neither well organized nor orderly, and your main point(s), whatever they might have been, were buried so deeply I had and still have no idea what they were.
Really? I have the courtesy to ask you to summarize your ideas so we can all discuss them, and you think this is me saying you are unhelpful and irritating? Where did I say anything even remotely like that? If I were to think you were unhelpful and irritating, don’t worry, you’d know about it loud and clear—as you know I’m not a man to mince words … BUT I DIDN’T THINK THAT!
Cut the snark, it just makes you look vindictive and petty, and explain in simple terms what you are trying to get across. I’m interested … but the way you’re going, my interest is flagging fast …
w.