Guest post by David Middleton
Some people look forward to the Oscars, others look forward to the Super Bowl… I look forward to the U.S. Energy Information Administration’s Annual Energy Outlook (AEO)… Kind of like Navin Johnson looked forward to the new phone books…
Well… AEO 2018 was no disappointment!
ANNUAL ENERGY OUTLOOK 2018
Full Release Date: February 6, 2018 | Next Release Date: February 2019 | full report
EIA’s Annual Energy Outlook provides modeled projections of domestic energy markets through 2050, and it includes cases with different assumptions regarding macroeconomic growth, world oil prices, technological progress, and energy policies. Strong domestic production coupled with relatively flat energy demand allow the United States to become a net energy exporter over the projection period in most cases. In the Reference case, natural gas consumption grows the most on an absolute basis, and nonhydroelectric renewables grow the most on a percentage basis.
Even though Obama is out and energy dominance is in, they still feel the need to throw a bone to wind & solar:
In the Reference case, natural gas consumption grows the most on an absolute basis, and nonhydroelectric renewables grow the most on a percentage basis.
After downloading the PowerPoint and some of the Excel workbooks, I put together a summary of some key points.
Primary Energy Consumption: Fossil Fuels Dominate the Future!

While it may be true that “nonhydroelectric renewables (renewables in the table below) grow the most on a percentage basis,” growing from 7% to 12% ain’t much to brag about. Units are in quadrillion Btu (quad) and percent of total consumption:
| 2017 (quad) | 2017 (%) | 2050 (quad) | 2050 (%) | |
| Petroleum | 37.5 | 38% | 37.4 | 34% |
| Natural Gas | 27.6 | 28% | 35.6 | 32% |
| Coal | 14.2 | 14% | 13.2 | 12% |
| Nuclear | 8.3 | 8% | 6.6 | 6% |
| Renewables | 6.4 | 7% | 13.5 | 12% |
| Hydro | 2.7 | 3% | 2.8 | 3% |
| Biofuels | 1.5 | 2% | 1.5 | 1% |
| Total | 98.2 | 100% | 110.6 | 100% |
Note that coal consumption barely declines, petroleum stays about the same and natural gas skyrockets (86’ing the Clean Power Plan was a most excellent move by President Trump). When I lump fossil fuels together, things really get cool:
| 2017 (%) | 2050 (%) | |
| Fossil Fuels | 81% | 78% |
| Nuclear | 8% | 6% |
| Renewables | 7% | 12% |
| Hydro | 3% | 3% |
| Biofuels | 2% | 1% |
| Total | 100% | 100% |
In other good news, the U.S. will continue to “green the planet” at a decent pace:

| 2017 Gt CO2 | 2050 Gt CO2 | |
| Petroleum | 2.344 | 2.156 |
| Natural Gas | 1.442 | 1.860 |
| Coal | 1.334 | 1.250 |
| Total | 5.120 | 5.266 |
Electricity Generation: Natural Gas Baby!

I used the data browser to break wind, offshore wind, solar PV and solar thermal out of the renewables category and found the following:


With virtually no installations of offshore wind power over the next 33 years, it looks like most Atlantic and Pacific coast governors will be disappointed.

Special Feature: Milton Friedman on Energy in 1978
Same as it ever was…
Same as it ever was…
Just as true today as it was 40 years ago. Milton Friedman…Truly… Once in a lifetime (H/T to The Talking Heads).
Addendum: Comparison of past AEO forecasts with actual oil & gas production
A comment by Lorne White included a link to a Post Carbon Institute discussion of the AEO forecast.
The Energy Information Administration (EIA) of the U.S. Department of Energy is about to release its Annual Energy Outlook (AEO) 2018, with forecasts for American oil, gas, and other forms of energy production through mid-century. As usual, energy journalists and policy makers will probably take the document as gospel.
That’s despite the fact that past AEO reports have regularly delivered forecasts that were seriously flawed, as the EIA itself has acknowledged. Further, there are analysts inside and outside the oil and gas industry who crunch the same data the EIA does, but arrive at very different conclusions.
The last few EIA reports have displayed stunning optimism regarding future U.S. shale gas and tight oil production, helping stoke the notion of U.S. “energy dominance.” No one doubts that fracking has unleashed a gusher of North American oil and gas on world markets in the past decade. But where we go from here is both crucial and controversial.
The most comprehensive critiques of past AEO forecasts have come from earth scientist David Hughes, a Fellow of Post Carbon Institute (note: I, too, am a Post Carbon Institute Fellow). Since 2013, Hughes and PCI have produced annual studies questioning EIA forecasts, based on an analysis of comprehensive play-level well production data. Their latest report, a critical look at AEO2017, is just out…
Past AEO forecasts were not “seriously flawed” because reality diverged from the forecasts. The explosion of oil & gas production was simply not predicted by the EIA.
The EIA conducts “post mortem” analyses of their forecasts and makes the results available to the public. I downloaded two Excel files for AEO crude oil and natural gas production. The most striking thing is that the “shale boom” came out of nowhere in the eyes of the EIA.


These forecasts only work from conditions that are known at the time they are generated.
Back to the Post Carbon Institute discussion:
“Shale Reality Check: Drilling Into the U.S. Government’s Rosy Projections for Shale Gas & Tight Oil Production Through 2050” explores four big questions crucial to the realization of the EIA’s forecasts:
-
How much of the industry’s recent per-well drilling productivity improvement is a result of better technology, and how much is due to high-grading the best-quality parts of individual plays? Over the past few years, industry has shown the ability to extract increased amounts of oil and/or gas from each well. This has been achieved in part by drilling longer horizontal laterals, tripling the amount of water and proppant (usually sand) used per unit of well length, and increasing the number of fracking stages. It is also in part a result of “high-grading,” or focusing drilling on the best-quality parts of each play (termed “sweet spots” or “core areas”). The decline in average well productivity observed in parts of some plays, despite the application of enhanced technology, suggests that sweet spots there are becoming saturated with wells. When this happens, drillers must either move to lower-quality rock outside of sweet spots, or drill wells too close together, which results in well interference or “frac hits” and reduced well production.
-
Can technological advancement in the industry continue to raise productivity indefinitely? If, as the EIA suggests, improved technology will continue to increase well production, then perhaps per-well productivity can continue to grow for some time. However, based on the analysis of recent data, Hughes questions this (as does a team of MIT researchers). Well productivity is already declining in some plays, despite the application of enhanced technology, indicating that technology and high-grading have reached limits. Given uniform reservoir quality, improved technology allows the resource to be extracted more quickly with fewer wells, but it does not necessarily increase the overall amount of resource that can be recovered.
-
What will be the ultimate cumulative production from all U.S. tight oil and shale gas wells? Taking the above points into account, Hughes concludes from a detailed analysis of production data that the EIA is making extremely optimistic assumptions about ultimate production and long-term production rates in most shale plays. Production over the long term is likely to be fraction of what the EIA is forecasting.
-
What about profitability? So far, overall, the industry has lost money on tight oil production, and shale gas has done little better. That’s even with most recent drilling being focused in core areas. The industry and its investors assume that if productivity continues to increase, and oil prices rise, profitability will eventually materialize. But what levels of oil and gas prices would be required to profitably extract fuels in the large non-core areas that the EIA assumes will eventually be tapped after “sweet spots” are drilled and exhausted? The AEO offers little in the way of realistic analysis on this point.
Most of the productivity improvement has been through cost reduction, much of it falling on oilfield service companies.


Natural gas prices have ranged from $2.60 to $3.40/mmbtu over the past year. If natural gas prices fall, less wells get drilled, supply declines, prices rise, more wells get drilled. If demand for natural gas drives the price up too high, coal becomes more competitive with gas and coal-fired power plants operate at a higher utilization rate.
If natural gas prices evolve in a totally different manner than the EIA forecast, the mix of natural gas and coal will evolve differently. No one can predict how quickly technology will improve and reduce costs.
EIA’s reference case for natural gas prices brings most gas plays above breakeven. Even in their “high oil & gas resource & technology” case, the Marcellus generally stays above breakeven.

In the event that the Marcellus craps out or that technological advances stall, natural gas prices would likely rise to the point that 3 BCF blips in the Gulf of Mexico would become economic. The “price mechanism” works, just ask Milton Friedman.
Why the gradual drop in residential power consumption? Higher efficiency? Fewer households?
I see a gradual drop in CO2 emissions for residential power. Probably a transition to natural gas.
Replacement of out of date housing stock with newer product as well as multifamily taking some ground from single family is my guess. Also newer more efficient equipment replacing older equipment at the end of the life cycle will have an effect as well.
Higher prices force low income household to use less. That must be their rationale. Smart world will use lots of per capita power.
MarkW:
Some speculation here: but, the last time I chased EIA sources and components for their numbers; “Other Renewables” is composed substantially of estimated home installed solar energy generation. Especially, for home solar hot water installations.
Calculating estimated home solar energy usage should be treated as accounting where what is added to the “Other Renewables” numbers lowers home energy usage.
Nor could I locate where EIA verifies their estimates. Once a home solar system gets installed, it’s forever. Such amazing durability!
Providing for EIA number fakers an ideal situation(s). Anytime, “Other Renewables” needs a boost, all it requires is a revised estimate for how much energy a household derives from their solar installation.
I wouldn’t be surprised if EIA has home A/C energy demands run by solar for 2030-2050.
When you see how miniscule residential and commercial energy usage is, why do we seem to be the main target of carbon taxes and strange energy saving schemes? Even if we all change all our lights from traditional to LED, and all our 80% efficient central heat to high efficient (95%), it will have approximately 0% impact on total energy usage or CO2 production.
Because there are lots of ways the government can annoy us into using less energy… Industry, not so much.
And they make us pay whether we like it or not. German homes pay industry refused.
Could some of ‘residential’ actually be ‘transportation’?
Well, markl, all those e-cars, Teslas, Voltas, Leafs, Ionics and the rest will get a fair chunk of power at home.
Some at work, too, no doubt.
So that looks reasonable to me.
Auto
Because politicians want you to feel the pain.
During a previous California drought, restaurants were mandated to stop giving out free glasses of water unless the customer asked for them. Now the Totalitarian Left in CA is proposing a $1,000 fine for servers who give out complimentary plastic straws.
None this makes (common) sense and it was never intended to.
It’s theater. It lets the politicians look like they’re doing something. It’s like security theater.
We lose our freedom in exchange for the illusion of safety.
Residential electricity consumption is about 1/3 of all electricity produced. It makes a difference, from that perspective.
But not so much if you compare it to Primary Energy consumption.
David Middleton, your opinion on this preview of the EIA Energy Outlook 2018 please, from the Post Carbon Institute:
http://www.postcarbon.org/eia-dont-peek-behind-that-curtain/
I think the Post Carbon Institute is in postpartum depression regarding the Clean Power Plan.
EIA’s track record shows that they have consistently underestimated recent US oil & gas production…
https://www.eia.gov/outlooks/aeo/retrospective/pdf/table_5.pdf
https://www.eia.gov/outlooks/aeo/retrospective/pdf/table_9.pdf
The EIA’s full catalog of “post mortems” can be found here: https://www.eia.gov/outlooks/aeo/retrospective/
not post-partum depression.
More like Stages of Grief — stuck simultaneously (like a superposition of quantum states) between 4 states of denial, anger, depression, and bargaining. Never getting to acceptance.
Their analysis of the reported limitations of fracking to produce a long lasting reserve of Natural Gas makes sense. It makes me wonder how I’ll heat my home in a decade as climate cools. Ditto for electricity as Nuclear plants die after reaching their Bad After dates, if Natural Gas generation isn’t available.
This is independent of PCI’s pro-CAGW viewpoint.
Frac’ing doesn’t “produce a long lasting reserve of Natural Gas”‘ or any other type of reserve.
Frac’ing increases the rate of recovey and the recoverable fraction of the gas in place. Nothing about their artcle makes any sense at all.
David Hughes employs analysis such as Kevin Thout’s 2013 work on infill spacing and the 2011 USGS assessment of the Marcellus. In other words, woefully obsolete research upon which to make future projections.
If you wish to gauge the caliber of Mr. Hughes efforts, spend 10 minutes to read the Executive Summary from his ‘Drilling Deeper’.
You will find therein his complete dismissal of the Permian’s potential, a call for a near term peak for the Marcellus (since exceeded), and completely ignoring the Utica.
Like IPCC climate projections, EIA energy projections aren’t worth much. The future remains unknowable.
Uh huh. Computer modelling out to 2050 is not very useful, colorful graphs though. Next years predictions maybe, 2025 at a stretch. 2050 would be more flukey than climate guestimates.
As opposed to Gorebal Warming… This sort of thing is actually more predictable, because it’s real. That said, the future really is undertain and the end is always near.
http://www.azquotes.com/picture-quotes/quote-the-future-is-uncertain-but-the-end-is-always-near-jim-morrison-35-40-25.jpg
LOL!
David, did you get as excited as this when the Astros won the world series?
Funny thing Fonz… I grew up in Connecticut and I am a life-long NY Mets fan. The Mets and the Astros were 1962 expansion teams… And I always hated the Astros… Until this year… Jose Altuve and George Springer rock even more than the EIA… 😉
Channeling Beavis and Butthead:
Heh, heh, he said, “break wind.” 🙂
apologize to those too young to get the reference.
I should be too old to get the reference… But…. I’m juvenile enough to fully appreciate it!
🙂
I guess I should have added, most geologists are (at least the ones I know)!
DM, like your review. Nat gas is an easy call, since with CCGT the thermal efficiency is 61% versus USC coal at 41(Turk in Arkansas) to 45% (best China). CCGT capital <$1500/kw and $4000/kw and >4 years to construct. No brainer.
That said, I have deep general mistrust of EIA. Two specific and well documented examples, guest post True Cost of Wind over at Judith Curry’s Climate Etc., and Essay Matryoshka Reserves in ebook Blowing Smoke comcerning the Bahzenov shale. The latter you would probably appreciate as an oil geologist. Got lucky, found key Russian geophysical data with partial English translations and English paper discussions. All footnoted/hot linked.
The only real question with natural gas is the durability of the Marcellus… The data indicate that the Marcellus won’t disappoint.
Wonder if there will ever be any drilling in New York?
Yah, agree. Recovery now over 15% is fantabulous. My,own guess ia that with frack an perf technology plus more proppant, marcellus will go toward 25%.
I really wish people would pull their heads out of their butts and maximize our fuel sources.
Electricity should be 100% coal, nuclear, hydro, with what ever renewable contribution is economically feasible.
Ground transportation needs to be CNG.
Save the oil for industrial use.
Free markets always prevail, eventually.
Eventually, the value of petroleum as a chemical feedstock will exceed it’s value as a transportation fuel.
Both industries will continue to compete for petroleum resources for a long time. Both industries will also evolve in response to unknown future technological revolutions.
Why? It’s not like there aren’t alternatives to oil for industrial uses as well.
Wind generation plateaus in 2023? We’ve harvested all the wind we can? Not that i’m a fan, but what happens in 2023?
I see no category for petroleum, is that lumped in with “natural gas”?
I like the normalization chart because it shows who’s projected to gain and who is dropping back. Looks like projected solar and “other” is squeezing out coal, while NG is also slightly projected to grow. It appears they don’t care much for the future of nuclear.
“Predictions are hard to make,especially about the future.” Yogi Berra
Petroleum is in the primary energy section, not electricity generation.
The full suite of data is at the link provided.
Thanks, I went back and caught that myself. I was still thinking “energy” not electricity.
Thank you, and yes, I always try to read the background reports first, until I start nodding off then I come back the summary.
The basic assumption will be that wind plateaus in price, and that the available sites have been occupied in the next 5 years. The assumption will also be that solar continues to decrease in price so that if you have a choice of wind or solar you choose solar. However, for a balanced portfolio that doesn’t quite make sense. It is likely that wind will come down from its current $.04-.05/kWh to ~$0.02/kWh and that taller towers and larger blades will increase the number of sites available. Then the ability of wind to produce at night without storage will be a plus.
Nice! Thank you Dave!
Perspective is important.
One wonders if Al Gore ever eat a meal cooked with, and was kept comfy with, renewable Dung?
In Fig. 4, what is “other renewables” (green line), which shows major growth?
It is not wind, solar, or nuclear (shown separately), and from numbers in Table 1, it is not hydro or biofuels.
“Other renewables” in Figure 4 consists of hydroelectric, geothermal and every other “renewable” other than wind and solar. But, I might want to make sure that I’m not double-counting solar PV. That curve doesn’t look right.
I used the wrong column for total renewables. I used the one for “all sectors” rather than electricity generation sector. I will update the graphs.
“I used the data browser to break wind,…”
LOL…..
I know… I just noticed that… LOL!
“Nurse”
(google Derick and Clive …… if you dare)
Hi,
I don’t see how coal holds up essentially equal to the current value (down from current 14.2 to 13.5).
The average age of coal-fired power plants is close to 40 years old. No way a majority of them won’t be shut down in the next 32 years. So that means a whole bunch are going to have to be built to stay even. I just don’t see it.
“Coal generation and production are significantly higher in the No CPP case, which otherwise applies the Reference case resource and technology assumptions, as the existing fleet of coal-fired generators can be more fully utilized and fewer coal-fired generators are retired. As a result, in the No CPP case, coal production stabilizes at about 900 MMst from 2025 through 2040. ” From their web site.
It also seems that coal-fired generators can be maintained and upgraded so will be around longer than the usual suspects predict.
Example: Coal plants installed mercury controls to meet compliance deadlines
{nice graphic}
https://www.eia.gov/todayinenergy/detail.php?id=32952
“From their web site.”
Oh, well. If it’s on the EIA website, it must be an accurate prediction.
It’s on their website because power plant operators have to file this form with the EIA…
https://www.eia.gov/survey/form/eia_860/form.pdf
“It’s on their website because power plant operators have to file this form with the EIA…”
I guess I need better glasses. Where on those forms are you seeing that coal-fired power plant operators project their likely electricity production from 2025 to 2040?
Page 10…
8. If this generator will be retired in the next ten years, what is its estimated retirement date?
(MM-YYYY)
Then there are lots of questions about net capacity, anticipated upgrades, etc.
The average age of coal-fired power plants is 43 yrs. The oldest is 87 yrs. The youngest is 1 yr. old.
284 existing coal-fired generators are at least 50 years old (~40 GW).
159 are 30-yrs old or younger (~41 GW).
The remaining 185 GW are 31-49 years old.
Of the coal-fired generators that have been retired, the average age was 55 yrs old. 38 were >70 yrs old when they were retired.
“Page 10…
8. If this generator will be retired in the next ten years, what is its estimated retirement date?
(MM-YYYY)”
Yes, and where is the question, “If this generator will be retired in *more than* ten years, what is its estimated retirement date?
(MM-YYYY)”
Or correct me if my math is wrong, and a form filled out in say 2017 that asks a question about the next 10 years provides information about what those coal-fired plants expect to be doing in the 2027-2040 time frame, in which the EIA projects, “As a result, in the No CPP case, coal production stabilizes at about 900 MMst from 2025 through 2040.”
?
Oh, another question I have is where the coal production that “stabilizes at about 900 MMst from 2025 through 2040” is coming from? The last I checked, production in the #2 coal state, WV, peaked in 1947, production in the #3 coal state, PA, peaked in 1918, production in the #4 state, IL, also peaked in 1918, and production in the #5 state, KY, peaked in 1990.
Do you suppose Donald Trump, wearing his magic MAGA hat, is going to keep production in all those states from declining from now until 2025, and then throughout the 2025-2040 period?
Question #1. You start with planned retirements through 2027, then you make assumptions based on natural gas scenarios.


The “Low Oil and Gas Resource and Technology” scenario would have even less coal plant retirements because natural gas prices would be higher.
The “High Oil and Gas Resource and Technology” scenario would have more coal plant retirements because natural gas prices would be lower.
That’s why it’s called a “forecast” and not “fortune telling.”
Question #2. The coal production would come from things called “coal mines.” Coal production didn’t peak due to a lack of coal. It peaked due to demand.
Coal production will stabilize at whatever level coal-fired generation and coal exports stabilize at.
Question #3. No. The demand for coal will keep it from declining. US coal mines are only operating at an average of 68% of their current output capacity.
https://www.eia.gov/coal/annual/pdf/table12.pdf
“Question #1. You start with planned retirements through 2027, then you make assumptions based on natural gas scenarios.”
So the answer to my question is that there is no question on the 860 forms where coal-fired power plant operators guess what their plants will be doing more than 10 years into the future. So it’s the EIA, not coal-fired power plant operators, who is guessing what’s going to be happening in the 2025-2040 period. Again, I think they’re clearly overestimating likely coal consumption.
“The coal production would come from things called ‘coal mines.’ Coal production didn’t peak due to a lack of coal. It peaked due to demand.”
Yes, and the demand went down because West Virginia, Kentucky, Pennsylvania, and Illinois can no longer produce coal at low enough prices that people want it as much. There’s cheap natural gas.
It seems to me that there’s a limit to how many years utilities will keep very old coal plants running at very low capacity factors. And I don’t think that limit extends out to 2040.
There was cheap natural gas, relative to coal. in 2016 because natural gas prices dipped below $2/mcf. At >$2.50/mcf (mcf = mmbtu), coal is very competitive with natural gas. That’s why coal moved back ahead of natural gas last year.
https://wattsupwiththat.com/2017/08/01/coal-is-1-again/
https://wattsupwiththat.com/2017/04/06/the-resurgence-of-the-american-coal-industry/
Natural gas prices are likely to remain in a range that makes coal competitive and shale plays somewhat profitable…
“Maybe you have a reading disability, but this post is about the EIA’s Annual Energy Outlook 2018. It’s about what the US Department of Energy’s Energy Information Administration is forecasting from 2018-2050. I’ve provided links to EIA’s supporting data for their forecast.”
No, I don’t have a reading disability. The problem here is that you know virtually nothing about power generation, or likely trends in energy technologies (such as batteries versus natural gas peaker plants). So, like thousands of other clueless commentators on *both* sides of the climate change debate, you don’t make any attempt to actually educate yourself. Instead, you selectively read tidbits that support your “Fantasy Land” (to use your words) about how the world will be in the future.
1) In your fantasy, “Coal Keeps Chugging Away” at 217 GW of summer capacity, and with “improved capacity factors”, all the way up to 2050. Why? Because the EIA says so. (And the 860 reports prove that the electric power generation thinks so too! Just look, doesn’t the EIA spreadsheet say no coal closures until 2047?) In reality, I doubt even one in ten people with experience in utility coal-fired power generation would say that the EIA’s “Reference” scenario, in which coal-fired generation capacity remains at approximately 217 GW through 2050, is a plausible scenario. In fact, I’ll be happy to send you a cashier’s check for $100 if you can find even one high-ranking operating officer (e.g., CEO, COO, president, vice president, etc.) of a utility that owns coal-fired power plants totaling 1 GW or more, who thinks that coal-fired power plant summer capacity in the U.S. will be over 217 GW, or even 190 GW, in 2050. And I challenge you to make me an even vaguely similar offer. I challenge you to send *me* a cashier’s check for $100 if I can find *three* executives of utilities currently operating more than 1 GW of power capacity who think that coal-fired summer capacity in the U.S. in 2050 will be below 120 GW. (Not below 217 GW…below 120 GW.)
So…you want to put your money where your ignorant, mocking mouth is?
2) And in your fantasy, the capacity of existing nuclear plants declines from 97 GW to 79 GW in 2050, all from existing nuclear plants, because the EIA says so. Again, that’s ludicrous. I challenge you to find someone in the executive levels at utilities that actually operate nuclear power plants who think it’s credible that 79 GW of nuclear capacity will be available from existing nuclear plants in 2050.
3) Finally, you dismiss batteries as being capable of replacing natural gas peaker plants (specifically, I was writing about natural gas combustion turbines and natural gas steam turbines, not natural gas combined cycle plants that do some load following) Again, it’s simply because you know virtually nothing about the subject. You spend…15 minutes?…1 hour?…reading some stuff from the EIA AEO 2018, and you laughably think you understand the subjects of batteries and natural gas peaker plants!
You say “…this post is about the EIA’s Annual Energy Outlook 2018.” But you are *constantly* confusing the EIA’s silly forecasts, or even meaningless EIA documents, with plausible reality. For example:
1) You laughably cited an EIA spreadsheet of plant closings to 2047 as though those were the plant closings that would actually happen…or at least that the list was some sort of plausible representation of the plant closings that will happen. It’s not. And when I pointed that *fact* out, you claimed that *I* was living in “Fantasy Land.”
2) In your “evidence” that allegedly showed my statements about the future of batteries vs natural gas peaker plants (i.e. natural gas combustion turbines and natural gas were wrong, you presented the EIA AEO 2018 projections for batteries as though they were going to closely represent the future.
Once again, if you want to know the likely future of coal-fired power plants, nuclear power plants, and batteries vs natural gas peaker plants, you should read materials by people who actually know what they’re talking about. For example:
http://www.toledoblade.com/Energy/2017/10/20/Industry-leaders-say-coal-fire-power-plants-becoming-obsolete.html –>By 2040, DTE will get zero percent of its electricity from coal, Brian Corbett, DTE spokesman, said.
http://www.toledoblade.com/local/2018/01/25/FirstEnergy-executive-Davis-Besse-plant-headed-for-premature-closure.html–>A FirstEnergy Corp. executive confirmed Thursday what many people have feared for months: The utility’s Davis-Besse nuclear plant is headed for a premature closing. The outlook for FirstEnergy’s coal-fired power plants and its other nuclear plants — its twin-reactor Beaver Valley nuclear plant west of Pittsburgh and its Perry nuclear plant east of Cleveland — is just as bleak, said James Pearson, FirstEnergy’s chief financial officer.
https://www.edf.org/sites/default/files/content/power_sector_clean_energy_momentum_20170613_-_final.pdf American Electric Power plans to add 5,500 MW of wind and 3,000 MW of solar capacity in the coming years. AEP has already cut carbon dioxide emissions 44% from 2005 levels. After the 2016 election, CEO Nick Akins said that no matter who occupies the White House, “[coal is] not coming back. We’re moving to a cleaner-energy economy and we’re still getting pressure from investors to reduce carbon emissions. I don’t see that changing.”
https://www.utilitydive.com/news/steel-for-fuel-xcel-ceo-ben-fowke-on-his-utilitys-move-to-a-renewable-c/446791/ –> “If I were talking to you 10 years ago, I don’t think I’d be telling you that I think solar is competing with fossil,” said Ben Fowke, CEO of Xcel Energy. “I wouldn’t tell you that wind is beating fossil. I am telling you that now.”
http://www.crainsdetroit.com/article/20170426/BLOG010/170429879/nuclear-power-expansion-for-dte-in-michigan-is-long-range-strategy –>Though four new yet smaller-than-average nuclear reactors are under construction in the U.S. at two sites in Georgia and South Carolina, Fertell said the NEI predicts another 15-20 plants could close over the next decade.
Relative to the installed capacity, very few coal-fired power plants have been, or are scheduled to be retired:

https://wattsupwiththat.com/2018/01/11/2018-u-s-deep-freeze-largest-weekly-draw-on-natural-gas-storage-evah/
With proper maintenance and upgrading, coal-fired power plants can operate for 80* years, barring onerous new environmental regulations.
A modest rise in natural gas prices would enable existing coal-fired power plants to operate at a much higher utilization rate:
https://wattsupwiththat.com/2017/08/07/coal-plants-keep-closing-on-trumps-watch-and-why-it-doesnt-matter-to-the-resurgence-of-the-american-coal-industry/
I think the title for your curve that shows a precipitous drop in coal-fired power plant capacities that plateaus circa 2026 and remains flat through 2040 should be changed to:
“Coal keeps on chugging in the EIA’s and my mind.”
It’s the EIA forecast… So, it would by definition be in the EIA’s mind.
“It’s the EIA forecast… So, it would by definition be in the EIA’s mind.”
The EIA didn’t label the curve, “Coal Keeps on Chugging Away”, did they? So if it’s your label of for the curve, you must think it’s a solid (well-justified) forecast. Or if you don’t think the forecast is solid, what would be your forecast?
P.S. Don’t get me wrong, I think their forecast to ~2025 is solid. It’s only 2025 to 2050 that I think is bad.
I think their forecast of coal-fired generation capacity is very reasonable because, absent government intervention, most existing coal-fired generators could very easily remain in operation for 70 years or longer.
Most of the recent spike in retirements was due to a combination of low natural gas prices and the high cost of complying with new environmental regulations since the mid-2000’s.
If the Federal government initiates another war on coal after 2020 or 2024, the EIA forecast will be too high. If the Marcellus peaks earlier than expected and shale gas production becomes uneconomic below $4-5/mcf, the EIA forecast for coal will be too low.
EIA plant retirements 2017-2047…
https://www.eia.gov/electricity/monthly/epm_table_grapher.php?t=epmt_6_06
Your two figures seem to have a fairly significant disagreement for 2025. The bar graph appears to show about…260?…265? GW of capacity in 2025. In contrast, the EIA reference case shows…219? GW of capacity in 2025.
But in either case, I simply don’t think it’s credible that the second curve doesn’t show coal capacity going down by even 1% from 2026 to 2050. Even the leaders of companies like American Electric Power acknowledge that coal is going to go the way of the ivory-billed woodpecker:
https://www.greentechmedia.com/articles/read/aep-future-coal-power-very-limited
Maybe I should publish my own “N-AEO 2018” (“Non-governmental AEO 2018”) on my blog, so there will be a record of whether the EIA or I am more knowledgeable about likely trends in energy out to 2050. Of course, given that the folks at EIA probably spent tens of thousands of hours on AEO 2018, I’d probably need to spend at least a couple of days to try to match them, which is a lot of work… 😉
Edit: My bar graph is of nameplate capacity. The EIA graphs are of summer capacity.

The bottom graph is from the AEO2017 “no CPP” reference case. The top graph is from the most recent Form 860 filings.
The GTM article doesn’t even come close to suggesting the extinction of coal:
“AEP Exec: The Future for Coal Power Is ‘Very Limited’”
It is “very limited.” Very little additional coal-fired capacity is in the pipeline.
So, it’s pretty-well limited to the current capacity minus retirements. However, the average utilization rates of both coal and natural gas power plants is generally between 50-60%.
Most coal-fired and natural gas combined cycle power plants could operate at 80-90% of capacity. This makes it fairly easy for utilities to adjust to changes in natural gas prices.
Coal is still AEP’s #1 generating source:
13% renewable capacity is equivalent to about 4% natural gas or coal. So, AEP’s renewable component went from insignificant to slightly less insignificant.
What do you think happens when the shale sector collapses after the next correction in the markets? What I can’t get over is the refusal of the EIA to learn how to count and to confront reality. And there is only so much time that we can ignore reality before we have to face its consequences.
The ‘shale sector” won’t “collapse.” It might underperform, but it physically can’t collapse. If shale underperdorms, coal will easily take up the slack.
“What do you think happens when the shale sector collapses after the next correction in the markets?”
If shale gas production goes down, price goes up. But there’s no evidence that shale gas production is going to go down, and price is going to go up, any time in the foreseeable future. If there was evidence that might happen in the foreseeable future, utilities wouldn’t be shutting down coal-fired power plants at the current rapid rate.
Coal-fired power plants aren’t retiring at a “rapid rate.”


Here’s the same chart with just coal and natural gas…
The recent spike in closures of both coal and natural gas fired plants was driven by compliance costs. Most of the closures were of smaller, older, less efficient plants which were economically nonviable to upgrade. Coal plant closures were also driven by the collapse in natural gas prices in 2016. Natural gas has been trading in the $2.50-$3.50/mcf price range, where coal is competitive.
Coal-fired power plant retirements have slowed since 2015…
http://www.beg.utexas.edu/files/energyecon/think-corner/2017/CEE_Snapshot-Coal_Retirements-Apr17.pdf
Coal is competitive with natural gas when gas is above $2.50/mcf.
Very little shale gas is economic below $3.00/mcf…
Very few Marcellus operators can make money below $2.50/mcf…
The Marcellus/Utica is fracking YUGE… But at some point production will peak, the glut will fade and gas prices will revert to the norm ~$3.50-$4.00/mcf.
In that price range, both coal and natural gas are competitive and relatively inexpensive.
“Coal-fired power plants aren’t retiring at a ‘rapid rate.’”
Per the EIA:
“At the end of 2012 there were 1,308 coal-fired generating units in the United States, totaling 310 GW of capacity. In 2012 alone, 10.2 GW of coal-fired capacity was retired, representing 3.2% of the 2011 total.”
So at the end of 2011 (the start of 2012) there were 320 GW of coal-fired capacity in the U.S. In your figure, improbably titled, “Coal Keeps Chugging Away”, the EIA predicts that by 2021, there will about 223 GW of coal-fired capacity in the U.S. So that’s a drop of *97 GW* in about 11 years. I’d call that a “rapid rate”! What would it take for you to call it a rapid rate? From 320 GW at the start of 2012 to 0 GW in 2021?
I’m serious…what value of GW of capacity in 2021 would result in you calling the rate of retirement since the start of 2012 a “rapid rate”?
The rate would actually have to be rapid and not slowing down.
http://www.beg.utexas.edu/files/energyecon/think-corner/2017/CEE_Snapshot-Coal_Retirements-Apr17.pdf
So you don’t consider the retirement of *97 GW*–over 30 percent of coal-fired power plant capacity–from 2012 to 2021, to be a “rapid rate.”
I guess words mean very different things to you versus me.
Half of those retirements occured from 2011-2016…


97 GW of coal retirements still leaves 200-250 GW of capacity…
Accelerated and rapid are synonyms.
http://www.thesaurus.com/browse/rapid%20?s=t
Decelerating is not synonymous with rapid.
“EIA plant retirements 2017-2047…
https://www.eia.gov/electricity/monthly/epm_table_grapher.php?t=epmt_6_06”
Aren’t you aware that this table has virtually nothing to do with reality for the period from 2026 onward? That’s because the 860 forms only *require* reporting projected retirements for the next 10 years. So no utilities report retirements more than 10 years out.
Let me tell about some things that *will* happen, that aren’t on your sheets:
1) Many nuclear units are going to retire in the 2026-2047 time frame.
2) Many coal units are going to retire in the 2026-2047 time frame.
3) Many…and possibly *all*–natural gas peaking plants will retire between now and 2047. (Natural gas peaker plants will be replaced by batteries. It’s a question of when, not if.)
Maybe in Fantasy Land.
“Maybe in Fantasy Land”
As if you know the difference between reality and fantasy,..with your laughable, “Coal Keeps Chugging Along”…and your presentation of a table containing 860 reports out to 2047 as if they mean anything. Why don’t you put up or shut up, if you think you know anything about the power generation industry?
1) What is the capacity of U.S. coal plants, in GW, that you think will retire from 2026 to 2047? (Nameplate capacity = 290 GW in 2016, per EIA*.)
2) What is the capacity of U.S. nuclear plants, in GW, that you think will retire from 2026 to 2047? (Nameplate capacity = 105 GW in 2016, per EIA*).
3) What is the capacity of U.S. natural gas peaker plants, in GW, that you think will retire from 2018 to 2047? (Per the EIA**: “Natural gas-fired combined-cycle units accounted for 53% of the 449 gigawatts (GW) of total U.S. natural gas-powered generator capacity in 2016. Other types of natural gas-fired technology, such as combustion turbines (about 28% of total natural gas-powered generator capacity) and steam turbines (17%), generally only run during hours when electricity demand is high.”) Therefore, per the EIA**, natural gas combustion turbine capacity was approximately 126 GW, and natural gas steam turbine capacity was approximately 76 GW.)
* https://www.eia.gov/electricity/annual/html/epa_04_03.html
** https://www.eia.gov/todayinenergy/detail.php?id=30872
Firstly, I’m a geologist, I find oil & gas for a living. I don’t have a “dog in the fight” as it pertains to coal and nuclear power, even though I am a fan of both.
I do know quite a lot about the economics of natural gas and the long-term price of natural gas has to be in the $3.50-$4.00/mcf range to keep the shale plays viable.
$3.50-$4.00/mcf makes coal very competetive with natural gas. That’s why the EIA can forecast:
Page 83
Page 87
60 GW of coal-fired capacity was retired from 2011-2016 largely due to the cost of complying with MATS. That’s 10 GW/yr.
65 GW of coal-fired capacity is expected to be retired from 2017-2030 (14 years inclusive). That’s less than 5 GW/yr.
After 2030, coal-fired capacity is expected to level off at 190 GW.
I only minored in math, but that sure looks like a deceleration in the rate of coal-fired power plant retirements. 190 GW is about what our coal-fired capacity was in the mid-1970’s.
Page 86
Anticipated plant level retirements are detailed here:
https://www.eia.gov/electricity/monthly/epm_table_grapher.php?t=epmt_6_06
Natural gas peaker plants are inefficient and expensive. However, they are a helluva lot less expensive than batteries.
https://www.eia.gov/analysis/studies/powerplants/capitalcost/pdf/capcost_assumption.pdf
The forecast year-by-year additions and retirements by generating source can be accessed here:
https://www.eia.gov/outlooks/aeo/data/browser/#/?id=9-AEO2018®ion=0-0&cases=ref2018&start=2016&end=2050&f=A&linechart=~&ctype=linechart&sourcekey=0
“Firstly, I’m a geologist, I find oil & gas for a living.”
So then stop pretending you know anything about the electric power generation industry. Don’t tell me I’m living in “Fantasy Land.”
If you have no idea about the power plants that will close from 2026-2047, simply say so. Don’t tell me I don’t know what *I’m* talking about!
P.S. By the way, I’m amending my challenge to you to estimate the nuclear capacity that will retire from *now* to 2047, rather than from 2026 to 2047. That’s because there are probably some nuclear plants that won’t even make it to 2026, that weren’t on the silly list that you put forward as though it represented reality through 2047: (That’s in addition to the nuclear closures that were listed…Pilgrim, TMI, Oyster Creek, Palisades, and Diablo Canyon.)
https://www.eia.gov/electricity/monthly/epm_table_grapher.php?t=epmt_6_06
Maybe you have a reading disability, but this post is about the EIA’s Annual Energy Outlook 2018. It’s about what the US Department of Energy’s Energy Information Administration is forecasting from 2018-2050. I’ve provided links to EIA’s supporting data for their forecast.
Regarding Fantasy Land…
Capital Cost Estimates for Utility Scale Electricity Generating Plants, November 2016
Overnight Capital Cost ($/kW)
Fixd O&M ($/kW-yr)
Variable O&M ($/MWh)
Combustion Turbine (CT)
$ 1,101
$ 17.50
$ 3.50
Adv Comb Turbine (ACT)
$ 678
$ 6.80
$ 10.70
Recip ICE (RICE)
$ 1,342
$ 6.90
$ 5.85
Battery (BES)
$ 2,813
$ 40.00
$ 8.00
Battery storage is 2-4 times the capital cost of common natural gas-fired peaker plants.
Battery storage fixed O&M is 2-6 times the cost of common natural gas-fired peaker plants.
Battery storage even has a higher variable O&M than most common natural gas-fired peaker plants. Variable O&M includes the cost of the natural gas.
More news from Fantasy Land…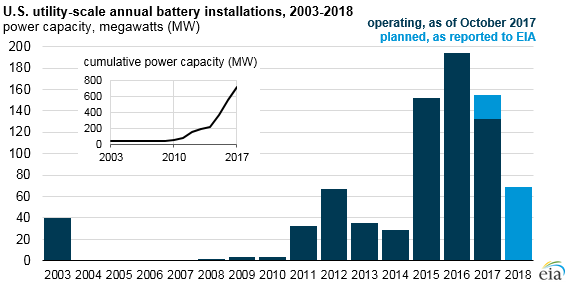
https://www.eia.gov/todayinenergy/detail.php?id=34432
700 MW!!! In just 3 years!!!
Page 96
34 GW of storage by 2050!
https://www.eia.gov/todayinenergy/detail.php?id=30872
About 45% of the current natural gas capacity consists of peakers, ~202 GW.
34 GW of batteries will have a tough time replacing 202 GW of natural gas peakers.
Per the always-amusing David Middleton:
“Overnight Capital Cost ($/kW)
Fixd O&M ($/kW-yr)
Variable O&M ($/MWh)”
“Combustion Turbine (CT)
$ 1,101
$ 17.50
$ 3.50”
“Battery storage even has a higher variable O&M than most common natural gas-fired peaker plants. Variable O&M includes the cost of the natural gas.”
No, $3.50/MWh most certainly does *not* “include the cost of the natural gas.” If it did, 100% of our electricity would be from natural gas combustion turbines, and zero from coal, nuclear, wind, or solar. Don’t you think you should actually learn something about the economics of the electric power generation industry before you mock *me*?
Variable O&M by definition includes the fuel. In the case of coal and natural gas, fuel costs are most of the variable O&M.
“Maybe you have a reading disability, but this post is about the EIA’s Annual Energy Outlook 2018. It’s about what the US Department of Energy’s Energy Information Administration is forecasting from 2018-2050. I’ve provided links to EIA’s supporting data for their forecast.”
No, I don’t have a reading disability. The problem here is that you know virtually nothing about power generation, or likely trends in energy technologies (such as batteries versus natural gas peaker plants). So, like thousands of other clueless commentators on *both* sides of the climate change debate, you don’t make any attempt to actually educate yourself. Instead, you selectively read tidbits that support your “Fantasy Land” (to use your words) about how the world will be in the future.
1) In your fantasy, “Coal Keeps Chugging Away” at 217 GW of summer capacity, and with “improved capacity factors”, all the way up to 2050. Why? Because the EIA says so. (And the 860 reports prove that the electric power generation thinks so too! Just look, doesn’t the EIA spreadsheet say no coal closures until 2047?) In reality, I doubt even one in ten people with experience in utility coal-fired power generation would say that the EIA’s “Reference” scenario, in which coal-fired generation capacity remains at approximately 217 GW through 2050, is a plausible scenario. In fact, I’ll be happy to send you a cashier’s check for $100 if you can find even one high-ranking operating officer (e.g., CEO, COO, president, vice president, etc.) of a utility that owns coal-fired power plants totaling 1 GW or more, who thinks that coal-fired power plant summer capacity in the U.S. will be over 217 GW, or even 190 GW, in 2050. And I challenge you to make me an even vaguely similar offer. I challenge you to send *me* a cashier’s check for $100 if I can find *three* executives of utilities currently operating more than 1 GW of power capacity who think that coal-fired summer capacity in the U.S. in 2050 will be below 120 GW. (Not below 217 GW…below 120 GW.)
So…you want to put your money where your ignorant, mocking mouth is?
2) And in your fantasy, the capacity of existing nuclear plants declines from 97 GW to 79 GW in 2050, all from existing nuclear plants, because the EIA says so. Again, that’s ludicrous. I challenge you to find someone in the executive levels at utilities that actually operate nuclear power plants who think it’s credible that 79 GW of nuclear capacity will be available from existing nuclear plants in 2050.
3) Finally, you dismiss batteries as being capable of replacing natural gas peaker plants (specifically, I was writing about natural gas combustion turbines and natural gas steam turbines, not natural gas combined cycle plants that do some load following) Again, it’s simply because you know virtually nothing about the subject. You spend…15 minutes?…1 hour?…reading some stuff from the EIA AEO 2018, and you laughably think you understand the subjects of batteries and natural gas peaker plants!
I can’t help you with the reading disability. Teaching remedial reading is way below my pay grade.
You say “…this post is about the EIA’s Annual Energy Outlook 2018.” But you are *constantly* confusing the EIA’s silly forecasts, or even meaningless EIA documents, with plausible reality. For example:
1) You laughably cited an EIA spreadsheet of plant closings to 2047 as though those were the plant closings that would actually happen…or at least that the list was some sort of plausible representation of the plant closings that will happen to 2047. It’s not. And when I pointed that *fact* out, you claimed that *I* was living in “Fantasy Land.”
2) In your “evidence” that allegedly showed my statements about the future of batteries vs natural gas peaker plants (i.e. natural gas combustion turbines and natural gas steam turbines) were wrong, you presented the EIA AEO 2018 projections for batteries as though they were going to closely represent the future.
My “evidence” consists of the actual evidence. I have no control over how the evidence conflicts with your Unicorn-energy fantasies.
Me: No, $3.50/MWh most certainly does *not* “include the cost of the natural gas.”
David Middleton: “Variable O&M by definition includes the fuel. In the case of coal and natural gas, fuel costs are most of the variable O&M.”
Oh, good grief! David, stick to geology.
Here is how to do the calculation:
1) A natural gas combustion turbine used for peaking power has a heat rate of about 11,200 Btu/kWh, or 11.2 million Btu per megawatt-hour (11.2 MMBtu/MWh).
https://www.eia.gov/electricity/annual/html/epa_08_02.html
2) Even at an insanely low natural gas price of $2 per million Btu ($2/MMBtu), that would represent a cost of:
$2/MMBtu * 11.2 MMBtu/MWh = $22.4/MWh. And that’s for an insanely low natural gas price of $2/MMBtu.
At a more reasonable price of $3.50/MMBtu, were talking about $3.50/MMBtu * 11.2 MMBtu = $39.2/MWh.
Once again. $3.50/MWh most certainly does *not* “include the cost of the natural gas.” I’d appreciate if you’d acknowledge that statement to be true.
My bad.
The variable O&M only includes fuel in the LCOE table. Variable O&M in the capital cost table excludes fuel.
So… Add the cost of natural gas to the peakers and add the cost of the electricity being delivered to the battery array.
Their projections on Solar Electric appear to me to be a “little over the top”. With little to no subsidies available, where will the money come from to grow that insignificant current amount into the colossus I am looking at in 2050 that they are illustrating.
They must expect that the democrats will get back into power.
It’s based on known planned construction and modeled price forecasts. I think that’s why wind plateaus and solar PV continues to rise. They are probably forecasting a continued decline in solar PV costs.
They would also be forecasting that most of all the wind that will ever be built will be built in a timeframe compliant with PTC. After that there will be maintenance, but no new capacity additions. Seems a little like sandbagging, since repowering sites as they age out will likely be cheap as the cost of repowering comes down and the sites themselves are already tied to transmission and are sites with good wind profiles.
They do foresee some wind capacity additions. Just not nearly as much as solar PV.

If our quantum computer-driven, post-Singularity super-human AI hasn’t replaced most forms of energy with fusion by 2050, I’ll be very surprised and disappointed. The EIA has probably never even read about the Singularity, which is all but inevitable by 2050.
I find a couple things in the report interesting
1) They are projecting simple exponential growth of electricity consumption in the future. I think that is odd since electricity has plateaued since ~2000. Basically “The Pause” has happened here too, but the EIA is saying “just wait, it will pick up again” Similar for total consumption. The US per-capita energy consumption is ~295 MMBtu this year compared to a peak value of 359MMBtu in 1979. Granted, we have population growth, but our energy efficiency has been improving faster than our population increase.
2) They assume higher GDP growth will drive higher energy usage. That was certainly true when higher GDP allowed you to buy things that use more energy. However, moving from a record player to an iPhone uses less electricity. Moving from a dryer to a dryer with steam doesn’t affect energy usage at all. So many of our upgrades now use the same or less energy than previous versions, so I don’t see how GDP growth here will drive increasing energy use.
At no point do they project “exponential growth of electricity consumption in the future.”
I think I might have used the word “exponential” different than its common usage. They are indeed showing an exponential growth of electricity usage with a rate of ~1% growth year over year. Common language would take “exponential” to mean “stinking fast growth,” but you and I both know that exponential can be fast or slow. I was using the term mathematically, not according to the common use. I apologize for the lack of clarity, that’s on me.
My reaction is to the fact that since 2008 (a decade now) the growth has been flat (a growth rate of ~0% year over year). I gave a reason to expect that GDP growth will be less coupled to energy growth, and I am puzzled why EIA believes that energy use will grow lock step with population growth from 2022 onward.
There is a company working on adapting Fracking techniques to ground source heat pumps. The basic concept is that instead of each job being custom the process will be standard and the company will have to say no to some jobs that don’t fit their process. However, the upside is that they expect to bring the cost of drilling the well down by several times. In the North East if you could move from Nat Gas heating (even assuming 95% thermal efficiency) to Nat Gas powered Heat Pumps you reduce the actual amount of gas used by at least a factor of 2. Granted, this would then require Electricity pushing up electric growth even though total energy would come down. However, I suspect there are enough activities like that where efficiency will grow faster than population. I simply don’t see a justification in their projections for the 1% annual growth rate.
Exponential generally means that the rate of change is increasing. Not many people would describe a 1% return on investment as exponential growth.
Part of the increase is probably due to the slow growth of electric vehicles. And a fair bit of the growth is expected to come from distributed solar.
Hey, EIA, bone up on future energy sourcces, like molten salt nuclear power. If you don’t you’ll continue making these braindead predictions, which have no basis in the realities of the future.
If anyone planned on building molten salt nuclear reactors over the next decade or so, they would have had to have already begun the permitting and planning process… and they would have notified the Department of Energy.
Correct. Ish.
Not sure if you meant NRC or DOE…but DOE doesn’t directly meddle in NRC’s space.
As for advanced reactors, well, we don’t even have a regulatory framework for OEMs/Utilities to use for increasing enrichment limits in the current gen LWRs, much less a regulatory framework for MSRs or HTGRs. I’m afraid we’re a long way off from seeing these become part of our energy infrastructure.
As for the general decline in Nuclear (a very believable drop from 8% to 6%)…it’s a sad reality we’re facing. It’s become too costly to keep some of these plants running in the face of dirt cheap electricity prices, over zealous regulatory hurdles, and general political ill-will. When I stand back and consider the implications of continuing to use fossil fuels, yeah, I’m with you Dave… let’s green this thing up!!! But, I do think there’s a valid place for stable, high capacity factor nuclear, and I’m sad to see us lose it through gradual attrition.
rip
EIA part of DOE. EIA collects data from NRC, DOE, USGS, BOEM, BLM, BLS, the rest of the alphabet soup, the US Census and private industry.
If someone was planning on adding reactor capacity or Mr. Fusion machines in the near future, DOE and EIA would have it in their database.
This is what you get for industry capture of the DOE/NRC regulators. Revolving door. They killed their industry by stifling innovation.
David,
Oh, gotcha. Thanks for the clarification. And agreed.
rip
Why no increase in nuclear? So much better technology available and promised breakthroughs coming. Not real or do they just not consider it real?
Because there are more nuclear retirements on the schedule than nuclear additions.
Correct. But the following statement in the report in that regard is also telling:
The Reference case projects a steady decline in nuclear electric generating capacity—from 99 gigawatts
(GW) in 2017 to 79 GW in 2050 (a 20% decline)—with no new plant additions beyond 2020.”
“with no new plant additions beyond 2020”.
I am optimistic, hopeful, and reasonably confident that statement will be eaten, for the same reasons USGS, King Hubbert, Paul Ehrlich, Club of Rome were wrong: technology advancement.
Here’s my prediction – SMR’s will add significant capacity by 2050. Maybe not enough to entirely offset the retirements of existing US fleet or the impact fracking has had/is having/will have on nat gas prices. But enough to make the USEIA prediction above wrong.
Capitalism, technology, rising nat gas prices will all conspire to increase nuclear electricity generation in some form, and my bet in the short term are SMRs.
I hope you’re right.
Once again, yet more evidence that no-one actually believes any of this.
If the US Government really did, there would be real actual reductions in CO2 projected. There is no country in the world that actually believes what they keep reciting. Believes in the sense that they take action consistent with what they claim to believe, as opposed to simply paying public lip service and then going back to business as usual.
The most ludicrous example is Norway, lecturing the world on the coming catastrophe and how important renewables are, while pumping oil and gas like there was no tomorrow.
Show me just one country with realistic properly planned programs substantially to reduce their emissions. There is none.
The purpose of the AEO is simply to show the projected trends of the energy industry are, not to lay out a centrally planned government energy program. This is the USA, not the USSR.
As I have been saying for more than a decade, the laws of physics and economics do not yield to the ideology, wishes, demands, or laws/diktats of “environmentalists” and their elected leaders.
This is simply another proof of that.
– a 28 year practicing environmental industry professional who studies all things environmental, climate, and energy and is fuel-source agnostic, as long as the fuel is abundant, on-demand, reliable and affordable
They seem very bullish on Solar. I wonder how much of that they think will be installed north of the Mason-Dixon line? And do they see this as residential installations or utility based? When you have access to other energy sources for electrical production, and live in areas that suffer from long nights, and cloudy days for 4-6 months a year, solar is a non-starter.