By Javier
Here, for the first time in public, is Javier’s entire collection of massive, “consensus” climate science prediction failures. This collection is carefully selected from only academics or high-ranking officials, as reported in the press or scientific journals. Rather than being exhaustive, this is a list of fully referenced arguments that shows that consensus climate science usually gets things wrong, and thus their predictions cannot be trusted.
To qualify for this list, the prediction must have failed. Alternatively, it is also considered a failure when so much of the allowed time has passed that a drastic and improbable change in the rate of change is required for it to be true. Also, we include a prediction when observations are going in the opposite way. Finally, it also qualifies when one thing and the opposite are both predicted.
A novelty is that I also add a part B that includes obvious predictions that consensus climate science did not make. In science you are also wrong if you fail to predict the obvious.
A. Failed predictions
1. Warming rate predictions
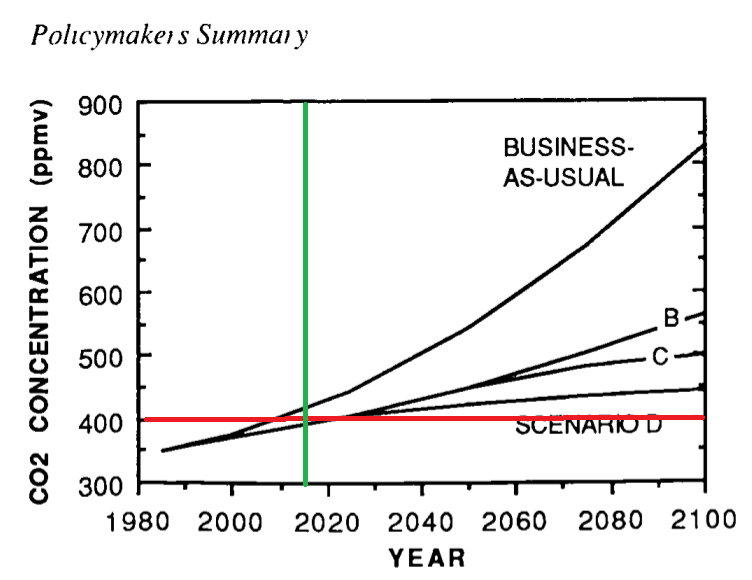
1990 IPCC FAR: “Under the IPCC ‘Business as Usual’ emissions of greenhouse gases the average rate of increase of global mean temperature during the next century is estimated to be 0.3°C per decade (with an uncertainty range of 0.2°C – 0.5°C).” See here, page xi.
Reality check: Since 1990 the warming rate has been from 0.12 to 0.19°C per decade depending on the database used, outside the uncertainty range of 1990. CO2 emissions have tracked the “Business as Usual” scenario. An interesting discussion of the 1990 FAR report warming predictions and an analysis of them through April of 2015 can be seen here. A list of official warming rates from various datasets and for various time spans can be seen here.
2. Temperature predictions
1990 IPCC FAR: “Under the IPCC ‘Business as Usual’ emissions of greenhouse gases … this will result in a likely increase in global mean temperature of about 1°C above the present value by 2025.” See here, page xi.
Reality check: From 1990 to 2017 (first 8 months) the increase in temperatures has been 0.31 to 0.49°C depending on the database used. CO2 emissions have tracked the Business as Usual scenario.

Figure 1. CMIP5 climate models developed by 2010 still predict more warming than observed, only a few years later. Source here.
3. Winter predictions
2001 IPCC TAR (AR3) predicts that milder winter temperatures will decrease heavy snowstorms, see here.
2014 Dr. John Holdren, director of the Office of Science and Technology Policy for the Obama administration said: “a growing body of evidence suggests that the kind of extreme cold being experienced by much of the United States as we speak is a pattern we can expect to see with increasing frequency, as global warming continues.” See here.
Reality check: By predicting both milder winters and colder winters the probability of getting it right increases. Now, to cover all possibilities they simply need to predict no change in winters.
4. Snow predictions
2000 Dr. David Viner, a senior research scientist at the climatic research unit (CRU) of the University of East Anglia, predicts that within a few years winter snowfall will become “a very rare and exciting event”. “Children just aren’t going to know what snow is.” See here.
2001 IPCC TAR (AR3) predicts that milder winter temperatures will decrease heavy snowstorms. See here.
2004 Adam Watson, from the Centre for Ecology and Hydrology in Banchory, Aberdeenshire, said the Scottish skiing industry had no more than 20 years left. See here.
Reality check: 2014 had the snowiest Scottish mountains in 69 years. One ski resort’s problem was having some of the lifts buried in snow. See here.
Reality check: Northern Hemisphere snow area shows remarkable little change since 1967. See here. The 2012-2013 winter was the fourth largest winter snow cover extent on record for the Northern Hemisphere. See here.
5. Precipitation predictions
2007 IPCC AR4 predicts that by 2020, between 75 and 250 million of people are projected to be exposed to increased water stress due to climate change. In some countries, yields from rain-fed agriculture could be reduced by up to 50%. See here.
Reality check: Only six years later, IPPC acknowledges that confidence is low for a global-scale observed trend in drought or dryness (lack of rainfall) since the middle of the 20th century, and that AR4 conclusions regarding global increasing trends in drought since the 1970s were probably overstated. See here, page 162.
6. Extreme weather predictions
2010 Dr. Morris Bender, from NOAA, and coauthors predict that “the U.S. Southeast and the Bahamas will be pounded by more very intense hurricanes in the coming decades due to global warming.” They say the strongest hurricanes may double in frequency. See here.
Reality check: After 40 years of global warming no increase in hurricanes has been detected. NOAA U.S. Landfalling Tropical System index shows no increase, and in fact, a very unusual 11-year drought in strong hurricane US landfalls took place from 2005-2016. See NOAA statistics here.
IPCC AR5 (see here) states “Current datasets indicate no significant observed trends in global tropical cyclone frequency over the past century … No robust trends in annual numbers of tropical storms, hurricanes and major hurricanes counts have been identified over the past 100 years in the North Atlantic basin”
“In summary, there continues to be a lack of evidence and thus low confidence regarding the sign of trend in the magnitude and/or frequency of floods on a global scale”
“In summary, there is low confidence in observed trends in small-scale severe weather phenomena such as hail and thunderstorms”
7. Wildfire predictions
2001 IPCC TAR (AR3) said that fire frequency is expected to increase with human-induced climate change, and that several authors suggest that climate change is likely to increase the number of days with severe burning conditions, prolong the fire season, and increase lightning activity, all of which lead to probable increases in fire frequency and areas burned. See here.
2012 Steve Running, a wildfire expert, ecologist and forestry professor at the University of Montana says the fires burning throughout the U.S. offer a window into what we can expect in the future as the climate heats up. See here.
Reality check: The global area of land burned each year declined by 24 percent between 1998 and 2015, according to analysis of satellite data by NASA scientists and their colleagues. Scientists now believe the decrease in forest fires is increasing 7% the amount of CO2 stored by plants. See here.
8. Rotation of the Earth predictions
2007 Dr. Felix Landerer of the Max Planck Institute for Meteorology in Hamburg, Germany, published a study predicting that Global warming will make Earth spin faster. See here.
2015 Dr. Jerry Mitrovica, professor of geophysics at Harvard University finds out that days are getting longer as the Earth spins slower, and blames climate change. See here.
Reality check: Doing one thing and its opposite simultaneously has always been possible for climate change. However, the International Earth Rotation and Reference Systems Service (IERS) informs us that the Earth slowed down from the start of measurements in 1962 to 1972, and sped up between 1972 and 2005. Since 2006 it is slowing down again. It shows the same inconsistency as global warming. See here.
9. Arctic sea ice predictions
2007 Prof. Wieslaw Maslowski from Dept. Oceanography of the US Navy predicted an ice-free Arctic Ocean in summer 2013, and said the prediction was conservative. See here.
2007 NASA climate scientist Jay Zwally predicted that the Arctic Ocean could be nearly ice-free at the end of summer in 2012. See here.
2008 University of Manitoba Prof. David Barber predicted an ice-free North Pole for the first time in history in 2008, see here.
2010 Mark Serreze, director of the NSIDC predicts the Arctic will be ice free in the summer by 2030, see here.
2012 Prof. Peter Wadhams, head of the polar ocean physics group at the University of Cambridge (UK), predicted a collapse of the Arctic ice sheet by 2015-2016, see here.
Reality check: No decrease in September Arctic sea ice extent has been observed since 2007, see here and here.
10. Polar bear predictions
2005 The 40 members of the Polar Bear Specialist Group (PBSG) of the World Conservation Union decided to classify the polar bear as “vulnerable” based on a predicted 30 percent decline in their worldwide population over the next 35 to 50 years. The principal cause of this decline is stated to be climatic warming and its negative effects on the sea ice habitat. See here.
2017 The US Fish and Wildlife Service releases a report concluding that human-driven global warming is the biggest threat to polar bears and that if action isn’t taken soon the Arctic bears could be in serious risk of extinction. “It cannot be overstated that the single most important action for the recovery of polar bears is to significantly reduce the present levels of global greenhouse gas emissions.” See here.
2010 Science: Fake polar bear picture chosen to illustrate a letter to Science about scientific integrity on climate change. You just can’t make this stuff up. See here and here.

Figure 2, the fake picture (left) published in Science, May, 2010.
Reality check: Average September Arctic sea ice extent for the 1996-2005 period was 6.46 million km2. It declined by 26% to 4.77 million km2 for the 2007-2016 period. Despite the sea ice decline the polar bear population increased from a 20,000-25,000 estimate in 2005 to a 22,000-31,000 estimate in 2015. See here.
11. Glacier predictions
2007 IPCC AR4 says there is a very high likelihood that Himalayan glaciers will disappear by the year 2035 and perhaps sooner if the Earth keeps warming at the current rate. See here.
IPCC officials recanted the prediction in 2010 after it was revealed the source was not peer-reviewed. Previously they had criticized the Indian scientist that questioned the prediction and ignored an IPCC author than in 2006 warned the prediction was wrong. See here.
12. Sea level predictions
1981 James Hansen, NASA scientist, predicted a global warming of “almost unprecedented magnitude” in the next century that might even be sufficient to melt and dislodge the ice cover of West Antarctica, eventually leading to a worldwide rise of 15 to 20 feet in the sea level. See here.
Reality check: Since 1993 (24 years) we have totaled 72 mm (3 inches) of sea level rise instead of the 4 feet that corresponds to one-fourth of a century. The alarming prediction is more than 94% wrong, so far. See here.
A NASA study, published in the Journal of Glaciology in 2015, claims that Antarctic ice mass is increasing. See here. Antarctic sea ice reached a record extent in 2014, see here.
13. Sinking nations predictions
1989 Noel Brown, director of the New York office of the U.N. Environment Program (UNEP) says entire nations could be wiped off the face of the Earth by rising sea levels if the global warming trend is not reversed by the year 2000. As global warming melts polar icecaps, ocean levels will rise by up to three feet, enough to cover the Maldives and other flat island nations. See here.
Reality check: Tide gauges referenced by GPS at 12 locations in the South Pacific reported variable trends between -1 to +3 mm/year for the 1992-2010 period. See here.
The Diego Garcia atoll in the Indian ocean experienced a land area decrease of only 0.92% between 1963 and 2013. See here.
The Funafuti atoll has experienced a 7.3% net island area increase between 1897 and 2013. See here.
14. Food shortage predictions
1994 A study, by Columbia and Oxford Universities researchers, predicted that under CO2 conditions assumed to occur by 2060, food production was expected to decline in developing countries (up to -50% in Pakistan). Even a high level of farm-level adaptation in the agricultural section could not prevent the negative effects. See here.
2008 Stanford researchers predicted a 95% chance that several staple food crops in South Asia and Southern Africa will suffer crop failures and produce food shortages by 2030, due to 1°C warming from the 1980-2000 average. See here.
Reality check: On average, food production in developing countries has been keeping pace with their population growth. Pakistan, with 180 million people, is among the world’s top ten producers of wheat, cotton, sugarcane, mango, dates and kinnow oranges, and holds 13th position in rice production. Pakistan shows impressive and continuously growing amounts of agricultural production, according to FAO. See here.
15. Climate refugee predictions
2005 Janos Bogardi, director of the Institute for Environment and Human Security at the United Nations University in Bonn and the United Nations Environment Program (UNEP) warned that there could be up to 50 million environmental refugees by the end of the decade. See here.
2008 UN Deputy secretary-general Srgjan Kerim, tells the UN General Assembly, that it had been estimated that there would be between 50 million and 200 million environmental migrants by 2010. See here.
2008 UNEP Map showing the areas of origin of the 50 million climate refugees by 2010. See here.

Figure 3. Fifty million climate refugees by 2010. Climate refugees will mainly come from developing countries, where the effect of climate changes comes on top of poverty and war. UNEP/GRID-Arendal map, source here.
2011 Cristina Tirado, from the Institute of the Environment and Sustainability at UCLA, says 50 million “environmental refugees” will flood into the global north by 2020, fleeing food shortages sparked by climate change. See here.
Reality check: As of 2017 only one person has claimed climate change refugee status: The world “first climate change refugee” Ioane Teitiota from Kiribati. His claim was dismissed by a court in New Zealand in 2014. See here.
16. Climate change casualty predictions
1987 Dr. John Holdren, director of the Office of Science and Technology Policy for the Obama administration then a professor at U.C. Berkeley was cited by Paul Ehrlich: “As University of California physicist John Holdren has said, it is possible that carbon dioxide climate-induced famines could kill as many as a billion people before the year 2020.” See here.
2009 Dr. John Holdren, director of the Office of Science and Technology Policy for the Obama administration, when questioned by Sen. David Vitter admitted that 1 billion people lost by 2020 was still a possibility. See here.
Reality check: There was a 42% reduction in the number of hungry and undernourished people from 1990-1992 to 2012-2014. Currently, the world produces enough food to feed everyone. Per capita food availability for the whole world has increased from 2,220 kcal/person/day in the early 1960’s to 2,790 kcal/person/day in 2006-2008. See here.
17. Time running out predictions
1989 Noel Brown, director of the New York office of the U.N. Environment Program (UNEP) says that within the next 10 years, given the present loads that the atmosphere must bear, we have an opportunity to start the stabilizing process. See here.
2006 NASA scientist James Hansen says the world has a 10-year window of opportunity to take decisive action on global warming and avert catastrophe. See here.
2007 U.N. Scientists say only eight years left to avoid worst effects See here.
B. Failure to predict
1. A greener planet
1992 The CO2 fertilization effect was well known, and experiments since at least 1988 showed that farm yields increased significantly. This was an easy prediction to make, yet it was ignored. See here.
In 2007 the IPCC was still downplaying the importance of the effect: “Since saturation of CO2 stimulation due to nutrient or other limitations is common, it is not yet clear how strong the CO2 fertilization effect actually is.” See here.
However recent satellite image analysis of changes in the leaf area index since 1982 have demonstrated a very strong greening over 25-50% of the Earth. CO2 fertilization is responsible for most of the greening, with the increase in temperatures also contributing. See here.
2. Increase in forest biomass
2006: For four of the past five decades global forest dynamics were thought to be primarily driven by deforestation. It was only in the last decade when it was noticed that a great majority of reports were contradicting that assumption. “Of the 49 papers reporting forest production levels we reviewed, 37 showed a positive growth trend.” The authors also write “climatic changes seemed to have a generally positive impact on forest productivity” when sufficient water is available. See here.
2010: The observed forest biomass increase was found to greatly exceed natural recovery, and was attributed to climate change, through changes in temperature and CO2. See here.
2015: Satellite passive microwave observations demonstrate that the trend is global and is accompanied by a recent decrease in tropical deforestation. See here.
3. Carbon sinks increases
1992: In the late 80’s a “missing sink” was discovered in the carbon budget accounting, and was discussed through the 90’s. The possibility that Earth’s oceans and terrestrial ecosystems could respond to the increase in CO2 by absorbing more CO2 had not occurred to climate scientists, and when it occurred to them they mistakenly thought that deforestation would be a higher factor. See here.
4. Slowdown in warming
2006: Professor Robert Carter, a geologist and paleoclimatologist at James Cook University, Queensland, was one of the first to report the unexpected slowdown in warming that took place between 1998 and 2014. See here.
The scientific climate community essentially ignored the issue until 2013 and have recently become split on its reality, with a small group negating it even took place. Nobody in the scientific community is even considering the possibility that the “Pause” might not have ended and was only temporarily interrupted by the 2015-16 big El Niño.
Conclusions
There is only one possible conclusion regarding the reliability of climate predictions. Outspoken catastrophic-minded climate scientists and high-ranking officials don’t have a clue about future climate and its consequences, and are inventing catastrophic predictions for their own interest. Government policies should not be based on their future predictions.
Another conclusion is that studies and opinions about future climate are heavily biased towards negative outcomes that fail to materialize, while ignoring positive outcomes that are materializing.
This post was edited a little by Andy May, who believes the only safe prediction is that the predictions of “consensus scientists” will continue to be wrong.
https://www.thegwpf.com/met-office-fail/
Back in May, the Met Office forecast an above average hurricane season in the North Atlantic. And the outcome? “The 2013 hurricane season was one of the quietest seasons to be recorded in the last twenty years.”
And here is the Met Office kind of admitting they got it wrong
https://www.metoffice.gov.uk/binaries/content/assets/mohippo/pdf/b/0/verification2013.pdf
http://www.telegraph.co.uk/news/earth/environment/globalwarming/8877491/Arctic-sea-ice-to-melt-by-2015.html
Arctic sea ice ‘to melt by 2015’, written in 2011.
http://www.archive.sierraclub.ca/en/AdultDiscussionPlease
“Why Arctic sea ice will vanish in 2013” by Paul Beckwith.
More ammunition on #13 to add to https://pubs.geoscienceworld.org/geology/article-abstract/43/6/515/131899/coral-islands-defy-sea-level-rise-over-the-past
http://www.sciencedirect.com/science/article/pii/S0921818110001013
It is clear,Ivan will not answer what Javier posted. He KNOWS he can’t,which is why he is ignoring it to push an irrelevant deflection about CO2 levels in the atmosphere.
Hello warmists! who want to take a chance in answering Javier? It is not dangerous, go ahead try to point out where Javier is wrong.
Waiting for someone to address Javier’s post………………………… surprise us with a counter argument.
Ok Sun, I would like to argue about Javier’s Figure 1.
I feel it is wrong to use current temperature data from HadCrud,
A more reliable source should be used, say UAH. (in red) (visual alignment of scales matching 1980 start point)

Warming rates since 1990 have a large non-anthropogenic AMO component.
In fact, the only warming in the whole of the satellite temperature sets is from El Nino events,
There is certainly NO any anthropogenic warming signature at all.
Between 1980 and 1997, no warming

Between 2001 and 2015, no warming

Really…
http://www.woodfortrees.org/graph/uah6/from:1997/to:2001/plot/uah6/from:1997/to:2001/trend
Javier thank you again for your insightful articles. Well done.
It really gets me PO’ed when I think of how governments have created so many policies that are based upon these “wrong” predictions. The massive price distortions and increasing taxation that has been based upon them, that have raised the cost the people pay for not only energy, but everything they buy.
“The conditions were so bad that Tim Flannery, now Australia’s Chief Climate Commissioner, declared rather bizarrely in 2007 that hotter soils meant that “even the rain that falls isn’t actually going to fill our dams and river systems”.
“Fast forward to 2012 and we see widespread drenching rains, flooded towns and cities, and dams full to the brim and overtopping. Indeed, the rainfall that we had last year not only filled Brisbane City’s Wivenhoe Dam water supply storage, but also all of its flood mitigation capacity. The resultant releases of water required to prevent a truly catastrophic dam failure contributed to the inundation of large parts of metropolitan Brisbane.”
http://theconversation.com/climate-and-floods-flannery-is-no-expert-but-neither-are-the-experts-5709
The linked article has other examples of botched forecasts.
There is no doubt that the effects of climate change are exaggerated, but there is equal confidence that climate change is happening, and we have a hand in it, to a lesser or greater degree.
But that is a meaningless statement. If I light a match, we may certainly correctly claim that I have contributed to global warming, but is it possible to detect that signal in all the noise? Can the signal of climate change attributable to human activity be detected in the noise of non-human causes?
That is not in dispute.
What is in dispute is whether the small amount of heating that can be contributed to CO2 is large enough to be a problem rather than a benefit.
Except you can’t show where we have had a hand in any changes to any degree. So that assertion is scientifically invalid. It is currently cooling. Please show how that is explained by human causes. It has not warmed for 18 years. Please explain how humans have failed to cause any meaningful change in the weather despite doing everything we do as vigorously as possible without any serious effort Not to change anything.
Gareth,
Fomenting fear through alarmist predictions doesn’t help science. Real science is based on evidence, and computer models do not constitute evidence. After over 65 years of artificially rising CO2 levels in the atmosphere, the evidence that this is going to constitute a serious problem is surprisingly lacking. An unbiased assessment of the consequences would find that positive consequences outweigh negative ones so far. Only through silly extrapolation and imaginary worsening can we conclude that we are in any serious danger from climate change over the next 80 years. We can only conclude that we are being deceived. That some of the people that try to deceive us are self-deceived doesn’t justify it.
Gareth: See my comment upthread at https://wattsupwiththat.com/2017/10/30/some-failed-climate-predictions/comment-page-1/#comment-2650498
As a general observation, this isn’t news. People have made varying predictions; they can’t all be right. We knew that.
Specifically:
1. 0.3°C per decade was an average for the next century. It wasn’t expected to be a linear increase. So it is not failed. However, subsequent IPCC reports made lower predictions. No news there.
2. Likewise, more recent IPCC predictions have been more modest. The rise in GISS from 1990 to date, based on linear trend, is 0.5°C.
3. The quoted IPCC sentence was actually:
“Milder winter temperatures will decrease heavy snowstorms but could cause an increase in freezing rain if average daily temperatures fluctuate about the freezing point.”
It isn’t a prediction of milder winter temperatures; it’s from an impacts and vulnerability chapter. It predicts a consequence of milder winter, not really controversially. I don’t see evidence presented that winters have not in fact become milder.
4. Snow predictions – the counter evidence is just one or two winters, plus an assertion about NH snow areas which I can’t see sustained by the link.
5. Just compares two IPCC predictions. As I said, they do vary, as people workout more stuff.
6. Extreme weather – just gives one researcher’s view. IPCC has, as indicated, been cautious.
7. It’s pretty hard to argue at the moment that wildfires are decreasing. The cited statistic was particularly showing that advance of agriculture and clearing was reducing fires in savannah area. It isn’t clearly talking about wildfires.
8. Rotation – the Mitrovica link sets it out well, it’s called Munk’s enigma. Melting poles pushes one way, as damming also tends to; melting glaciers and depletion of aquifers goes the other.
9, 10. The varying predictions of sea ice and polar bears are well-known.
11. The glacier prediction was simply an error that was corrected.
etc, etc
On failure to predict,
” This was an easy prediction to make, yet it was ignored. “
That’s an odd one; it wasn’t ignored at all. The linked doc says:
“In addition to temperature and precipitation changes, climate change may also impact agriculture through greater competition from weeds, increased plant and animal disease, changes in soil nutrients and pests, and increased conflicts for available water. While these damaging effects are probably controllable, we are far from concluding what they may do the cost of agricultural production and how they will affect agricultural resources and the environment.
They are, however, probably less important than the impact that increased carbon in the atmosphere may have on plant growth. A carbon enriched atmosphere, like that under doubled CO2 concentrations, is widely believed to promote plant growth and also lead to increased efficiency in water use. This positive influence of climate change on plant growth is termed the CO2 fertilization effect. To date, there are no reliable estimates of its precise magnitude; existing ‘chamber’ studies of plant growth test separately for the effects of controlled “
2. Biomass. Odd to record this as a failed prediction, when it says re 2006:
” It was only in the last decade when it was noticed that a great majority of reports were contradicting that assumption. “Of the 49 papers reporting forest production levels we reviewed, 37 showed a positive growth trend.””
The “prediction” was actually not about climate at all, but deforestation. And yas, that has happened too.
3. “The possibility that Earth’s oceans and terrestrial ecosystems could respond to the increase in CO2 by absorbing more CO2 had not occurred to climate scientists”
That is nonsense.
4. “The scientific climate community essentially ignored the issue until 2013”
Again, just not true. One of the favoured misquotes by skeptics is the special report by Knight et all in the BAMS report of 2008. They were noting the slowdown in warming in the ENSO-adjusted record at that time.
Defending the FARCE that is AGW to the hilt.. so hilarious.
1 – 11.. ALL FAILED..
GET OVER IT !!!!
1. 0.3°C per decade was an average for the next century. It wasn’t expected to be a linear increase. So it is not failed. However, subsequent IPCC reports made lower predictions. No news there.
Because observations came in under predicted for the times in question, so we need to adjust our predictions in order to maintain some semblance of sanity to observers?
2. Likewise, more recent IPCC predictions have been more modest. The rise in GISS from 1990 to date, based on linear trend, is 0.5°C.
Again, because of 1)?
What happens when it isn’t .5, but .1?
4. Snow predictions – the counter evidence is just one or two winters, plus an assertion about NH snow areas which I can’t see sustained by the link.
Don’t you contradict yourself? Here a small span of time meant something: https://wattsupwiththat.com/2017/10/30/some-failed-climate-predictions/comment-page-1/#comment-2650037
But now it doesn’t any longer?
5. Just compares two IPCC predictions. As I said, they do vary, as people workout more stuff.
6. Extreme weather – just gives one researcher’s view. IPCC has, as indicated, been cautious
See comment to 1) above.
9, 10. The varying predictions of sea ice and polar bears are well-known.
11. The glacier prediction was simply an error that was corrected.
etc, etc
“etc., etc.,” indeed…
“Because observations came in under predicted for the times in question”
The SAR 1995 predictions were made only five years later. Hard to say that the century prediction of FAR had failed by then.
“Don’t you contradict yourself?”
No. I didn’t choose that prediction; Paul Matthews did. I just pointed out that it came out right.
Nick, the post is not news and there have been many lists like this posted over the years. But, Javier did select a pretty good set, in my opinion, at least. Among the scientific community, we all appreciate the uncertainty in all of these predictions, but among policymakers and the public not so much. They want everything to be black and white. The point of the post is do not make policy decisions based on predictions like these. I think we can all agree that calling polar bears endangered because of a prediction, rather than any evidence, is pretty stupid. Other examples include South Australia in your own country, their policies were pretty stupid, or California here in our country. Or the classic misjudgements of Germany and Japan. Speculative predictions are no basis for public policy. Wait until we know something.
Andy,
” but among policymakers and the public not so much. They want everything to be black and white.”
You can’t have that when there is a general discussion, and many people gives their views. You might as well ask why politicians don’t all speak with on voice. What happens in these lists is a selection of the extremes. If people want to make policy by selecting extremes of the range, it won’t work so well. The IPCC tried to give a more balanced version.
“South Australia in your own country, their policies were pretty stupid”
SA policies weren’t based on a prediction; they were based on an immediate need for electricity, when the excessive cost of the existing desert mining and transport of poor grade coal could not be commercially sustained. And it is working pretty well. They had a four hour blackout after a severe storm a year ago (and Puerto Rico?). Electricity is expensive, but so it was before.
Nick
“What happens in these lists is a selection of the extremes.”
I just choked on my tea!
What happens in these lists is that extreme failed predictions, made with great fanfare at the time, and with total conviction, became the extreme because they failed so spectacularly.
The worlds leading authority on Arctic ice came out and confidently terrified the gullible that the ice would be gone by 2013. That wasn’t extreme, that was presented as a statement of fact by the media and a perfectly reasonable prediction by an ‘expert’.
It’s not Javier that’s citing extreme examples, it’s those making the proclamations of impending doom that are making extreme claims.
“South Australia in your own country, their policies were pretty stupid”
SA policies weren’t based on a prediction; they were based on an immediate need for electricity, when the excessive cost of the existing desert mining and transport of poor grade coal could not be commercially sustained. And it is working pretty well. They had a four hour blackout after a severe storm a year ago .
Errrr no ! Your information is based on what ? SA got out of coal because they were trying to save the planet mate ! Period .
Based on what Alinta said. Alinta, the owner, is a commercial enterprise, and couldn’t make it work.
Not sure you understand the handouts given to renewables ? But more than likely you do so you must realise exactly what and why Alinta have said that .
I’m pretty sure it was the state govt that pushed the construction of the wind turbines and also sure they did it to save the world as they have stated over and over again .
Nick,
Those predictions, whether new or not, have been and still are being widely circulated through the mass media to scare people silly about climate change, so the point is not that some predictions are bound to be incorrect. The entire alarmist building is raised on false premises.
1 & 2. Just read it
http://www.ipcc.ch/ipccreports/far/wg_I/ipcc_far_wg_I_spm.pdf
They are very specific about what to expect by 2025. Of the 35 years, 28 have already passed. The expected increase and rate of increase has not happened by a big margin.
3. They talk about the consequences of milder winters because milder winters were expected. They did not talk about the consequences of harsher winters due to global warming until harsher winters appeared.
4. NH Snow cover unchanged. Not my problem if you can’t find the data.
http://www.climate4you.com/images/NHemisphereSnowCoverSince1972.gif
5. The first prediction of water stress due to lack of precipitations was shown unsustained, as eventually all drastic predictions will.
6. You don’t read the press, do you? We are constantly bombarded by claims from alarmist scientists that climate change is making weather extremes oh so much worse. Do I have to look for the link where Michael Mann was saying how Harvey was made worse by climate change? Failure to predict shows they are bogus.
7. Can you prove that wildfires have increased? I can prove that in the EU wildfires have decreased. This is consistent with the article that clearly states that overall fires are decreasing. Not precisely the promised scenario.
8. Munk’s enigma was published in 2002. The predictions and explanations that go the opposite way were published later. Mitrovica’s explanation of Munk’s enigma is controversial. William Peltier, who was Mitrovica’s thesis advisor, says it is wrong.
https://www.washingtonpost.com/news/energy-environment/wp/2015/12/11/scientists-may-have-just-solved-one-of-the-most-troubling-mysteries-about-sea-level-rise/
9 & 10. Well known Arctic sea ice predictions and well laughed at.
11. The glacier prediction showed what the IPCC considered acceptable sources, and how much they took into consideration their own reviewer warnings. The whole IPCC process is contaminated by bias from its very set up as a panel dedicated to find an anthropogenic effect on climate change.
B1. Oh yes, Sherwood Idso did predict the greening
Industrial age leading to the greening of the Earth?
https://www.nature.com/nature/journal/v320/n6057/abs/320022a0.html
But as he was immediately labeled as a skeptic, or worse, I don’t think you can count that on the side of the warmists, or even consensus builders.
Sherwood Idso label at Wikipedia:
https://en.wikipedia.org/wiki/List_of_scientists_opposing_global_warming_consensus
So that one is a score for the skeptics.
B2. Deforestation was believed to be a more important factor driving a global loss of forests. Just the opposite has been found.
B3. The missing sink was all the fuss in the early 90’s carbon budget accounting. They weren’t able to predict the observed increase in the sinks and they could not understand it for quite some time after observing it. Clearly it was not expected.
B4. The Pause was never predicted. The possibility that the warming rate could actually go down while CO2 was increasing was not considered in the literature before it happened. Most of the literature on the pause is from 2013 onward. Finding an earlier paper disproves nothing. The issue was ignored until it became impossible, and attempts are still being made at erasing the pause from the records.
Since you are not an alarmist. Why would you defend them when they are clearly and demonstrably so wrong?
+10
+10
Javier,
On (1), I don’t believe it is Scen A. Here is the CO2 plot, with my lines:
And CH4 and CHCs lagged more. For Scen A they gave an average trend for the century of 0.2 – 0.5 C/dec. For Scen B, their center value was 0.2°C/decade. It’s reasonable to assume a range applies there too. The GISS trend from 1990 to now is 0.187°C/decade. Doesn’t sound like a fail.
Nick,
When a prediction fails it is obvious that the conditions have changed. Thomas Malthus predicted a catastrophe in 1798 due to population growing exponentially and food growing arithmetically. The catastrophe didn’t happen because food grew much faster than he anticipated. Doesn’t sound like a prediction fail to you?
IPCC predicted a warming under an emissions scenario. The emissions scenario took place, the warming didn’t. They failed to consider the increase in carbon sinks. Malthus failed to consider the increase in food production. But in the case of Malthus it is clear that without the food increase the catastrophe would have taken place. In the case of the IPCC it is unclear that even if the predicted CO2 increase would have taken place, the predicted increase in temperatures would have taken place. We still don’t know the response of temperatures to CO2.
Nick forgets to say that CO2 rise has been business as usual.
MASSIVE FAILURE !!
And of course , as we all know…
The ONLY warming in the satellite temperature record has come form El Nino and ocean effects.
No El Nino….. No warming. NO CO2 signal WHAT-SO-EVER.
GISS is, as we all well know, is deliberately “adjusted” to try and help the myth of CO2 warming.
That make any comparison of reality with GISS, totally and utterly meaningless.
Javier,
“IPCC predicted a warming under an emissions scenario. The emissions scenario took place, the warming didn’t.”
No, they predicted under a concentration scenario. I showed the plot from the FAR. In fact in 1990 they didn’t really have good emissions data. That was collected as a result of the UNFCCC.
Nick,
Since you demonstrate knowledge of IPCC reports, it is unclear to me why you are lying about this.
Exact quote:
First Assessment Report. Working Group I. Policymakers Summary. Page XXII.
http://www.ipcc.ch/ipccreports/far/wg_I/ipcc_far_wg_I_spm.pdf
Nick…I appreciate that you responded to the article rationally, but your response reminded me of the old joke about the breakfast cereal that claimed to be high in calcium (if you ate it with milk), and high in iron (if you also ate the spoon). In other words, The AGW crisis theory has no substance. You are nitpicking, while avoiding the obvious conclusion that overall predictive skill of the AGW theory that supports a climate crisis is in the ‘even a blind squirrel occasionally finds a nut’ category.
I will concede that the article is not strictly a critique of the IPCC science, but is targeting some of the most infamous and most widely disseminated predictions used to influence populations and policy-makers. Does it really matter if the IPCC is so vague, that it actually gets some observation to fall within the bounds of it’s gaping conjecture? NO! What matters are the arguments driving policy and public opinion. Those arguments have the remarkable record of being incorrect 100% of the time. And that is the point of this article.
I don’t have the time to respond to every point you made, but I wanted to point out something about this one:
“This positive influence of climate change on plant growth is termed the CO2 fertilization effect. To date, there are no reliable estimates of its precise magnitude;…”
What passes for climate science these days is basically sweeping conjecture built on weak assumptions extended out for decades to produce dire scenarios. Perhaps the most well known (proven) aspect of adding CO2 into the atmosphere is the CO2 fertilization effect. Practical applications of this science have been around for decades. There have been many studies with observed, quantifiable results. There are tons of hard data on the effect. There are no assumptions in need of defending. There is no need for sweeping conjecture to support the idea of it. Yet, the IPCC dismisses it with ‘there are no reliable estimates of its precise magnitude…’.
It would be funny if it wasn’t so sad.
The one thing we truly understand about adding CO2 to the atmosphere turns out to be wonderfully positive, but it is made inconsequential with the statement that there are no reliable estimates of its magnitude. On the other hand, the IPCC is ready willing and able to go in great depth about any seemingly negative consequence of increasing atmospheric CO2 without any physical evidence or observable quantification in the slightest! If the IPCC was honest, it would conclude every discussion about surface temperature change, tropospheric temperature change, sea level change, economic impacts, agricultural impacts, human health impacts, biosphere impacts etcetera, with the phrase “there are no reliable estimates of the precise magnitude of these things, but we do know the CO2 fertilization effect will be a great boon to humanity!”
Of course, the IPCC wasn’t created to be honest. It was created to build a case against emitting CO2 into the atmosphere, with the illusion of being scientific. Despite the huge financial support, the collusion, the spinning of the language in the Summaries for Policy Makers, and the remarkable complicity of a fawning media, it is failing.
“Yet, the IPCC dismisses it with ‘there are no reliable estimates of its precise magnitude…’.”
It’s simply true. There were no reliable estimates of its precise magnitude. And there still aren’t. Of course you can measure a response in controlled conditions. But in the wild, where water stress varies hugely over time and space, the effect of CO2 on viability is very hard to estimate.
Nick, It has been measured in the wild, even by the IPCC: “Satellite data shows that the Earth is greener now than in the 1980’s by 6 to 13%. Dr. Ranga Myneni (Boston University) estimates a 14% increase in ecosystem productivity in the past 30 years. The IPCC WG1 AR5 Report discusses the CO2 fertilization effect on page 502. They estimate a greening of the Earth, due to warming and CO2, of 6%. This is at the low end of published estimates.” There are also other estimates in the “wild” see here: https://andymaypetrophysicist.com/co2-good-or-bad/
It is the only quantifiable effect of additional CO2 that I know of.
Nick,
In the real world, more CO2 relieves water stress for C3 plants because they need take in less water to make the same amount of sugar. The stomata of their leaves need stay open for less time to take in the same amount of CO2, hence less water loss via transpiration.
Surely you must know this.
Andy,
“The IPCC WG1 AR5 Report discusses the CO2 fertilization effect on page 502.”
Well, that’s clear proof that they aren’t ignoring it 🙂 But the article linked was from 2005. And it seems that their statement was true at that time.
“It is the only quantifiable effect of additional CO2 that I know of.”
What are you having so much trouble understanding, Nick ?
CO2.. Great for all life on Earth…
Get used to it..because , if humans have any input, its just going to keep on increasing.

“Yet, the IPCC dismisses it with ‘there are no reliable estimates of its precise magnitude…’.”
It’s simply true. There were no reliable estimates of its precise magnitude.”
Yes…it is simply true. Would you argue if I said that the exact same statement is even more appropriate for the rest of the IPCC reports and all of their projections?
Gabro,

“Surely you must know this.”
I have known about CO₂ and stomatal gas exchange for over 40 years. And the IPCC has always spoken of it too. Here is what the said in the FAR (1990):
Nick,
The link doesn’t work. I’d rather not wade through the whole FAR to find the relevant passage.
Suffice it to say that the fact that more CO2 means more vegetation is not only settled science, but indisputable.
That more CO2 poses a threat of catastrophic global warming is not only not settled, but already repeatedly shown false.
Thanks for showing the passage.
The studies citing no effect from more CO2 are hopelessly out of date. The effect is immediate and highly positive on C3 plant growth, both under controlled lab conditions and in the field.
PS:
Remarkably enough, higher CO2 also reduces water need even for C4 plants, as found in this 2011 study of corn (maize):
https://naldc.nal.usda.gov/download/48707/PDF
Effect of elevated carbon dioxide and water stress on gas exchange and water use
efficiency in corn
The FAR, as with all subsequent IPCC reports, is a pack of lies and shouldn’t be relied on for any purpose other than hygiene in outhouses without water.
I have spent the past 30 years listening to predictions of doom. Whenever I questioned one of the predictions I was called names. I filed the predictions away mentally, waiting to let reality reveal itself. Now we have reality, and it justifies the skepticism I felt over the years. Yet the people who were so adamant that “the science is settled” now say things like “this (failed prediction) was known for a long time” or “there was always a range of opinions”.
In the big picture no one gives a hoot about the bruised feelings of the occasional skeptic. But everyone should wonder which of the current predictions of doom will not only fail, but will also be excused with lines such as predictions do change over time “as people work out more stuff”.
Nick Stokes:
I appreciate the time you have taken to respond to some of these remarks. You recognize that predictions of a chaotic system must necessarily at times be wrong; but that’s not really the issue for me.
The problem is that by the time all this science is presented to policymakers, uncertainty and caution is gone and we must all act NOW or face certain doom. It is a standard FUD approach and many people are conditioned by generations of advertisers, con men and their own children to be on guard for any kind of hasty behavior change demand.
My personal favorite failed prediction is Dr. David Viner’s “children just aren’t going to know what snow is” comment. I doubt he intended it as a scientific prediction but the sheer boldness of it, combined with the loud “thud” one hears from its collapse, casts a shadow, maybe a cloud, maybe a thick wooly blanket over the whole entire climate change industry.
“It isn’t a prediction of milder winter temperatures; it’s from an impacts and vulnerability chapter.”
I appreciate the importance of that nuance; does that nuance make the trip to popular media such as National Geographic? I think not. Maybe in the fine print it might be there. I agree that risk assessments must explore all risks however unlikely and if everyone sought to avoid all risks I think the only habitat on Earth remaining would be Lancaster County, Pennsylvania.
“7. It’s pretty hard to argue at the moment that wildfires are decreasing.”
It is certainly so in the mountain west of the United States where a few years ago it seemed everything was burning. I suspect it is somewhat cyclic; fuel hasn’t regenerated sufficiently for another round of fires.
Some rich people in Napa get houses burned and it is big news; Idaho finally getting a respite from burning isn’t news; except of course to the people in Idaho. If you build your fancy house in the midst of fuel one ought to expect being burned from time to time.
“9, 10. The varying predictions of sea ice and polar bears are well-known.”
Indeed.
“11. The glacier prediction was simply an error that was corrected.”
Agreed; but that isn’t how it was presented. Was the correction plastered on the front page of major worldwide publications? Not that I remember. The magnitude of the error ought to have gotten someone’s attention except that it fed into the confirmation bias of the editors.
It’s a futbol game, FIFA challenge! WUWT will notice and highlight team CAGW fouls and missteps looking for that free kick. Team CAGW will do likewise of course.
Referees? Not in this game.
It was NOT a typo, as you insinuate. It came from the gray literature, and IGPOCC failed to correct it when an Austrian IGPOCC member contacted it, twice, about it (claiming it wasn’t sent to the right department). Patchy defiantly persisted in defending it.
PS: it’s noteworthy that the IGPOCC dept. that received these emails didn’t either: A) forward them to the correct IGPOCC dept. or B) Tell the sender to address his email to that other dept himself.
You can say that it should have been corrected more gracefully. But it was corrected, so it isn’t right to count it as a prediction.
Nick, what do you mean that a corrected prediction doesn’t count? Every doom-sect leader keeps correcting the date of the end of the world as the date arrives and nothing happens. Do they get credit for corrections?
A prediction corrected is an original prediction failure. People were scared and urged to act by the original prediction.
Javier,
It wasn’t corrected because of the unfolding of new facts. It was corrected because someone stuffed up the document process, and this was (eventually) acknowledged and corrected.
Nick: “someone stuffed up the document process”
That sounds close to “the dog ate the homework.” The IPCC has all sorts of review mechanisms to prevent faux pas of this sort. The 2035 prediction could not have been the mistake of an errant copy editor. The Asia Group co-heads in the Impacts section (WG2) (Lal and someone else) approved it over the objections of the expert reviewer from Japan). He was told that a correction would be made, but it wasn’t. This suggests complicity by the higher-ups. So does the statement Lal initially made (and subsequently disavowed) to David Rose of the Daily Mail — that “we” wanted to motivate governments to act by including this forecast.
IGPOCC cannot credibly deflect blame for this alarmist hype onto “someone.”
Being an outsider in the climate change debate, I am not too comfortable in the weeds of climate science, especially about the fine distinctions between climate and weather. The usual metric for measuring the success or failure of a prediction, whether short-term or long-term, appears to be temperature. The quantum mechanical behavior of oceans and the atmosphere might as well be represented by a black box. The basic problem is to understand what the output of the black box, the planet’s temperature, can tell us about future temperatures. Frequencies of hurricanes, wildfires and droughts, the number of polar bears on ice bergs, the waxing and waning of glaciers, sea level rises and falls and all other proxies for temperature are lower quality metrics with no significant historical records. They simply muddy the waters.
If not already done, I suggest greater attention should be given to melding long- and short-range temperature databases to identify and analyze the frequency contents. Temperature is the only global climate science metric with time-series databases ranging from over 400,000 years to less than a day. If a predictable temperature trend cannot be recognized from those databases with enough accuracy to guide policy decisions, try a different line of work.
My first attempt to better understand the problem is a simple numerical analysis of the HadCRUT4 time-temperature series. The following graph shows the rate of increase (first derivative) of the global mean temperature trend-line equation, which has been constant or steadily decreasing since October 2000. The HadCRUT4 temperature anomaly has decreased by nearly 40 percent from March 2003, the El Nino peak, to July 2017. The rate of change of the trend-line will likely become negative within the next 20 years, reaching the lowest global mean trend-line temperature in almost 40 years. (draft ref: An-Analysis-of-the-Mean-Global-Temperature-in-2031 at http://www.uh.edu/nsm/earth-atmospheric/people/faculty/tom-bjorklund/)
The goal of climate studies should be to successfully predict global mean temperatures within a range of values narrow enough to guide public policy decisions. Hoping to model the planet or the solar system is overreach. Assign a student the problem of doing a Fourier analysis of the data.
A final thought: If climate and weather are not comparable, but GCMs are just modified weather forecasting models, why should the GCMS work?
“The HadCRUT4 temperature anomaly has decreased by nearly 40 percent from March 2003, the El Nino peak, to July 2017.”
It makes no sense to talk of percentages of anomalies, since it depends on what base period you choose. But this makes no sense; March 2003 was 0.45°C; July 2017 was 0.653. There is no sensible measure in which HADCRUT has decreased since 2003.
Nick: My bad. The base period was not the problem. I originally was responding to a comment by someone who chose to emphasize the run-up in temperature to the El Nino peak in March, 2016. I simply wanted to point out that since March, 2016 the temp anomaly had declined about 40 percent by July, 2017. Obviously, the El Nino peak was not in March,2003. A stupid exchange on cherry-picking. I regret I got involved and apologize to the readers for my sloppy editing. Thank you for commenting.
“…It makes no sense to talk of percentages of anomalies, since it depends on what base period you choose…”
Anomalies themselves depend on what base period you choose as well. So now they make no sense as well? lol
Nick and Tom, We have been in two natural warming trends, one is very strong and long term and it continues as we come out of the little ice age, it will last another 1,500 years or longer. The second is shorter, and it ended between 2005 and 2009. The shorter one (the “stadium wave”) is about 62 years and it has peaked, so we should see some natural cooling over the next few decades. The man-made warming, if it exists, is monotonic and should add. But, we cannot know the magnitude until we understand how much is natural, and we won’t know that for decades to come.
“so we should see some natural cooling over the next few decades”
Andy, you restated almost exactly what I said in the sentence, “The rate of change of the trend-line will likely become negative within the next 20 years, reaching the lowest global mean trend-line temperature in almost 40 years.” My analysis is only relevant for a short-time frame. I do not know the basis for the 1500 year prediction. I could argue in less than 1500 years maybe in a few decades, the planet will be entering the next glacial period simply by comparison to the frequency and length of past glacial periods and the present short-term cooling trend.
Tom, Javier explains the longer cycle, the “Bray” cycle in his posts. See here
https://andymaypetrophysicist.com/2017/08/08/the-effects-of-the-bray-climate-and-solar-cycle/
to get started on that, it is a 2450 year cycle. The stadium wave (~62 years) is best explained here: http://www.wyattonearth.net/thestadiumwave.html
Andy says:
“We have been in two natural warming trends, one is very strong and long term and it continues as we come out of the little ice age, it will last another 1,500 years or longer.”
It’s imaginary, CET shows no warming trend between 1730 and 1930.
“The second is shorter, and it ended between 2005 and 2009. The shorter one (the “stadium wave”) is about 62 years and it has peaked, so we should see some natural cooling over the next few decades.”
The AMO envelope is about 69 years, so on that basis it should return to its cold phase from the mid 2030’s. I would expect to see it peak a few more times until then.
I have always been puzzled as to why the benchmark for temperature rise is referred to as “Pre Industrial” when they really mean “Peak Little Ice Age”.
Because otherwise everyone will understand right off the bat that worrying about a warming trend is flat-out ludicrous.
All of this nonsense to try and achieve Maurice Strong’s political aims of an unelected socialist-marxist global government.
“In searching for a new enemy to unite us, we came up with the idea that .. the threat of global warming.. would fit the bill…. the real enemy, then, is humanity itself….we believe humanity requires a common motivation, namely a common adversary in order to realize world government. It does not matter if this common enemy is a real one or…. one invented for the purpose.” Maurice Strong – speech to Club of Rome – and “invented” referred specifically to ‘Global Warming !
I understand why low-intellects types like Johnson, Ivan etc would fall for this agenda driven crap.
But why seemingly intelligent people like Nick, fall for it, is beyond me. !!
The meme is embraced by statists of every variety. And some of them are very intelligent.
Ivankinsman at 09:27 The record rise is CO2 is reportedly 0.6 of a ppm, or 0.00006%. Terrifying stuff, clearly.
The report also states that last time we had this same epic concentration, 800kya, it was 2-3C warmer than now.
This rather obviously demonstrates no causative effect between CO2 and temperature, as otherwise it would be the same temp now as then for the same concentration.
(Edited) MOD
“The record rise is CO2 is reportedly 0.6 of a ppm…..”
https://ane4bf-datap1.s3-eu-west-1.amazonaws.com/wmocms/s3fs-public/ckeditor/files/GHG_Bulletin_13_EN_final_1_1.pdf?LGJNmHpwKkEG2Qw4mEQjdm6bWxgWAJHa
“The latest analysis of observations from the WMO GAW
Programme shows that globally averaged surface mole
fractions(2) calculated from this in situ network for CO2,
methane (CH4) and nitrous oxide (N2O) reached new highs
in 2016, with CO2 at 403.3 ± 0.1 ppm, CH4 at 1 853 ± 2 ppb(3)
and N2O at 328.9 ± 0.1 ppb. These values constitute,
respectively, 145%, 257% and 122% of pre-industrial
(before 1750) levels. The record increase of 3.3 ppm in
CO2 from 2015 to 2016 was larger than the previous record
increase, observed from 2012 to 2013, and the average
growth rate over the last decade. The El Niño event in
2015/2016 contributed to the increased growth rate through
complex two-way interactions between climate change
and the carbon cycle.”
““The record rise is CO2 is reportedly 0.6 of a ppm…..””
GREAT NEWS.. Those 1600 coal fired power stations going in around the world will only help that CO2 keep climbing….
….. to the absolute BENEFIT of all life on this CARBON BASED planet of ours.
Hurray!
Well done volcanoes, oceans, and humans making bread, beer, and burning all fuel and that input from streams and rivers (see http://harvardforest.fas.harvard.edu/sites/harvardforest.fas.harvard.edu/files/publications/pdfs/Butman_NatureGeoscience_2011.pdf)
Keep up the good work!
Onward to 600ppm and beyond…
So that would be *no* causative effect. Shucks.
Javier,
Thanks for all this work.
With increased snowfall, but wind and summer temperatures unchanged, why should more glaciers be retreating than advancing now, compared with AD 1850 to 1950?
I should add sea level rise at the same rate, too, which could affect those glaciers which reach the saltwater.
I don’t know. The relationship between temperatures and glaciers is not straight forward, as there appears to be a delay. For example many glaciers experimented a rapid decline between 2001-2007 when temperatures were not increasing.
In his 2005 Science article, Oerlemans studied 169 glaciers worldwide. The fall is rapid and sustained.

He then did a very interesting thing and reconstructed temperature changes from glacier changes.

But to me the important question is that globally glaciers are at their lowest extent in thousands of years according to experts. Most agree they are at their shortest in 3000-5000 years on average. And this agrees very well with what small permanent ice patches are saying. They are releasing organic materials buried 3000-6000 years ago. We don’t have a good explanation for that. It shouldn’t be that way. In terms of continental ice the entire Neoglacial period has been erased. I find this remarkable.
Thanks.
Oerlemans clearly studied the wrong glaciers. On average, they advanced during the LIA and have retreated during the Current Warm Period, same as during cool and warm cycles of this and all prior interglacials.
That the East Antarctic Ice Sheet is growing and Greenland stable should indicate that something is wrong with Oerlemans’ mountain glacier “data”.
While many little glaciers might be retreating, some very big ones are staying the same or growing, and on every continent that has them. In some areas, they are both waxing and waning.
Drought in the Pacific NW shrank some of our glaciers in this decade, but they’re already growing again, thanks to the Super El Nino snowfall last winter.
This analysis of Oerlemans 2005 is like the original paper, already outdated, but shows that the most rapid recession was in the past, in the first decades after the end of the LIA, with the retreat rate flattening out more recently, despite rising CO2.
http://www.climate-skeptic.com/2008/09/retreating-glac-2.html
http://www.climate-skeptic.com/images/2008/09/14/glacier_length.jpeg
Or rebounding in the NZ case.
NSIDC keeps data on some 131,000 glaciers, at last count, so choosing 169 provides ample opportunity for cherry-picking.
Gabro,
I have over 40 scientific articles on this issue, and all but one agree that the present glacier situation is the most reduced in 3000-5000 years. It seems everybody is studying the wrong glaciers. Perhaps you can point me to bibliography studying global or regional glaciers that reaches a different conclusion.
That’s exactly what should be expected. At the start of the retreat glaciers were at their maximum extension and most vulnerable. Glaciers have now retreated to their highest, most resistant ranges. There is always more melting in the early spring than in late spring, and the last patches of snow take a long time to go.
To me the important question is that according to nearly all authors, globally glaciers are at their most reduced state in the late Holocene.

Figure from J. Koch & J.J. Clague 2006 article: “Are insolation and sunspot activity the primary drivers of Holocene glacier fluctuations?” They are clearly not consensus scientists. They don’t even mention CO2. The out of trend situation is very clear (trend lines added by me).
Of course there is regional and individual variability in glaciers, but unless you can produce scientific articles that contradict this statement, I’ll continue to believe what the evidence shows. As such strong reduction goes against the Neoglacial trend, it demands an explanation. So either temperatures are higher than at any time in the past 3000-5000 years, or CO2 has a specific enhanced effect on glacier extent, or both. Since due to multiple proxy evidence I don’t believe temperatures are higher now than at any time in the past 3000-5000 years (see https://judithcurry.com/2017/04/30/nature-unbound-iii-holocene-climate-variability-part-a/), the most likely explanation to me is the second one. Theory says CO2 competes with water vapor for its radiative effect and thus will have maximal effect when minimal water vapor is present. Observations confirm that temperature increase is higher for winter, night minimum temperatures, when water vapor is lowest. As glaciers are very cold, the air above them is lower in water vapor, so they should be more sensitive to CO2.
I believe, based on evidence, that the increase in atmospheric CO2 is specifically causing an unusual glacier retreat bigger than what would be caused by the increase in temperatures alone. To me the effect of CO2 is real, just not alarming, and on average net positive.
For me to change this opinion would require several independent scientific articles that show evidence that during the Roman warm period glaciers were more reduced than now, and not only in the Alps, in other regions of the Northern Hemisphere or the tropics too. The Southern Hemisphere has an opposite insolation evolution due to Milankovitch forcing, so it is not comparable.
Javier,
No one gets rewarded for or could even get published a paper which stated the truth, which is that maybe half of glaciers are retreating (probably fewer), a fourth static and fourth advancing (probably more). Which doesn’t take size into account. Size matters.
Cherry-picking to support an agenda, as glacier studies do, is not science. Glaciers are growing on every continent with them, so CO2 can’t be to cause of the retreat of those of their neighbors which are receding.
The Antarctic ice sheets, repository of about 90% of the freshwater on Earth’s surface, not just of its ice, are growing. Mountain glaciers aren’t a pimple on the posterior of the Antarctic and Greenland ice sheets.
You are absolutely wrong. If that was what the data showed, it would certainly get published. But it isn’t. You accuse most scientists in a subfield to participate in a conspiracy to hide the truth. You should be wearing a tin hat.
And the climate of Antarctica has very little to do with the climate of the rest of the planet. Its surface sits at ~3 km high on top of a huge mass of ice nearly at the stratosphere, without ozone, and isolated both by a circular oceanic current and the Southern Annular Mode. It might as well be in a different planet.
Your reasons to reject the glacier evidence are unscientific, so I won’t have anything to do with them.
Javier,
It’s not just Europe, North America, Africa and Asia, but South America, New Zealand and Antarctica. Today’s glacial retreat is nothing special.
You don’t have to go back as far as the Roman WP. Southern hemisphere glaciers receded farther during the Medieval WP than they have so far in the Current WP:
http://scienceandpublicpolicy.org/images/stories/papers/originals/medieval_warm_period.pdf
“The results they obtained by these means indicated peat from the overrun sediments dated to between 707 ± 36 and 967 ± 47 cal. yr B.P.,” which led them to conclude, “ice was at or behind its present position at ca. 700-970 cal. yr B.P. and during at least two earlier times, represented by the dates of shells, in the mid-to-late Holocene.” Then, in language pure and simple, the three researchers say their findings imply that “the present state of reduced ice on the western Antarctic Peninsula is not unprecedented.” This leads them to pose another important question: “How widespread is the event at 700-970 cal. yr B.P.?”
“In answering their own query, the researchers respond that (1) “Khim et al. (2002) noted a pronounced high productivity (warm) event between 500 and 1000 cal. yr B.P. in magnetic susceptibility records from Bransfield Basin,” (2) “dates of moss adjacent to the present ice front
in the South Shetland Islands (Hall, 2007) indicate that ice there was no more extensive
between ca. 650 and 825 cal. yr B.P. than it is now,” (3) “evidence for reduced ice extent at 700-
970 cal. yr B.P. is consistent with tree-ring data from New Zealand that show a pronounced
peak in summer temperatures (Cook et al., 2002),” (4) “New Zealand glaciers were retracted at
the same time (Schaefer et al., 2009),” and (5) their most recent findings “are compatible with a
record of glacier fluctuations from southern South America, the continental landmass closest to
Antarctica (Strelin et al., 2008).” In light of these several observations, therefore, it would
appear that much of the southernmost portion of the Earth likely experienced a period of significantly enhanced warmth within the broad timeframe of the planet’s global MWP. And
this interval of warmth occurred when there was far less CO2 and methane in the atmosphere
than there is today.
“In one additional study from the Antarctic Peninsula, Lu et al. (2012)4 constructed “the first
downcore δ18O record of natural ikaite hydration waters and crystals collected from the
Antarctic Peninsula (AP)” that they say were “suitable for reconstructing a low resolution ikaite
record of the last 2000 years.” According to the group of nine UK and US researchers, ikaite “is
a low temperature polymorph of calcium carbonate that is hydrated with water molecules
contained in its crystal lattice,” and they write that “ikaite crystals from marine sediments, if
collected and maintained at low temperatures, preserve hydration waters and their intact
crystal structures, both of which have the potential to provide isotopic constraints on past
climate change.” So what did they find?
“The authors report that “the ikaite record qualitatively supports that both the Medieval Warm Period and Little Ice Age extended to the Antarctic Peninsula.” They also state that the “most recent crystals suggest a warming relative to the LIA in the last century, possibly as part of the regional recent rapid warming,” but they add that “this climatic signature is not yet as extreme in nature as the MWP,” suggesting that even the dramatic recent warming of the AP may not yet have returned that region to the degree of warmth that was experienced there during the MWP, when the atmosphere’s CO2 concentration was more than 100 ppm less than it is today.
“Examining a different region of the continent, Hall and Denton (2002)5 mapped the distribution and elevation of surficial deposits along the southern Scott Coast of Antarctica in the vicinity of the Wilson Piedmont Glacier, which runs parallel to the coast of the western Ross Sea from McMurdo Sound north to Granite Harbor. The chronology of the raised beaches they studied was determined from more than 60 14C dates of incorporated organic materials they had previously collected from hand-dug excavations (Hall and Denton, 1999); the record the dates helped define demonstrated that near the end of the Medieval Warm Period, “as late as 890 14C yr BP,” as Hall and Denton describe it, “the Wilson Piedmont Glacier was still less extensive than it is now,” demonstrating that the climate of that period was in all likelihood considerably warmer than it is currently.”
So you say.
And you keep bringing the Southern Hemisphere and particularly Antarctica to the discussion, when I have already explained to you the reasons why they are not relevant. Take a look at the insolation curves. They go the opposite way in both hemispheres.
Javier
The insolation curves in the southern hemisphere do go “the opposite way” than those up north, but, you see, the effect of the greater sunlight over longer periods of the year around Antarctica means that any given sq meter at the edge of the Antarctic sea ice reflects 1.7 times the energy (over the full year ) that the an equal area of Arctic sea ice reflects or absorbs. Thus, the ever-increasing Antarctic sea is nearly twice as important as the Arctic sea ice.
Further, seven months of the year, loss of Arctic sea ice from its 1979-2009 average means GREATER COOLING losses from the newly exposed Arctic ocean!
I am aware, RACookPE1978, but the issue we are discussing here is if global glaciers are in an unusual situation for their Holocene evolution or not. Sea ice and polar ice sheets are not relevant for this specific point.
BTW, Koch and Clague have indeed joined the CACA Borg:
https://www.researchgate.net/publication/225622933_Extensive_glaciers_in_northwest_North_America_during_Medieval_time
Their 2011 paper above shows that they have joined the fight to get rid of the Medieval WP, whatever you might have concluded from their 2006 paper.
You are just seeing ghosts. Whoever doesn’t share your views is part of a conspiracy. Way to go.
Javier,
You really imagine that there is no CACA conspiracy?
As in, “We need to get rid of the Medieval Warm Period”? “We need to get that editor fired”? “Mike’s Nature trick (to hide the decline)”?
Where have you been?
I am a scientist. I know 97% of scientists are NOT involved in any conspiracy. Just doing their job. A few examples don’t make a rule. You say these glacier scientists are making up their data. I say you don’t know what you talk about.
Javier November 1, 2017 at 6:37 am
OK, so let me get this straight. Based upon cherry-picked glaciers, you’re convinced that mountain glaciers have retreated farther than at any time since the Holocene Climate Optimum, if not farther. The Alps, which show that we still haven’t reached the Roman Warm Period level, don’t count. The many glaciers in Asia and North America which are advancing don’t count. And the whole Southern Hemisphere doesn’t count, to include not just Antarctica but South America and New Zealand.
Nor do the Antarctic Ice Sheets, with 90% of the world’s surface fresh water count.
So, only those glaciers which are retreating count.
And you suppose that this selectivity to be science?
You are doing the selectivity. I am doing my reading of the scientific literature. You don’t trust science. I do. Science will sort this mess out, you won’t.
Javier November 1, 2017 at 6:40 am
You’re clearly seeing what you want to see, and disregarding the rest.
You are entitled to your opinion. I am spoused to the evidence, because all the rest just can’t be trusted. And the evidence is found in the data from the scientific literature.
As of course are you.
I showed you the scientific literature for the Southern Hemisphere, cited in the link provided. There are lots of other such studies.
Sorry, but the 40 papers upon which you rely are clearly part of the CACA conspiracy.
That there is a conspiracy isn’t in doubt, based upon the facts. It’s possible to wonder about the motives of all those in on it, but that it exists, no.
A cherry-picked sample from 2005 of 169 glaciers out of more than 130,000 is probably not representative.
Show me a better study with more glaciers from all over the world and perhaps you will convince me.
Javier,
My link wasn’t to a single study, but dozens of them.
Consider where glaciers are located: 85% in Antarctica, 10% in Greenland and just 5% in mountain belts, such as the Andes, Himalayas, Alps and North American Cordillera. Those attached to the Antarctic and Greenland ice sheets are also on average more massive.
Given growth in Antarctica, how can glaciers overall possibly be retreating to the lowest points since the Holocene Climatic Optimum? That is, without cherry-picking them.
Gabro,
Polar glaciers are a different story. The same way as glaciers that end in the sea or on land behave very differently. Everybody knows that Antarctica Holocene climate evolution is different to the rest of the planet. Antarctic ice cores are quite different to Greenland ice cores.
Javier,
If there weren’t an academic-government CACA conspiracy, you and I could use our real full names.
Gabro, I personally know hundreds of scientists. I assure you not a single one of them is part of any conspiracy. Even if convinced of a wrong theory, all of them are always very careful to get their data correct, because without good data there is no science, and the data is often the only thing that survives a scientific work as hypotheses change and theories evolve. If you tamper with your data you are essentially erasing yourself from science. You will not be cited in the future and you will be forgotten.
The problem is elsewhere. This scientific dispute has far reaching social, economic, and political consequences. The people that control science can decide who gets more funding and who is going to be listened by the media.
There is no ample scientific conspiracy. A few scientists putting their interest ahead of science is clear. Many scientists trying to take advantage of the situation is very likely. Most scientists trying to hide the truth and altering or selecting the data is impossible.
Javier November 1, 2017 at 4:43 pm
You really don’t think that Mann, Jones, Overpeck, et al weren’t conspirators?
Have you read the Climategate emails?
If you’re not afraid of retribution by the academic and governmental science powers that be, why not use your full, real name?
You could also add to that failed list Southern Hemisphere “expert” such as Prof Tim Flannery predictions from Oil prices, rivers not flowing, Dams not filling, Snow not falling most neatly captured by local politician Craig Kelly in this post https://m.facebook.com/CraigKellyMP/posts/473769536151019:0
my personal favourite was prophesising increased cyclone activity in 2016 (at a time when the empirical data was showing a long term trend downwards in frequency and severity) 2016 turned out not one cyclone and 2017 is continuing the downward trend.
http://www.bom.gov.au/cyclone/climatology/trends.shtml
All of these things actually happened…..in an alternative, holographic universe. Just not in this one.
Doesn’t the nonexistent tropical tropospheric hotspot prediction from GC models count as a failed prediction?
And the AGW assumption that the atmosphere will heat up faster and more than the surface?
Surely those are epic failures of CACA prognostication.
Yes the failure is catastrophic since a part of the Troposphere that was supposed to warm,actually COOLED a little,the rest warmed by less than half the predicted rate.
http://www.climate4you.com/images/EquatorSurface300hPa200hPaDecadalTempChange%20BARCHART.gif
The chart posted in May 2013 here, http://www.climate4you.com
The models would have some utility if they were always 180 degrees off target, but unfortunately, the amount of their wrongness varies.
A mere fleshwound!
“Climate scientists” are generally too lazy to try models based on something difficult to measure, like photosynthesis, preferring, instead, to base their models on something easily obtainable, like CO2 concentration.
“Reality check: Since 1990 the warming rate has been from 0.12 to 0.19°C per decade depending on the database used, outside the uncertainty range of 1990. CO2 emissions have tracked the “Business as Usual” scenario. …..”
“CO2 emissions have tracked the “Business as Usual” scenario”
Apparently not.
“outside the uncertainty range of 1990”
They didn’t incorporate natural variation – so uncertainty should(would) be larger.
Here…
https://www.carbonbrief.org/analysis-how-well-have-climate-models-projected-global-warming
“The IPCC’s First Assessment Report (FAR) in 1990 featured relatively simple energy balance/upwelling diffusion ocean models to estimate changes in global air temperatures. Their featured business-as-usual (BAU) scenario assumed rapid growth of atmospheric CO2, reaching 418ppm CO2 in 2016, compared to 404ppm in observations. The FAR also assumed continued growth of atmospheric halocarbon concentrations much faster than has actually occurred.”
” … FAR overestimated the rate of warming between 1970 and 2016 by around 17% in their BAU scenario, showing 1C warming over that period vs 0.85C observed. This is mostly due to the projection of much higher atmospheric CO2 concentrations than has actually occurred.”
And here…http://sci-hub.bz/10.1038/nclimate1763
“”The range of the 1990 prediction represents uncertainty in the
sensitivity of the climate to CO2 increases, and not the noise
from year-to-year variability in the realized weather. As natural
variability was not a part of the 1990 prediction…”
“The observed trend lies just on the borderline outside the range
stated by the 1990 scientists. However, adding noise from natural
year-to-year variability through any method widens that prediction
enough to comfortably include the observed trend. The degree of
consistency between the prediction and observations thus depends
strongly on whether or how one incorporates natural variability into
the prediction. ”
“Of course, these predictions were based on idealized future
scenarios that did not foresee the eruption of Mount Pinatubo,
the collapse of the Soviet Bloc industry or the growth of some
Asian economies”
Toneb,
Every prediction comes with its own set of conditions. The second coming of Jesus is contingent with Him not getting stuck in a traffic jam. It is obvious that the conditions not being met means the failure of the prediction. Obviously the warming predictions of 1990 did not let room for the Pause. But the reasons the predictions fail are irrelevant for the general public. A certain warming was predicted and people believed it was going to happen. Most haven’t learned to distrust this type of predictions. Yesterday I watched on TV we were going to get 10-20 meters of sea level rise by 2100 if we didn’t change our ways (WMO GHG bulletin release), because it is what happened last time these CO2 levels happened. They didn’t talk about other conditions.
https://public.wmo.int/en/media/press-release/greenhouse-gas-concentrations-surge-new-record
Like a new CO2 record was newsworthy. What next? A new population record?
@Toneb
” Their featured business-as-usual (BAU) scenario assumed rapid growth of atmospheric CO2, reaching 418ppm CO2 in 2016, compared to 404ppm in observations. ”
Trouble is, their BAU both UNDER estimated human emissions ( https://wattsupwiththat.com/2017/10/30/some-failed-climate-predictions/#comment-2650325), while OVER estimating the result, meaning they utterly failed on their estimation of carbon sinks which IS part — an important part — of their job (as opposed to estimating human emissions, for which i won’t blame them).
So this is not an excuse for them, this is just another fail, you added yourself to Javier’s list
Javier,
I disagree with an aspect from the first point, specifically where you state that CO2 emissions have been “Business as Usual”. Per the FAR (1990), BAU human CO2 emissions were estimated at 1.5% growth rate per year. Instead, human CO2 emissions since 1990 have grown at 2.0% per year. That’s an increase of 1/3 over BAU. So the “warming” of the global mean surface temperature of the earth should have been proportionately greater than the 0.3 deg C (with 0.2 deg. C and 0.5 deg. C as upper and lower bounds) predicted for the smoothed running average.
(Note that the FAR predicted higher CFC emissions in the coming decades than actually occurred, largely due to the Montreal Protocol being passed, so this could actually have some “cooling” credit).
Perhaps these two cancel each other out, but I wouldn’t be so sure. So much of the purported effects of CFC’s (whether as Ozone killers or as GHGs) is actually conjecture when applied to a real atmosphere, with a host of additional variables to deal with. Climate prediction is hard.
Kurt,
It’s also hard to know how much CFC’s come from space dust versus an anthropogenic source.
Furthermore, the decline in solar EUV radiation directly impacts ozone creation.
I confidently predict that there will be even more climate predictions in the future, and that nearly all of them will fail in time…
“AGW/Climate Change” the useless, unwanted, and unneeded ‘gift’ that keeps on giving more stupid predictions.
http://www.letmegooglethat.com/?q=restoring+the+quality+of+our+environment+1965&l=1
This article should qualify for the list. A Presidential Report commissioned by LBJ that we know was discussed at the highest levels in the Nixon administration.
10 feet of sea level rise by Y2K.
Complete meltdown of Antarctica and Greenland within 400 years, causing 400 feet of sea level rise. They explain that this would be accomplished by sea levels rising 10 feet every 10 years, although if it took 1,000 years to occur the rate would -only- by 4 feet every 10 years.
So, 10 feet by y2k, and another 4 feet per 10 years since y2k = 10 + 4*1.7 = 16.8 feet of predicted sea level rise between 1965 and 2017. I think we can safely call that a failed prediction.
The willful, reckless and negligent pursuit of a failed scientific hypothesis by those in public office, to the financial and social detriment of people at large, is actionable.
It is both a common law offence (misconduct in public office), and also gives rise to a tort (malfeasance in public office).
In English law, the elements of crime to establish are broadly: The accused must be a public officer acting as such; he must wilfully have neglected to perform his duty and/or wilfully misconducted himself; the degree of such neglect/misconduct (whether by act or omission) must be sufficient to amount to an abuse of the public’s trust in the office holder; and, there must be no reasonable excuse or justification for such neglect.
The elements to prove in the English law tort of malfeasance in public office (which if established gives rise to claims in damages for losses suffered as a result of the malfeasance) are broadly that at the material times: defendant must have been a public officer; he must have been exercising his powers as a public officer when acting (or failing to act) in such a way as to cause the loss complained of; and, his act (or omission) was such that it exercised either targeted malice and/or was ultra vires the powers of the public office held.
What Javier has done should be repeated in a far more detailed forensic way. Then sufficient public momentum should be generated (every taxpayer is affected by this CAGW scam), funding raised, and those in public office across government, local government, universities etc well and truly “got after”, both criminally and civilly.
To misquote von Clausewitz, leniency in warfare is madness – and make no mistake, ordinary people have been under deliberate and sustained attack by the CAGW brigade for a long time. It is a scam; it has no scientific basis, and it is time those in public office who are pushing CAGW pay the price for doing so.