By Javier
A year ago I wrote an article at WUWT analyzing the recent upward trend in summer Arctic sea ice extent. Despite challenges of statistical irrelevancy, the trend has continued another year. Arctic ice experts, that have repeatedly predicted the demise of summer ice, don’t have an explanation for a 10-year trend that contradicts their predictions, beyond statistical variability or unexplained natural variability. They believe the upward trend will end any year, and there were high expectations that 2017 was going to be that year, due to the low maximum in March. As we will see a low maximum has no predictive value.
However, the upward trend was predicted by Divine & Dick in 2006, based on the analysis of Nordic sea melt-season ice changes for the period from 1750-2002, where they identified two periodicities of ~60-80 years and ~20-30 years.
“… our results suggest that the Arctic ice pack is now at the periodical apogee of the low-frequency variability. This could explain the strong negative trend in ice extent during the last decades as a possible superposition of natural low frequency variability and greenhouse gas induced warming of the last decades. However, a similar shrinkage of ice cover was observed in the 1920s– 1930s, during the previous warm phase of the LFO [Low Frequency Oscillation], when any anthropogenic influence is believed to have still been negligible. We suppose therefore that during the decades to come, as the negative phase of the thermohaline circulation evolves, the retreat of ice cover may change to an expansion.”
So, when nearly every expert was predicting the collapse of Arctic summer ice, these two Norway-based researchers correctly predicted the trend observed for the past 10 years.
In science your hypothesis can only be correct if it not only explains, but also predicts the behavior of the studied phenomena. Therefore, the hypothesis of Divine & Dick is superior to the more popular hypothesis that assigns sea-ice behavior to the anthropogenic effect. For this year’s article I have decided to examine the hypothesis of Divine & Dick to analyze the importance of natural variability on summer Arctic sea ice evolution.
I am using NSIDC monthly Arctic sea ice data for March and September available here. The data are plotted in figure 1.

Figure 1. Arctic sea ice extent
Then I define the melt value for the year X as the September X value minus the previous March X value, resulting in a negative number. The refreeze value for the same year X is the March (X+1) value minus the previous September X value, resulting in a positive number.
Plotting the Melt and Refreeze curves on the same graph produces the amazing result shown in figure 2.

Figure 2. Arctic sea ice melt-refreeze cycle.
Both curves are very close. So close that the winter growth in Arctic sea ice is >80% predictable based only on the ice extent lost in the previous melt season. In fact, I can predict that the Arctic will gain between 9.3 and 9.7 million square kilometers from this past September to March 2018.
I’m not sure how surprised you are by this result. I don’t doubt this must be known by plenty of ice researchers, but I haven’t seen it reported anywhere despite reading a great deal about Arctic Sea Ice. This result leads up to some very important conclusions:
-
Arctic sea ice dynamics are driven by unpredictable melting. Freezing is reactive and largely predictable.
-
This indicates a very strong negative feedback in action. A small melting is followed by a small refreezing, and a huge melting by a huge refreezing. Surprisingly this is not known by many ice experts that expressed surprise after the huge refreezing that followed the huge 2012 melting.
-
The negative feedback stabilizes sea ice. Alarmism and spirals of death are unjustified.
-
The much-touted albedo effect can only have a small effect in the Arctic, as the lost ice is recovered during the following “dark” season, during which albedo has no role. An example that evidence always trumps logic.
-
Inter-annual changes in sea ice are due to the small residuals indicated in the figure by the colored areas. Red for decrease and blue for increase.
- Around 1998 Arctic sea ice changed its dynamics and entered a period of higher volatility. One possibility is that below a certain size the Arctic sea ice sheet becomes more unstable and sensitive to weather phenomena.
To continue, we must concentrate on the annual difference between melt and refreeze. I define the anomaly for a year as the summation of the melt that occurs on that year and the refreeze that starts on that year and ends in the next year. This produces another amazing chart.

Figure 3. Arctic sea ice extent anomaly
The anomaly graph is very homogeneous for the 38-year period analyzed, despite huge changes in Arctic sea ice. So, there are more interesting conclusions to be extracted from the data:
-
The yearly anomaly appears to be range bound. No positive or negative changes bigger than 600,000 square kilometers are observed.
-
Despite periods when the anomalies are skewed towards one side, overall the observed linear trend is flat at –53,000 square kilometers/year. This means no acceleration of the Arctic sea ice loss is observed for the 38-year period, during which atmospheric CO2 levels have increased enormously to values not observed in over a million years.
- This result supports the hypothesis that cyclical changes in ice cover, over time, average out. As opposed to the hypothesis that ice cover loss is accelerating due to an increasing anthropogenic effect.
Since the loss of ice during the melt season is the driving factor in the Arctic sea ice dynamics, I have constructed a very simple model to explore the relationship between natural and anthropogenic factors in Arctic changes. The model rests on unproven assumptions and is not intended to represent or predict Arctic sea ice changes. It is simply a learning tool that uses several of the proposed mechanisms acting on ice. The main assumption is that to be observable above the high noise of September ice data, the four main factors, thought to participate in the process, must be between 15 and 33% responsible for the observed changes.

Figure 4. Components of the Arctic sea ice melt model
The first component (A) is a 21.33-year sinusoidal oscillator that is set to explain 25% of the observed variability.
y = (-0.25) sin 0.2944 (x)
The lows of the cycle are identified at 1990 and 2012 based on local minimum ice values.
The second component (B) is a 65-year sinusoidal oscillator that is set to explain 33% of the observed variability.
y = (-0.35) sin 0.096664 (x+24) – 0.306
The low of the cycle is placed at 2007, when the current upward trend started, and when North Atlantic sea-surface temperatures started to decrease.
The third component (C) is the anthropogenic factor based on atmospheric CO2 changes. It is set to explain 24% of the observed variability.
y = 0.5 – 3.2 Ln ([CO2]/290)
The fourth component (D) represents the long term natural variability, since the end of the LIA. It is essentially the ~ 1000-year cycle. Since it is very long term, it can be adequately represented for a short period with a line that is set to represent 17% of the observed variability.
y = (-0.34/32) x + 21.04
The model is initiated at 1980 at a melt of –8.1 million square kilometers
Such a simple model is not expected to adequately represent a complex phenomenon that likely responds to many more factors, but it reproduces the general shape and behavior of Arctic sea ice melt, and compares well with a polynomial fit to the data.

Figure 5. Arctic sea ice extent melt.
By comparing figure 5 and figure 1 we can see that the melt graph is extraordinarily similar to the September extent graph. As we have seen, Arctic sea ice dynamics are driven by the melting. The model therefore can be set to reproduce and project September Arctic sea ice data into the future. For that I have used RCP 4.5 scenario that contemplates a stabilization of CO2 levels at around 540 ppm soon after 2100.

Figure 6. September Arctic sea ice extent.
While I don’t expect future Arctic sea ice data to follow the model, I do expect it to perform better than the models that are based mainly on anthropogenic factors. As I said the goal of the model is to examine the possible effect of the different natural and anthropogenic factors on sea ice dynamics. It can be seen as a graphical representation of Divine & Dick hypothesis with fictitious but reasonable values.
I do believe we are entering a period of Arctic sea ice stabilization, and even expansion, that should last until around 2042, and this is a prediction in stark contrast with IPCC’s ice models that see an end to summer Arctic sea ice by 2040-2080 for most scenarios and near constant decline until then.
High sea ice variability could produce some ice-free summers around 2075, but the conditions for the existence of summer Arctic sea ice are likely to remain for the foreseeable future. By 2100, atmospheric CO2 levels are expected to stabilize in the more credible RCP 4.5 scenario, and the millennial cycle is expected to change phase, so there won’t be a net negative ice driver. From then on, Arctic sea ice should start growing for many centuries to come.
How reliable are sea ice measurements from before 1980? As that was probably near a recent peak in what is a cyclic phenomenon in the post 1980 record, do the relationships apply in the earlier records?
They are quite reliable for a few areas and not reliable at all for most. It is better not to use the whole Arctic data reconstructed by some authors, as it is different from the reconstructions by other authors.
Not surprised at all published this four years ago. I also pointed this out to you on a previous thread.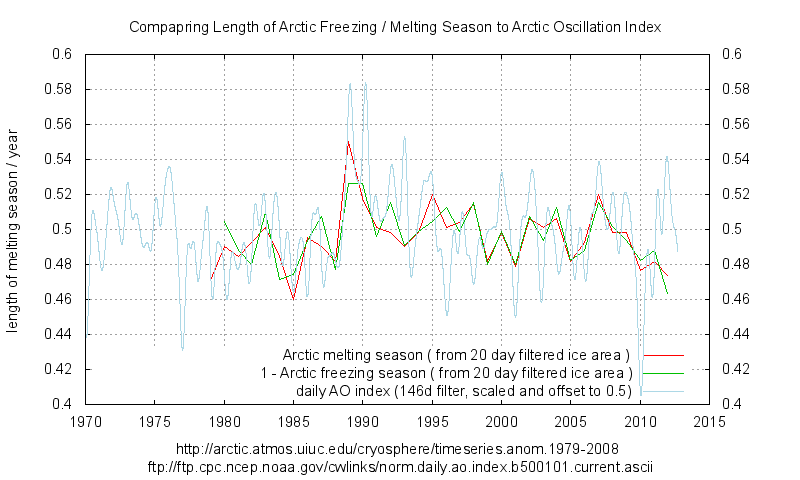
https://climategrog.wordpress.com/arctic_freeze_melting_daily_ao/
In August you thought it was “obvious” , now you are “surprised”.
Alan Watt, Climate Denialist Level 7
August 11, 2017 at 6:59 am
Interesting. Is there also a shift in the freezing season?
Javier
August 11, 2017 at 7:06 am
Obviously. It goes from the same dates, just the other half of the year.
Greg
August 11, 2017 at 12:05 pm
Not so obvious, since they only share one date. They can not be totally different but looking at freezing period gives another outlook on the dataset which has very few points and large variability.
https://wattsupwiththat.com/2017/08/11/arctic-melt-season-changes-and-the-arctic-regime-shift/#comment-2578458
But thanks for confirming my results, even if you used a less rigorous method, simply using monthly averages rather than daily data.
Weren’t satellites taking pictures of the Arctic in the 60s from space? I think I read that here.
Yes, but not with the right instruments and the right frequency to reconstruct arctic sea ice as since 1979.
javier, regarding the current arctic situation ,what if anything could be expected from the stage of the amo we are in at the moment . when the ice extent began decreasing to the low of 2007 the regime was warming ocean water with cooler but warming air temperatures . now we have warm air temperatures with a cooling atlantic as the amo heads toward the cooler part of the cycle.
i would imagine this will have an effect in terms of water capacity of the atmosphere in certain areas leading to impacts on snow and rain fall. i note on the east coast of scotland fog was something rarely seen for many years, the last 3 years have seen an increase in foggy days, on my part of the coast anyway.
thanks for post, you are always an enjoyable clear and thought provoking read.if my above query makes no sense just ignore it .
There is also the difference between how wet and dry snow accumulates volume and effects how stable it is to melting.
Bit chilly,

It’s just difficult for me to answer because of my limited knowledge of the issues involved.
The relation between AMO and September Arctic sea ice is clear, except when below 5 million square kilometers.
AMO appears to have reached peak and is starting to decrease. The decrease in AMO means that winter NAO is likely to be more often negative. NAO is the difference in pressure between Iceland and the Azores. When winter NAO is negative westerlies are weaker, weather systems over Western Europe are weaker, and conditions are colder.
The weaker westerlies mean less contribution from the subpolar gyre to the North Atlantic current, that becomes warmer and releases more humidity over Western Europe all the way to Norway. The colder conditions means more fog and more snow.
A solar minimum makes the whole situation stronger, like in 2010, when NAO was very negative and there was a huge snow storm over Western Europe.
But as everything that involves weather we are talking about increasing probabilities, not determinism.
Graph 2… instability = WEATHER !!! 🙂
“So close that the winter growth in Arctic sea ice is >80% predictable based only on the ice extent lost in the previous melt season. ”
I’m confused as to why this would be surprising…..probably from lack of coffee right now
..if open water allows more heat to escape
That is the most probable explanation. But it is not what we have been told repeatedly. Albedo was supposed to be driving sea ice collapse. Low ice leading to lower ice, not recovery as is observed.
I would have thought this was utterly obvious. There’s an area that freezes in the winter. All things being equal it will freeze. If it is already frozen, it can’t double freeze.Thus the only areas that CAN freeze are those that have melted.
As you say, utterly obvious. But climate scientists appear to be professionally charged with finding ways around the utterly obvious.
There is one more thing Javier is missing
This has been discussed before on Blogs.
he just doesnt read outside his bubble
Mosh,
Care to enlighten us as to what the missing ingredient you imagine might be?
Yet another meaningless distraction from the Mosh.
@Mosher, instead of trying to be mysteriously wise with “There is one more thing Javier is missing” why don’t you put that ‘one more thing’ forward ? Put up or shut up.
The one big thing I see is that one big storm at any time during a cycle can massively skew any forecasts or projections of the sea ice in any metric, be it extent, volume, or age. This is why I think it is ludicrous to try and use Arctic sea ice as a proxy for climate except in multi decadal time frames.
RAH,
Thirty-year averages are however meaningful.
The thirty years 2013-2042 are liable to average higher than the interval 1983-2012.
Willy Pete, you have got to be kidding, or unable to read any of the information presented to you in the post above.
We’re off to a good start, with the five years 2013-2017 showing a higher average minimum than 2008-2012.
Steven says obvious irrelevant trivia: that I don’t read blogs where this has been discussed previously. He forgets that I say in the article that I am sure plenty of people know about this. The comments leave very clear that some people known, but plenty don’t. So the article fulfills its double goal of informing and fostering discussion. It is actually very good news that so many people already know about it. The level of awareness about climate is rising and it will be more difficult to deceive people.
I already knew that Arctic sea ice acts as an insulator. I have read several articles on that. I knew that more heat is lost when the ice cover decreases. What I didn’t know was that the data fitted so well as to essentially reduce albedo role to a small factor. If science was so clear, why have some scientists claimed that albedo was an important factor driving Arctic sea ice collapse?
The Arctic is an important battleground between skeptics and believers. Polar amplification has been reduced to Arctic amplification, and if that is lost, if Arctic sea ice grows consistently for decades, that battle will be lost by believers. Not by science because science always wins.
Arctic sea ice has been growing for 10 years, yet you won’t read a single newspaper headline about it. One would think that in a planet obsessed with climate change that would be newsworthy.
Javier
“Arctic sea ice has been growing for 10 years, yet you won’t read a single newspaper headline about it”
It’s far worse than that. What one finds are many headlines stating or implying the exact opposite. One of many such postings from Tony Heller’s blog:
No details. No facts. Zero direct observations.
All Mosher has to use is all emoting and hand flailing.
i.e. When Mosher starts with ad hominems, his arguments are toast.
Anymore I mentally tack onto the end of any Mosher post the phrase ‘You won’t believe what happens next’.
It really helps me put them into proper prospective.
~¿~
Kind of like reading a fortune cookie and adding “…in bed” at the end.
I know this is hard to believe but most people think that the Arctic ocean is freezing cold, not the main source of the warming and melting of ice. Warm(ish) water entering the basin cools off – no big surprise there. So, how? By escaping through the ice which is cooled on top and warmed from below, or, directly by infrared radiation and evaporation. Water radiates strongly in the IR, even more than ice which is a strong emitter.
Also, naturally, people tend to automatically think that the whiteness of ice is responsible for it being ‘reflective’. Of visible light, yes. Of IR, no. It is nearly as black as water at IR wavelengths.
So what we have is a seriously flawed model of how the Arctic loses energy and ice by melting (or not) proposed by people who really ought to know better. This message is spread to a public that thinks ‘visually’ not the way a thermodynamicist does.
Steven Mosher October 5, 2017 at 8:42 am
One of the many things that you are missing is an elementary science education.
Thank you. My laugh of the day. this one I will remember!
“he just doesnt read outside his bubble”
Mosh lives inside a bubble gum bubble. !
WAKE UP, mosh .. get away from BEST,
they are POLLUTING your mind and your relevance.
probably WAY too late.!!
Also, I don’t think there is enough evidence for the assumed attribution of year to year changes in seasonal extreme sea ice extent to global warming
https://papers.ssrn.com/sol3/papers.cfm?abstract_id=2869646
“They believe the upward trend will end any year, and there were high expectations that 2017 was going to be that year, due to the low maximum in March. As we will see a low maximum has no predictive value”
I think low volume and ice thickness already has prediction quality. Only the question is, was the Arctic sea ice really thin and without volume or did the various US American ice thickness institutes just juggle? We should not forget that in December 2015, the Paris Climate Conference was held, no one, really no one expected Trumps victory in November 2016, and a Hilary would have needed only a hand-proof for the dramatic global warming to make with the Republican-dominated house the Paris climate deal under a Pres. Hilary. I maintain that these ice thickness measurements 2016/2017 were pure climate alarming for the purpose described above, not covered by Cryosat2. On the contrary, Cryosat2 shows in its measurements that the volume was by no means down. And second, Cryosat2 showed a better distribution of the ice thickness compared to the previous years in the Arctic basin. Although the ice thickness was not as high as in previous years short above the Canadian archipelago, it was increased in the rest of the Arctic basin (despite the supposedly warm winter). For comparison:
Spring 2017:
http://www.cpom.ucl.ac.uk/csopr/sidata/thk_28.png
Spring 2012:
http://www.cpom.ucl.ac.uk/csopr/sidata/thk_2012_Spring.png
Spring 2011:
http://www.cpom.ucl.ac.uk/csopr/sidata/thk_2011_Spring.png
2013 an 2014 the spring thickness was also arctic wide lower, but the weather was in the summer favorabler for the ice.
Source: http://www.cpom.ucl.ac.uk/csopr/seaice.html
The Arctic sea ice thus depends less on the air temperatures in the winter than thought, but more on atmospheric pressure conditions and sea currents. Finally, a thick ice cover acts as an isolator, so that from a certain ice thickness (I estimate it to 1.30 meters first year ice) no change in thickness due to low or high air temperatures can occur, but this is then done by other patterns.
Back when congress was debating the great ozone scare, NASA produced a report that showed, for the first time in history, an ozone hole over the arctic.
In no small part, because of this paper, congress, which had been wavering, went ahead and voted for the Montreal Protocols.
The next year NASA announced that there had been a “mistake” in interpreting the data, and there never was an Arctic ozone hole.
A very convenient “mistake”. NASA unfortunately is getting better at creating this kind of “mistake” whenever their political masters need scientific cover.
An end to summer Arctic sea ice by 2040-2080?
http://news.nationalgeographic.com/news/2006/12/061212-arctic-ice.html
I had thought it was earlier predicted by experts as an ice-free Arctic by 2015 or 2020.
Or was it 2015-16? …
https://www.theguardian.com/environment/2012/sep/17/arctic-collapse-sea-ice
Why is this “settled science” constantly moving its goalposts? Most unsettling.
The arctic sea ice, although covering only a small part of the earth’s surface, is best suited to demonstrate global warming. And it is not far from global warming to human-made global warming. So we will see many such “predictions”. And if they were not to stand out, they did not harm the agenda of the Scarmongerians. Because it is so beautiful: What care my words of yesterday.
“Scaremongerians!” Nice. Sounds like something from Swift.
You can find predictions that the arctic would be ice-free for more or less every year during the last decade.
This may be the most revealing post on Arctic sea ice I have ever seen here at WUWT!
Especially the Figures 2 and 3 deserve widespread attention.
I have one question for dr Javier: could he expand a little on the millennial cycle that he refers to?
Hi Wilt,
The millennial cycle I refer to is a ~1000 year quasi-cycle in solar activity that is corresponded by the same periodicity in climate variability. It was detected in solar cosmogenic isotope proxies. It is very clear during the first 6000 years of the Holocene, when it corresponds to every peak in the Bond series of increased iceberg activity in the North Atlantic, and to other long proxy records of temperature and precipitation.
After about 5000 years BP the cycle became inconspicuous, both in climate and solar proxies, but it has increased again since ~ 2000 years ago, maintaining the same phase, with its highs marking the Roman, Medieval, and Current Warm periods, and its lows marking the Dark Ages Cold Period and the Little Ice Age. The new apex in this cycle should be around 2100 AD.
Thanks for the clear and concise answer.
I wish I would be around in 2100 to see if it comes true …..
Great answer… the Bond series is just so fascinating.
Where can I place bets on Arctic sea ice extent. Have to get in now while the odds are favourable.
i am sure a few people on the arctic sea ice forum will take your bet.many of them are convinced it will be gone any day now. jim hunt was the only person i could find to take my bet a few years ago. the bet is out to 2022 though the group providing the metric appear to have stopped reporting . even though i gave him all the advantages by using sea ice area, not extent, it doesn’t look good for him at the moment. time yet though.
And the amount of multi-year ice doesn’t seem to be decreasing either:
http://www.aari.ru/resources/d0015/arctic/gif.ru/2017/20171003.gif
http://www.aari.ru/resources/d0015/arctic/gif.ru/2016/20161004.gif
Arctic temperature variability is a clear example of a plain and simple natural variability but an explicit explanation is not readily available.
http://www.vukcevic.talktalk.net/CO2-Arc.gif
https://wattsupwiththat.com/2017/10/05/arctic-ice-natural-variability/comment-page-1/#comment-2628474
Another Vukcevic correlation from way out in the wild blue yonder!
Three comments:
1. Your graph ends in 2000. Why?
2. Are you ever going to start theorizing about possible mechanisms that might underlie your correlations between climate things and geophysical or geological things?
3. Arctic geomagnetic field. The geomagnetic field varies in space as well as time. The field that you plot (with quite high precision) is at what location(s)? Could the changes you plot (if they come from a single location or a localized group) be related to the moving magnetic pole? Which seems to be accelerating.
Need more info, but as ever, thank you Vuk, for thought-provoking observations.
Arctic temperature variability is due to sea ice extent. The ice extent is determined by the water temperature.
Low ice extent means marine climate in the Arctic, high heat loss and cooling ocean temperatures. After several years of this the water cools to a point where the ice extent begins to increase again.
When the ice reaches maximum extent the water temperatures start to rise as the ice insulates the water from heat loss.
The accumulation of heat in the Arctic and its eventual dumping during low ice conditions is the cause of the ~60 year cycle we see in climate conditions.
The open Arctic water and associated heat dumping are the main factor affecting global temperature
This phase is over! It will become colder and drier for the next 20 or 30 years as the ice grows
That’s exactly what I have been saying after analyzing my own results. It will be cooler and drier at the higher latitudes and you will get more clouds and rain / bad weather at the lower latitudes. The latter is already happening, for quite some time. The colder and drier at the higher latitudes is what I am waiting for. Anyone, any reports on this?
Good grief, a diagram purporting to describe the Arctic variability with sine (or cosine) and a bunch of other curves, when everyone knows that only one curve describes the Arctic’s variability and that is a death spiral.
Its only a death spiral …. until it ceases to be a death spiral and reverses and turns into a glaciation spiral.
What are you going to say then??
Oh my, I’ll say — “Oh NO!”
We need the planet warmer! Just like the Roman optimum when life and getting food was easier. And nobody died because of rising sea levels — clever buggers those Romans…
However I get your point, solar low point approaches (Paris Accord date 2020 — coincidence?).
As I’ve survived the 1950s, 60s, and 70s, I know how fast the climate can change, and I know that the kids today do not understand what cold is! It can so easily get worse than that — back to 1800s? I hope not.
Till then we have the heartfelt humanity of John P. Holdren to keep us warm —
P.S. I lost the /sarc-Off from the original comment.
[The mods noticed that lost /sarc, but elected not to insert it. .mod]
It’s obviously a sinusoidal death spiral.
That it is now really a death spiral
I wonder who the “everyone” you say knows the Arctic is in a death spiral actually is?
Perhaps fashion designers, Hollywood actors and other experts? Or former tobacco baron Al Gore whose various predictions are giving science fiction a bad name?
I think I’ll form my own opinion based on some of the factual evidence on this site coupled with the failure of all the death spiral claims by your “everyone” and their deaf (to reason) spiral.
Your list of the most respected and honored members of civil intelligentsia “hits the nail straight between the eyes!” (as Ben Jabituya says in Short Circuit). 🙂
If you start with Al Gore, Jr. being the son of a U.S. Senator, Al Gore, Sr., then you might not weaken your statement with Jr. being a “tobacco baron.” Had either been tobacco barons, politics would not have been a way of life for them.
Of much more value to the Gores than tobacco was the relationship between Armand Hammer, of Occidental Petroleum, and the $20,000 per year payments for (useless ?) mineral rights.
Link
If you also think Al Gore owns a mansion on a beach, you will find that science fiction, too.
[ BTY, I think Jr. is a bore, a moron, and should be charged with crimes against humanity. ]
Death Spiral? Is that a rock band?
Yes. They are Grateful Dead wannabes.
Yes it’s a flat metal strip formed into a spiral and holds large stones together.
Dr. Javier …. great article. Time will tell how accurate you are with regards to % attribution. However, what about adding in the 5th impact, which is a linear increase since the halocene optimum?
Based on historical sea level rises and falls, and other long term data, I think we are just seeing wiggles in the data on its way to a complete glaciation. History tells us that we will gradually fall back into a glaciation, and no amount of CO2 is going to stop that from happening. I personally don’t think that the melt will reach as low as your model predicts, unless you have data showing such levels have been reached before within the interglacial/glacial time spans of previous glacial cycles. According to the study discussed here at wuwt … https://wattsupwiththat.com/2014/03/24/new-study-shows-arctic-sea-ice-extent-6000-years-ago-was-much-less-than-today/ … arctic ice was less during the optimum, as would be expected. Today, ice is greater than 6000 years ago, and I’ve seen no evidence that says we are heading back to Climate Optimum conditions.
Like I said, … just wiggles. I would not be surprised to see that your “floor” of 2 million is too low …. But then … I probably won’t be around to see if your model is correct in 2080 either. 🙂
Yes, I will ask my grandkids to set an alarm for 2080 to check this prediction – by then hopefully someone will have invented a way to get the message back to me, wherever my being is located. In the meantime (I mean my remaining time), it looks like ice growth and vindication will be my pleasure to observe.
IMO 2012 shows us what the floor is for the Current Warm Period, ie ~3.3 million sq km. No doubt it was lower during the Holocene Climate Optimum, and the Minoan, Roman and Medieval Warm Periods. But earth has been in a long-term cooling trend since the Minoan, if not before.
Yes, the warming periods tend to be lower and colder. Only Sticky Mann makes it hotter.
Dr. Deanster, you might be right. It all depends on how much sea ice is capable to grow over the next 25 years to see how well it will resist the next warming period. Given that from 1980 to 2012 September sea ice lost 4 million square kilometers the possibility remains. Also the negative feedback could become stronger the less ice is left, preventing the floor to fall below a minimum.
I agree also with the glaciation part. Climatic history repeats itself. That much is clear. We are lucky we are around for the warm part.
Javier, we wouldn’t be around if it weren’t for the “warm part.”
Anyone have a view as to how this might have played a role:
NASA Sees Arctic Ocean Circulation Do an About-Face – Nov. 2007
http://www.jpl.nasa.gov/news/news.php?release=2007-131
Begins on this note:
PASADENA, Calif. – A team of NASA and university scientists has detected an ongoing reversal in Arctic Ocean circulation triggered by atmospheric circulation changes that vary on decade-long time scales. The results suggest not all the large changes seen in Arctic climate in recent years are a result of long-term trends associated with global warming. [..]
Very interesting. I will have to digest this and see how it affects my ideas about ice variability.
Any effect of CO2 on Arctic sea ice is still negligible. It was negligible at 322 ppm and is still negligible at 402 ppm.
This year was vital, since without a new record low, it would have meant the first time since 1979 in which a lower low didn’t occur within five years. Now the barn door is open. There is unlikely to be a new low for decades, without freak weather events such as those which caused the 2012 record low.
Arctic ice should continue on an uptrend for around 25 to 30 more years, extending its current five years of growth, which happened despite a Super El Nino. Sea ice extent might have peaked in 1977, the year of the PDO flip, rather than 1979, when dedicated satellite observations began, for a 35 year decline cycle. The increase cycle ought to last about as long.
Except a blast of solar winds (from a coronal hole), like that which happened intermittently between November to January last winter, would decrease Arctic ice while freezing the brass knockers off any intelligent beings trying to live just south of the Polar region.
We are in a relatively unknown era of what the effects of this solar minimum might do in the next decade or so. Was there a coronal hole persisting during the LIA? We just don’t know. What causes a coronal hole?
I don’t know, but paleoclimatic data show the cyclicity of Arctic sea ice in the Holocene and prior interglacials, from whatever causes.
My surmising is about what triggers a rapid cool down further south from the pole (like the LIA).
Yes the coincidence of ocean cycles occurring during a solar minimum, but a few persistent blasts of solar winds would start a more rapid and colder movement of the freezing weather southward.
Maybe then the cooling ocean cycles would just maintain the established cold regime (and later ensure a larger and thicker polar icecap) until the oceans cycles change over to a warmer period. And by then the combination low solar output and the vast area of ice and snow (high albedo) covering the land, conspire to ensure the exit from the cold period is slow.
Tom,
Increased solar wind might well have an effect, in concert with generally lower solar activity during minima such as the Spörer, Maunder and Dalton of the LIA.
So if I read this correctly, he is predicting roughly 15 million square kilometers of sea ice at peak in March. This feels like science – a theory, a prediction, and a chance to test it. So far, the “powers that be” have failed spectacularly, so it looks like we have a contest between this theory, and whatever models of sea ice the AGW crowd have.
This is likely to require many bags of popcorn…
Javier… Great work… As always!
Thank you, David. A modest contribution to the dispel of myths.
Javier,
Clearly, arctic ice extent is driven by the solar cycles
which we [at least you and me] have mostly identified.
The question that still remains with me: what is driving the SC’s, exactly?
At maximum ice extent (circa 1970-ish) The ice insulates the ocean from heat loss and protects it from the wind (which in the Arctic is a powerful agent). In this phase Northern air temperatures are low, albedo is high and the ice is fairly self protecting and sustaining.
While this condition persists, however, the ocean temperature creeps higher year after year due to the insulating effect of the extensive ice. The total rise in ocean temperature is probably only a few tenths of a degree but it accumulates.
Eventually, the higher ocean temps thin the ice and it becomes unstable.
The winds take over and begin to destroy the ice. The reason for this is that the ice perpetuates itself by limiting the interaction between wind and waves. So once this destructive phase starts it accelerates toward the minimum conditions we have seen up to 2012.
The lower ice extents cause higher air temperatures as the Arctic becomes much more of a marine climate. This causes higher global temperatures just by this regional effect. This is a a high heat loss condition. The Arctic dumps its accumulated heat. We are past the peak of that as the hiatus shows-the Arctic ocean is cooled and the ice is beginning to grow again. We are headed for 20-30 years of colder temps.
Where does the Arctic ocean gets its heat from?
I think probably the Pacific mostly but that would be a job for a little research. It won’t be found through computer models. I believe this is the cyclic mechanism that explains the ice variability AND the recent warming phase AND why the warming phase has stopped.
It also means that any effect from CO2 is completely overwhelmed by natural heat loss mechanisms inherent in the climate system which should be readily apparent to anyone with even a minimal knowledge of physics.
This entire climate fiasco is an embarrassment to science. Hundreds of scientists spending millions of dollars and not even looking in the right places.
Dendro-chronology for Christs’s sake!
Interesting hypothesis, John. It might contribute to the maintenance and reinforcement of the ~20 and ~65 year oscillations. But the oscillations manifest also in temperatures, sea level, wind, and the speed of rotation of the Earth. Its cause is likely to be outside the Arctic, but as it appears that the energy for the oscillation is mainly provided by internal variability, the ice seesaw you describe could very well contribute to it.
Thank you Javier. I have great respect for your contributions on this site as i find them logical, coherent and well stated and supported. My hypothesis is only that, but I do believe it stands up logically. It depends I think on infiltration of slightly warmer water into the Arctic during the phase when ice is around its maximum. As this mixes with the existing ocean water it raises temperatures by a few tenths of a degree over 20-30 years until the destruction of the ice begins.
If you look at the Arctic temperature plot on the sidebar it clearly shows that temperatures are radically different ( and higher) now than the long term average. I realize this is only some sort of averaged temperature but it says to me that we are seeing marine temperatures now as opposed to frozen sea surface (high ice extent) temps in the past.
My hypothesis is the only explanation I can think of for this. The sea temp must determine whether the sea freezes or thaws. The air temperature is the result.
The insulating effect of the ice and its reduction of wind induced wave action is the delay mechanism that creates the extended cycle.
John,
I agree that water temperature is determinant in the freezing of the sea ice. Abnormally high winter air temperatures don’t appear to affect ice extent much. The heat is essentially lost to space through radiation, and the very cold, dry, winter polar air doesn’t contain much energy to start.
Javier
Air temperature increases are due to the heat dumped during low ice conditions versus lower air temperatures during the maximum ice, heat retention phase. I was not aware of any sea level periodicity but if that exists it could be explained by the air temperature cycle caused by this mechanism. Sea level reality is extremely difficult to even determine. It is a separate issue which may be related in some ways, as is the case with the other cyclic indices you mention. It certainly isn’t difficult to see a connection between Arctic ice, heat loss and wind patterns and strength.
John Harmsworth, I suppose that the arctic gets most of its heat from the Atlantic Ocean. In an article (in Dutch, see figure 13)
http://klimaatgek.nl/wordpress/2015/11/30/de-opwarming-tot-2100-een-realistische-benadering/ Jan Ruis performs a linear regression of an AMO version with arctic sea ice area. His conclusion is that the AMO explains 80 % of the arctic sea ice area variability. The frequency and the phase of the AMO agree very well with the 65 year cycle Javier applies in his analysis.
Exactly. And the AMO is most likely driven by the geography of the North Atlantic + Earth’s revolving driving the AMOC. I would also agree this is probably 80% of the variability with maybe 20% due to other factors.
Also keep in mind there is a large lag between the AMO and amount of ice in the Arctic. It takes time to melt all that ice with a difference of at most 1 C at the surface.
Goeie commentaar.
Interesting. I wish I could read it but I expect my rudimentary German wouldn’t help me enough. Regardless, I believe that cyclic heat loss in the Arctic is huge and important. This so-called science is infested with government grant whores staring at computer screens while the elephants of climate variability stomp and trumpet all over the planet unseen and unheard by those whose religion forbids questions.
the only part of that i disagree with is the source of the warmer water john. i think it comes from the atlantic.
No problem on that point. It was a guess on my part. The important thing is how this explains ice extent variation. I believe this, in turn explains most of our climatic variation on multi-decadal scales. At least in the N.H. The Arctic stores vast amounts of heat for decades and then dumps it for decades. Any heat loss delay caused by CO2 is lost in the noise of this process .
It is utterly laughable that a field of study has been built on this. I can’t wait to see how they explain global cooling in terms of global warming! CAGW is an eco-Socialist political gambit, not science at all.
this is how is see the big picture as well john .i think the best we can hope for is the longer the physical climate confounds the “experts”,some of them will start looking at the natural processes happening right now .models and re analysis data certainly seem to be leading many down the wrong path.
You would think that the evidence we already see (expanding sea ice, record Antarctic extent just two years ago and 60 years into catastrophic warming, 18 year hiatus, mass gains on multiple ice caps, no troposheric effect as the AGW hypothesis requires) would have the science self reflecting by now.
That just demonstrates that it isn’t science at all. It is an evil deception perpetuated by Socialists and radical environmentalists who seek to destroy Capitalism and rule over us.
Javier, this recent article http://www.pastglobalchanges.org/download/docs/magazine/2017-1/PAGESmagazine_2017%281%29_14-19_Notz.pdf bolsters your conclusion. It decribes the internal variability and the limited role of the ice-albedo-effect. The author writes:” …These headlines were usually related to claims that the Arctic would lose its remaining summer sea ice within just few years. The underlying reasoning of such claims was often related to a discussion of a possible ’tipping point’ that is related to the ice-albedo feedback. Given the substantial loss of Arctic sea ice in the past few years, the ocean could potentially absorb enough heat to rapidly melt the remainder of the sea ice cover.
However, our current understanding of the Arctic climate system strongly suggests that this reasoning is unrealistic. A first indication for this finding derived from model experiments in which all Arctic sea ice was synthetically removed from the Arctic Ocean at the onset of summer, thus maximising the possible ice-albedo feedback (Tietsche et al., 2011). Despite such maximised feedback, the ice cover recovered in these experiments within just a few years. This is because on annual time scales, negative feedbacks dominate the evolution of the Arctic sea ice cover. Three negative feedbacks are particularly important: First, the open ocean very effectively releases its heat to the atmosphere during winter, causing a rapid loss of much of the heat that was accumulated in the icefree water during summer. Second, the thin ice that forms during winter can grow much more rapidly than ice that survived the summer, because heat can more effectively
be transported from the ocean to the atmosphere when the ice cover is thin (Bitz and Roe, 2004). Third, as ice forms later in the season, it will carry a thinner insolating snow cover as any snow fall occurring before ice
formation simply falls into the open ocean (Notz, 2009)
The alarmistic predictions of a “cliff” in the next few years are contrary to the scientific knowledge, pure propaganda.
Sounds about right. Another unrecognized factor may be that the old, thick ice that tends to survive longer into the summer is probably ice that has been piled and folded by the wind. Many of these are pieces of former pan ice and can be piled up into min- mountains that are 30 or 40 feet high and very resistant to melting. They can make up quite a bit of the overall ice pack.
Hi Frank,
Thank you for the citation. Some of its conclusions agree with the observations discussed here. However the claim that 3 square meters of ice are lost per ton of CO2 emitted that they seriously claim look to me as science fiction.
I’ve always been a Sci-fi fan, perhaps that is why I like climate science so much. Always describing interesting things that will never come to pass.
Hi Javier, I think one should not take the AGW-metrics in the article too seriously because every scientist must make some accomondations especially when he makes such strong statements versus the propaganda. And this is what counts in the end…
The range of albedos of ice and sea water overlap. Also, it’s hard to overcome that T⁴ radiative energy dump during the winter night. There will always be ice at the Arctic in winter.
this is a point often lost on arctic alarmists. it does not matter how much energy the arctic ocean gains in the summer when ice extent is low. it loses all of it and then some come winter.incoming solar energy in the arctic is only net positive for around 10 weeks from what i can see.
From the conclusion in this paper —
Arctic Decadal and Interdecadal Variability
Igor V. Polyakov
International Arctic Research Center, University of Alaska Fairbanks
Mark A. Johnson
Institute of Marine Science, University of Alaska Fairbanks
Hi Tom0mason,
Here is a link for that article,
http://onlinelibrary.wiley.com/doi/10.1029/2000GL011909/pdf
Polyakov has been studying the Low Frequency Oscillation (60-80 years) for a long time. He has also an interesting article on how the ocean and the atmosphere cooperate during the oscillation.
Polyakov, I. V., et al. “Variability of the intermediate Atlantic water of the Arctic Ocean over the last 100 years.” Journal of Climate 17.23 (2004): 4485-4497.
http://journals.ametsoc.org/doi/full/10.1175/JCLI-3224.1
Thank-you Javier,
Yes, I’ve read both before, and a few others by Polyakov. He seems to have a reasonable view of the Arctic and it’s variability.
Javier, as you can see it’s hard to impress most commenters on this site. For me, this is an elegant analysis. I like your use of the four factors, one of which the CO2 warming. It will be interesting going forward to adjust your initial attribution among the factors. With CO2, proving to be less and less a major connection to warming (presently 3x too hot), it seems a prime factor to adjust downward if your model runs below observations on ice extent.
One factor to consider is the ice thickness dimension. When ice extent is growing, 2yr, 3yr…extent is expanding and this serves to preserve extent going forward, even if annual growth is modest. It seems, coupled with your model, some estimates of the different thicknesses might be reasonably forecast.
One other point to make is that such a finding by Divine & Dick and your work is impossible to discover if you slavishly adhere to a foregone conclusion of a consensus. No consensus ‘scientists’ would see the value in examining the data to discover something new if they won’t accept something can be new. How dull and routine is consensus science!
Excellent point in last paragraph. This is the essence of science.
Hi Gary,
As it should be. Curiosity and skepticism should be the main attributes of anybody interested in science. I welcome skepticism to what I say as much as to what others say. Let the evidence speak by itself.
And yes, good science is always open to being challenged. That consensus climate scientists are trying to shut down opposition is a very bad sign. Good science is always reinforced from being challenged and surviving.
How dull and routine is consensus science!
While there is a lot of truth in that, I doubt whether Vavilov found being starved to death in a Socialist Workers’ Paradise gulag (as a result of Lysenko’s consensus science) “dull and routine.” It was evil then and is evil today.
Excellent work, Javier!
Thank You!
Javier. Great work and thanks for Figure 2.
Yes, Javier! Very informative. It seems whenever actual science is directed at this issue the CO2 monster disappears and natural variability is found and better understood.
Hey! Where’s Griff! Somebody tell him the good news! We’re headed for miserable cold and failing crops! Icesome!
That model is rather strange. Over the plotted time interval, the “anthropo” component is almost linear, so why introduce another explicitly linear component? Also, where to the exact parameters of the sinusoid components come from? The numbers quoted from the Divine-Dick paper are a lot more vague (“~60-80 years and ~20-30 years”). I’m not sure we can “learn” anything from this model.
Javier provides the starting points for the sinusoids in the text.
He considers three local minima, and he assigns them to two distinct “cycles.” Fixing a cycle based on <=1 period of observation isn't possible. This could only be justified when a longer preceding time interval were taken into account. I assume he did that, but it should be made explicit.
Michael,
This article is only about Arctic sea ice, but the 60-80 year oscillation is well known in climatology. It was first described in an article in Nature in 1994 by Schlesinger and Ramankutty, using data since 1850.
Schlesinger, M. E., & Ramankutty, N. (1994). An oscillation in the global climate system of period 65-70 years. Nature, 367(6465), 723-726.
https://www.researchgate.net/profile/Navin_Ramankutty2/publication/243786163_An_Oscillation_in_the_global_climate_system_of_period_65-70_years/links/004635170b2213d44a000000.pdf
The timing varies depending on the system being studied as described in the “Stadium wave” hypothesis of Wyatt and Curry, 2014. In the North Atlantic the change took place in 2007:
http://www.climate4you.com/images/NODC%20NorthAtlanticOceanicHeatContent0-700mSince1979%20With37monthRunningAverage.gif
This is the same year Arctic sea ice stopped decreasing, so it is the obvious choice for the 65 year oscillation minimum.
Javier,
According to the monthly NSIDC data you linked to, Arctic sea ice did not stop decreasing in 2007. It has decreased at a rate of 0.724 million km2/dec since Jan 2007 (to Aug 2017).. That’s a total loss of around ~ 3/4 of a million km2 of sea ice in that period.
In what sense does this represent a halt in Arctic sea ice decrease?
Javier, thanks – OK with this part.
DWR54,
We are comparing September to September data. The increase since 2007 is clear.
http://peakoilbarrel.com/wp-content/uploads/2017/09/616289.png
Javier
Yes, but this is a cherry-pick.
You only want to discuss the month of minimum extent. A reminder that it was *you* who linked to the monthly data from NSIDC, and that this monthly data shows a continued strong decline since 2007, irrespective of year-on-year September values.
If all you are saying is that sea ice extent during the September hasn’t changed much over the past 10 years then I’d agree 100%. But that’s trivial.
DWR54,
It is not cherry pick. It is standard practice to follow March data for the maximum and September data for the minimum. That’s what the Danish Meteorological Institute does for example. Here is the graph they use from OSISAF (Ocean and Sea Ice Satellite Application Facility) from the European Meteorological Satellite service
http://osisaf.met.no/quicklooks/sie_graphs/nh/en/osisaf_nh_iceextent_seasonal.png
http://osisaf.met.no/p/new_ice_extent_graphs.php
If the minimum (September data) is not going down, the Arctic is not melting. That much is obvious.
Two linear components are required. One to represent anthropogenic effect and the other to represent natural long-term variability that is known to exist. After all the world has been warming for over 350 years, long before emissions became significant.
CO2 emissions still aren’t significant.
They are significant enough to raise atmospheric CO2 levels. What effect that atmospheric CO2 has is a different issue.
I read your comment to mean that increased CO2 had a significant effect, not that emissions raised CO2 significantly, which I agree they have done. Sorry if I misunderstood.
Going from 316 ppm in 1959 to 404 ppm in 2016 has had not detectable effect except to increase plant growth, a good thing. The world continued cooling from 1959 to 1977, as it had dramatically since the 1940s, despite increasing CO2. Then, after the PDO flip in ’77, it warmed slightly until c. 1999, a Super El Nino year, then stayed flat or cooled slightly until 2016, another Super El Nino year. Hence, no discernible GHE from 88 more parts per million of essential trace gas.
The question is not whether two linear components are “required.” If they are both linear, you can’t separate them by fitting; assigning them separate weights becomes arbitrary.
Willy Pete. One cannot say this small amount of CO2 is insignificant. It supports all life on the planet and the bit more that has accumulated has caused a greening of the planet and in particular added 14% more forest. With 3 trillion trees on earth, that’s 420billion new trees.
We humans are expanding habitat and have doubled harvests and are making an enormous economic contribution to a prosperous and healthy planet with our emissions. Now perhaps the warming is only a fraction of what alarmists calculate and that part might be insignificant but we’re this molecule known to the ancients it would have been the basis for a gassy deity.
Michael,
Of course it is arbitrary. Nobody can separate natural warming from man-made warming. If CO2 levels stabilize or natural warming turns into cooling we can make some inferences.
Gary Pearse October 5, 2017 at 2:24 pm
You are correct that the fourth molecule of CO2 per 10,000 air molecules which we now enjoy and benefit from has had a significant effect on plant life. Arctic sea ice, not so much. As in, not at all.
Willy Pete
Apart from the observed the surface and lower troposphere warming, of course.
DWR54 October 5, 2017 at 4:10 pm
Please show how you determined that whatever warming has occurred since 316 ppm CO2 is due to that increase.
Also please explain why the earth cooled so dramatically for 36 years, from 1941 to 1977, while CO2 grew rapidly.
And also why the atmosphere has warmed more slowly and less than the surface, if AGW be the control knob on warming.
Thanks!
Willy Pete – The 1940 – 1970 cooling can be easily attributed to the massive increase in industrial aerosols in war and post-war boom. Aerosols, whether natural (volcanic) or anthropogenic (industrial aerosols) have a known cooling effect. The Clean Air Acts of the 1970’s, designed to deal with smog, resulted in fewer industrial aerosols and hence the warming trend from the 1970’s onward.
How you you explain troposphere warming and stratospheric cooling?
http://images.remss.com/data/msu/graphics/TLT_v40/plots/RSS_TS_channel_TLT_Global_Land_And_Sea_v04_0.png
http://images.remss.com/data/msu/graphics/C25/plots/RSS_TS_channel_C25_Global_Land_And_Sea_v03_3.png
Jack, that you can explain the cooling in terms of aerosols does not mean that the explanation is correct. The aerosol cooling effect has been assumed, to match the observed cooling (after reducing the cooling).
One of the problems of the CO2 hypothesis is that it requires a different explanation for every phase of the 65 year oscillation in temperatures. The 1945-75 cooling due to aerosols, the 1975-2003 warming due to CO2, the 2003-2014 pause due to something unknown. People defending this hypothesis must have not heard of William of Occam and his famous razor. A single 65-year oscillation is the most economical and therefore probable explanation for all the phases. This means CO2 effect is lower than assumed. The paleoclimatological data agrees with a low effect for CO2. The first 20 ppm of CO2 take care of the biggest part of its effect. At above 100 ppm it is mainly the plants that care about changes in CO2. Going from 300 to 400 ppm hasn’t changed much the warming rate that was taking place prior to our emissions.
Javier says “Nobody can separate natural warming from man-made warming.”
For the Arctic one can because rising CO2 should increase positive NAO/AO, while natural Arctic warming, both atmospheric and from a warm AMO is negative NAO/AO driven.
http://www.ipcc.ch/publications_and_data/ar4/wg1/en/ch10s10-3-5-6.html
And BTW, UAH lt shows that the north pole region cooled from late 1979 to early 1995.
So according to hypothesis we should look for positive correlation between Arctic temperatures and NAO/AO. Has this been done in those terms?
Javier
Down south, the time-relationship between changes in the Antarctic sea ice (daily anomaly) and the northward-flowing Peruvian current “might” appear to easily relate to the El Nino and La Nina changes (warmer water or cooler water off the Peruvian-Equadorian coasts), but the “classic” time-motion images for water oscillation across the Pacific show warmer water “regions” moving AGAINST the southern equatorial currents. If water were warmed by increased sunlight absorption around Antarctica, then flowed north by Chile, then turned at Peru and headed west towards Polynesia, these warm spot would go the other direction. Or the simulations that create the images could be flawed. Or surface currents might be different than deeper circulations. Or the time lag doesn’t match the time-needed-at-current-speeds doesn’t match.
I don’t know the answer, nor the relationship. But it is worth looking at deeper.
Seems like a fair assessment. We know very little of the Atmosphere we can see and far less about the deep oceans we have. With Jet Stream changes we have modern technologies that monitor them from space. In the depths of the ocean’s only a limited few in submersibles know how deep currents differ from surface currents.
Javier
For the Arctic, what needs to be studied BY MEASUREMENT (by computer models) are actual flows into the Arctic Ocean basin through the Bering Strait: Flows at each depth over 15-20 years, temperatures at those flow rates, temperatures and flows from the (few, but very large) freshwater rivers into the Arctic from Siberia, Northwest Territories, and the small ones in Alaska. Maybe try the outflows through the Davis Strait and Greenland Straits, but the bouys would be wiped out by the deep icebergs regularly going past, grounding and eroding the granite and mud.
regardless of outflows, you’d know the energy inflow (mass x cp x temperature) changes over time. Don’t know what you would know, but you would know how they changed.
Willy Pete
I haven’t determined it so much as the broad scientific community. The impacts of all other known forcings on climate have been assessed by numerous studies over several decades and a clear consensus has emerged: that the observed temperature rise post 1950 is inexplicable without considering the increased radiative forcing brought about by increased concentrations of greenhouse gases in the atmosphere. Also, that the observed warming would be even higher were it not for the countering effect of man-made aerosols, which have, over the same period, acted as a dampening force on surface warming.
You say the earth “cooled dramatically” between 1941 and 1977. In fact, the rate was -0.006C per decade cooling (GISS). If that rate’s “dramatic” then how should we describe the +0.175C per decade warming seen from 1978! Setting that aside; no one is saying that greenhouse gases are the only short-term drivers of climate. As previously mentioned, even human activity affects climate in different ways. The post-war period was one of heavy industrialisation with little thought given to emission reduction. Pumping billions of tonnes of reflective sulphates into the upper atmosphere has a cooling effect. That, alongside natural dampening effects like declining PDO and AMO over that period are the likely explanation for the (very slight) cooling trend between 1941 and 1977.
That’s a question that requires an answer no matter what’s causing the warming, since it would be a consequence of surface warming whatever its source. As far as I know it’s only really in the tropics where there is a big discrepancy between the models and the satellites. The latest RSS global TLT and TTT products actually show a faster rate of warming in the troposphere since 1979 than GISS shows at the surface.
“So according to hypothesis we should look for positive correlation between Arctic temperatures and NAO/AO. Has this been done in those terms?”
Of course, but needless to say very messily with their fundamental premise being the reverse of reality, they claim positive NAO drives Arctic warming (the Q+A link):
https://www.gfdl.noaa.gov/research_highlight/the-north-atlantic-oscillation-as-a-driving-force-for-observed-rapid-arctic-sea-ice-change-hemispheric-warming-and-atlantic-tropical-cyclone-variability/
Thanks
DWR54 October 6, 2017 at 5:05 am
The broad scientific community has no clue what are all the forcings on climate. It’s preposterous to imagine that they do, or that they’ve properly assessed the known knowns. Clearly, they haven’t, since the models have failed so miserably.
We do however know that the early 20th century warming was indistinguishable from the late 20th century warming, hence, no space for an increased CO2 forcing exists. We also know that for all but about 20 of the 72 years since the end of WWII, during which time CO2 has risen, earth has cooled dramatically or stayed about the same temperature. Again, no CO2 control knob on climate. We also know that the air has warmed less and later than the surface, ie the exact opposite of what the AGW conjecture predicts.
Case closed.
Willy Pete,
I’m not trying to play devil’s advocate, but:
Is not necessarily true. It is possible that natural warming has been decreasing and anthropogenic forcing increasing giving an indistinguishable warming. The assumption that natural warming has continued at the same rate is just another assumption, same as the assumption that it is no longer operating and all warming is anthropogenic.