My post about sea level rise in the Adjustocene reminded me of an article from 4 years ago…
Five Ways Climate Change Threatens Energy in Texas
JULY 18, 2013 | 9:05 AM
BY MICHAEL MARKS
The Department of Energy released a report recently looking at how climate change and extreme weather could make our power supplies more vulnerable. Given that it’s the nation’s leader in energy production, Texas was prominently featured.
The report looks at both current and future threats to the energy sector from climate change. There are three major trends, it says:
- Air and water temperatures are increasing
- Water availability is decreasing in certain regions
- Storms, instances of flooding, and sea levels are increasing in frequency and intensity
[…]
I meant to write a post ridiculing this back then, but got distracted with other things in need of ridicule and never got back to it until now.
First: The low-hanging fruit appetizer
“Storms, instances of flooding, and sea levels are increasing in frequency and intensity.”
While one could debate whether or not storms and instances of flooding are increasing in frequency and intensity…
Sea levels are definitely not increasing in frequency and intensity.
Note: I said that the notion of increased frequency and intensity of storms and instances flooding could be debated. I didn’t say I agreed that they were.
Next: The main course
4. Goodbye to Galveston?
In 1969, Glen Campbell wrote the song “Galveston,” which trumpeted the Gulf Coast city as an idyllic seaside escape. While that may still be the case, one of the report’s projections says it may not be for long.
The report says that sea levels in Galveston could rise by as much as 3.5 feet by the end of the century. According to Climate Central, nearly 25% of Galveston’s population currently lives just four feet above sea level. Such a rise could also alter coastal ecosystems and damage infrastructure for energy and trade.
NOAA tracks two tide gauges on Galveston Island: Pier 21 and the Pleasure Pier (no, it’s not a house of ill repute – that’s in La Grange).


6.5 mm/yr times 87 years (2013-2100) equals 565.5 mm… about 1.855 ft… 1 foot and 10 and 1/4 inches… About half of the DOE’s Goretastic claim of 3.5 ft.
But… That’s just half-the-fun! Knowing just a little bit about the area, I went to the Harris-Galveston Subsidence District to see what effect groundwater withdrawal may be playing in the rate of sea level rise on Galveston Island. Much to my pleasure, I found a contour map!

Approximately three quarters (74%) of the sea level rise on Galveston Island is due to subsidence from groundwater withdrawal. Here’s the subsidence map as an overlay on the NOAA tide gauge map:

Finally: Le pièce de résistance (AKA dessert)
5. $1 Trillion Worth of Risk for Gulf Drillers
As climate change progresses, so too will the risk for oil and gas companies who drill in the Gulf. The report cites a study by Entergy Corporation and America’s Wetland Foundation that says that by 2030, over $1 trillion in energy assets in the Gulf of Mexico will be at risk from hurricanes and rising sea levels.
Oil platform damage from hurricanes like Ivan, Rita, and Katrina could become more common as the number and intensity of Gulf storms increases.
[…]
Well… That $1 trillion worth of assets have been at risk from hurricanes ever since we started putting assets in the Gulf of Mexico. Rigs, platforms and pipelines do get damaged and sometimes even destroyed by hurricanes. That’s the nature of hurricanes. (Hopefully, the operators of offshore wind farms realize this.)
Hurricane losses can also create opportunities and lead to innovation.
HELIX PRODUCER I
THE GULF OF MEXICO’S FIRST FLOATING PRODUCTION UNIT
The Helix Producer I DP2 monohull floating production unit is designed to produce hydrocarbons and export to shore via pipeline or tanker. The vessel is equipped with a disconnectable transfer system (DTS) which allows the ship to weathervane during production. This setup also allows disconnection from flowlines, pipelines and umbilicals, enabling the vessel to seek shelter from severe weather and during conditions where position onsite cannot safely be maintained.
Upon return to the production site, the DTS buoy can be retrieved and reconnected so that processing operations can resume.
The Helix Producer I is designed to serve smaller oil fields in deepwater over the life of the facility, and can also be used as an early production test vessel.
Process facility capacities are as follows:
Nominal Oil Production: 30,000 BOPD
Maximum Oil Production: 45,000 BOPD
Maximum Water Production: 50,000 BWPD
Maximum Total Liquids Production: 60,000 BFPD
Maximum Associated Gas Production: 72 MMSCFD

The HP-1 enabled the resurrection of a deepwater field after Hurricane Rita destroyed its production platform. Oddly enough, the field was named Typhoon. It’s now named Phoenix.
Even old fixed platforms can and have been modified to better handle hurricanes. This was done six years before the DOE and NPR warned us about hurricanes:
Existing platforms raised to increase storm clearance
02/01/2007
A Devon Energy-operated platform with 44 people on board in the Eugene Island 330 field in the Gulf of Mexico was raised 4.25 m (14 ft) by 32 synchronously controlled hydraulic cylinders. The eight-leg platform, Eugene Island 330C, in 76 m (250 ft) of water originally was installed in the early 1970s. In 2005, Hurricane Rita passed through the field causing significant damage to EI 330C and claimed connecting platform EI 330S. In order to prevent repeated damage from future storms, EI 330C and neighboring platform EI 330B, which had also suffered significant damage from the hurricane, Devon teamed with Versabar to raise both platforms.
Due to the size of the hurricanes during the 2005 season and resulting uncertainty in future requalification metocean criteria, Devon Energy decided to have the platforms qualified to meet API RP 2A, Section 17, A-I criteria, even though the platforms were classified as A-2. Analysis showed that by raising the decks 4.25 m (14 ft), the effects of wave-in-deck loading would be removed and a comfortable air gap established. Analysis also showed that the additional leg movements attributable to increased platform leg length would not affect the structural integrity of the platform. The deck-raising was sanctioned by Devon and partners in May 2006, with raising operations for the two decks completed by November.
[…]


Regarding the nonsense about sea level rise. The EI 330 air gap restoration was due to seafloor subsidence, not sea level rise.
Offshore production platforms and drilling rigs are designed to operate in the oceans. Oceans have these things called “waves.” Waves are a lot bigger than sea level rise. And the industry has steadily improved the survivability of platforms over the past 50 years.
Changing-Practice-in-Gulf-of-Mexico-Design-and-Operating-Criteria (1)
Fixed platforms are designed to have a minimum air gap above the crest of 100-yr waves. The estimated 100-yr waves and air gaps are very large relative to sea level rise.

Simply put… 1-2 ft. of sea level rise per century is irrelevant to a platform designed to last less than 50 years, deal with 10 ft. of seafloor subsidence and handle 75 ft. waves…
Deck height
Deck height is the vertical distance from the still water surface to the underside of the lowest deck structural element on the platform. It is important to construct oil platform decks high enough above the water’s surface to avoid waves washing over the top, which could overload the platform and destroy it. While deck heights can be too low for several reasons, the two most common are:
Age — Older platform decks were set low because of available construction equipment at the time and because of a lack of knowledge of wave heights in the Gulf of Mexico and;
Subsidence — Some areas of the Gulf of Mexico floor have experience several feet of subsidence, or settling, related to production.
Usually, significant settling is found in older platforms because it can take 20 years to obtain 8 to 12 feet of subsidence. For example a platform installed in 250 feet of water 35 years ago may have been installed with a deck height of 45 feet. But after 20 years of production from multiple wells, there may be 10 feet of subsidence that reduces deck height to, say, 35 feet — leaving the platform more vulnerable to wave-in-deck loads never considered in the original design.
Whereas it would take a 75-foot wave height to reach the original deck when it was 45 feet above the still water surface, it would only require a 58-foot wave to reach the same point on the deck with 10 feet of subsidence. The chance of a 75-foot wave occurring at a platform site in the Gulf of Mexico in any given year is about 1 percent while the chance of a 58-foot wave is about 6 percent — placing the subsided platform at a significantly higher risk.
Conclusions
- Galveston Island is not likely to experience another 3.5 feet of sea level rise this century, it is not about to vanish under the Adjustocene Sea and three-quarters of its recent sea level rise is due to subsidence.
- $1 trillion worth of oil industry assets in the Gulf of Mexico are at risk to hurricanes and storms. Always have been, always will be. We knew that beforehand and continuously try to improve the survivability of things we build in the oceans.
- Rising sea levels are irrelevant… even in the Adjustocene.
Just out of curiosity: If Galveston were to stop pumping groundwater forthwith, would the subsidence be reversible? Are there any such precedents?
Water would have to be pumped back in to the aquifer.
Interestingly, better management of the aquifer has made a difference…
http://hgsubsidence.org/wp-content/uploads/2013/05/Harris-Galveston-Subsidence-1906-2000-1024×779.jpg
http://hgsubsidence.org/wp-content/uploads/2013/05/Harris-Galveston-Subsidence-1978-2000-1024×701.jpg
http://hgsubsidence.org/wp-content/uploads/2013/05/Harris-Galveston-Subsidence-1995-2000-1024×728.jpg
All of the subsidence at Galveston Island occurred before 1978. This would lead to an acceleration in sea level rise after 1978 if there was never any subsidence, nor affects from harbor dredging and “island building.”
Wouldn’t natural recharge lift the overburden?
Not very much…
Aquifers replenish themselves eventually, on the other hand some of that replenishment can be a result of saltwater intrusion.
Aquifers do recharge. However, if the rock or sediment matrix has collapsed, resulting in subsidence, there will be less pore space in the reservoir.
Galveston GPS stations have subsidence at:
– 4.59 mms/year between 1998 to 2003; and,
– 3.44 mms/year between 2006 to 2014.
http://www.sonel.org/spip.php?page=gps&idStation=676.php
http://www.sonel.org/spip.php?page=gps&idStation=2973.php
I’m right on the 2 foot line. That explains a lot.
Re: “All of the subsidence at Galveston Island occurred before 1978. This would lead to an acceleration in sea level rise after 1978 if there was never any subsidence…”
I think there might be a typo in that.
1. If subsidence ceased by 1978, then you’d see a deceleration in sea-level rise after 1978, as the rate of sea-level rise decreased from being the sum of GMSLR + VLM to being GMSLR alone.
2. I don’t think all of the subsidence occurred before 1978. Galveston Island is still experiencing extremely atypical local sea-level rise, more than 4x the global average, which I think has to be due to subsidence. This is the measurement record from the best tide-gauge on Galveston Island:
http://sealevel.info/8771450_Galveston_Pier_21_2017-07-18_noaa.png
–
GMSLR = Global Mean Sea Level Rise
VLM = Vertical Land Motion
I think you’re right based on the GPS data… but the HGCSD subsidence maps indicate otherwise.
If the subsidence maps are correct, ecstatic (sp. eustatic!) sea level rise would have been diminishing from 1906-1978 and then accelerating afterwards because the isostatic component would have changed.
In my opinion, it is more probable that the Galveston Island just slowly sinks much irregarding the ground water use (and draining) that leads to collapse of the porous structure of sediments under the city. But because I lack data at the gauge – and probably that data has not been measured / collected to a good precision, I restrain from claiming it is so.
How precise yearly subsidence info there exists at the tide gauge? The GPS values are only recent and thus don’t give a good overall picture.
The subsidence maps aren’t based on the tide gauge data or GPS. They are based on geodetic surveys.
No. The subsidence is not reversible. As we pump out the groundwater, it allows the material in the ground to settle, losing some of the space. Pumping water in will refill the remaining spaces, but will not expand the spaces to where they were.
Just such a proposal was made several years ago to lift Venice out of its lagoon. See here:
http://blogs.umass.edu/natsci397a-eross/3330/
Back in the day they raised Chicago about 10′ without too much drama. Course now the EPA studies would take a decade and then the lawsuits would take decades longer so well…forget it.
Hi David and Michael – US Gulf coast subsidence is not only due to water and hydrocarbon extraction. There’s also geologic subsidence – tons and tons of material discharged from the Mississippi river over eons. The entire gulf coast is sinking and has been for a very long time. And, of course, the barrier islands and the Mississippi delta are basically mud/sand.
Very true.
The green fund-raising efforts called “news” rarely mentions subsidence, as melting glaciers are so much scarier.
That is for sure. I have heard nearly every major news outlet reference sea level rise when talking about the big iceberg from the last week, ignoring the basic physics involved with floating ice shelves being part of glacial advances/growth. Let alone the history of even bigger icebergs being ignored.
I wonder how many in the media would even understand this item from NOAA?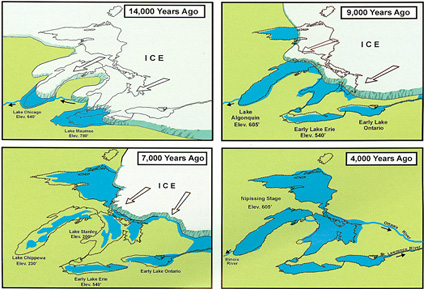
Excellent article, except that I don’t think it’s groundwater withdrawal which is causing the subsidence. It’s because most of Galveston Island is built on silt which was pumped out of the harbor.
Great video! Galveston is one of our favorite places to visit. My wife and I were married in a historic church in Galveston… St. Joseph’s was built in 1860 and survived the 1900 hurricane.
Very interesting!
Thanks!
It kind of reminds me of Seattle. There they filled in around the buildings to raise the street level by as much as two stories. The resulting tunnels have become a tourist attraction. link Seattle was originally built in a location that was too low but there is some subsidence where they built on sawdust fill.
Nobody is predicting a worst case sea level rise of more than a meter by 2100. link Seattle has demonstrated that cities can deal with much more than that.
In my city of Port Coquitlam, we are building new construction several meters above the original land height, at least in the areas near the Pitt River and mouth of the Coquitlam river.
https://twitter.com/Protonice/status/887996253539151872
Only the buildings in the city of Galveston were raised. This was in response to the 1900 hurricane whose storm surge went over the island. The tidal gauge stations are not in the city but in the harbor and should not be affected.
As a person who lived in the Houston/Galveston area from 1979 to 1997, I believe the areas south of Houston switched their water source from well-water to lake water in the early 1990s in response to the threats posed by subsidence. If well-water is a major factor in subsidence then it is not apparent on the map above. As an example, I find it interesting that the greatest subsidence is located in the most industrialized portion of Houston, the Houston ship channel. It sure looks like land use and subsidence has a far greater effect on coastal flooding than rising sea levels from global warming.
Water isn’t just pumped for drinking. The petrochemical facilities pumped a great deal for use in their processes, hence the correlation of subsidence with the industrialized areas along the ship channel.
Wow. Thanks for this piece.
David,
TYPO: “About have of the DOE’s Goretastic claim…”
Fixed.
David,
I don’t see the colors for sea level trends on Figure 4 — and I’m not even wearing my eclipse glasses, yet.
That’s because the gray area of the subsidence map is covering up most of the two orange “up” arrows. You can see the tip of one of the arrows just above Pelican Island. PowerPoint only allows me to render one color transparent. I opted for white. There is a yellow “up” arrow visible to the northeast at Sabine Pass.
Alternatively ?zoom=2
This graph shows four apparently ‘co-related’ variables
Most of the north American continent is subject to postglacial uplift. The uplift extends to the northern portion of the North American tectonic plate, which btw. covers about 50% of the Arctic Ocean.
If the Arctic Oceans floor is rising (Hudson Bay area has risen about 2m, yes two meters, in the last hundred years) then all that water has to go somewhere else. About 30% of the long term gravity anomaly in the N. Canada is a directly associated with post-glacial uplift, which in turn is reflected in the short term (on dacadal scale) of the local magnetic variability .
It could be postulated that the local magnetic change is a good metric for the uplift variability, and consequently the sea level rise.
Up and down somewhere else!
Actually most of the Arctic Ocean bottom is probably sinking. The areas that are rising are the ones which were glaciated. Most of the Arctic Ocean is to deep to beglaciated, so it would have been in the “forebulge” zone outside the glaciated areas during the last ice-age and is now sinking back (like most of the US).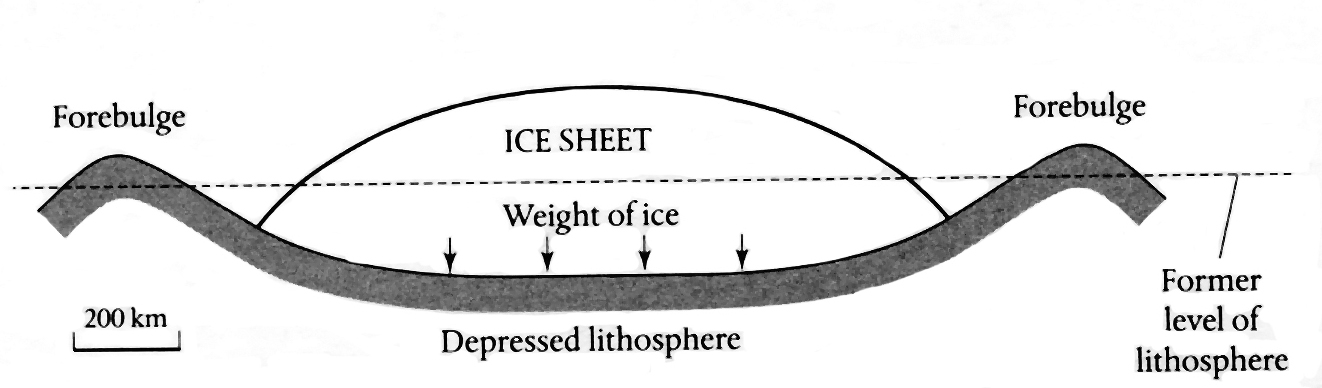
I assumed that since Florida is sinking and Canada rising that the plate is (solid enough) to be tilting around some imaginary ‘midpoint’ axis. If the places as far south as Florida from the glaciation line is sinking, then at least parts of the Canadian Arctic Ocean would be rising. In that respect I would think that the above illustration from SIAM may be somewhat misleading, but then I’m not geologist.
It is somewhat misleading. The forebulge is a lot wider than in the illustration. Just how wide is uncertain, but it seems clear that e. g. Bermuda is within the forebulge zone and possibly the Bahamas too. The width may be variable since it depends on the viscosity of the lithosphere which is definitely variable, but only very vaguely known.
I just found this map (if correct) shows clearly up and down areas (confirming my assumptions as outlined above)
http://onlinelibrary.wiley.com/store/10.1029/2006GL027081/asset/image_n/grl21953-fig-0001.png?v=1&s=cf14cb17ae7ea22fe0c457e4aa85eae282ffca8c
“(left) Vertical GPS site motions with respect to IGb00. Note large uplift rates around Hudson Bay, and subsidence to the south. Green line shows interpolated 0 mm/yr vertical “hinge line” separating uplift from subsidence. (right) Horizontal motion site residuals after subtracting best fit rigid plate rotation model defined by sites shown with black arrows. Red vectors represent sites primarily affected by GIA. Purple vectors represent sites that include effects of tectonics.”
http://onlinelibrary.wiley.com/doi/10.1029/2006GL027081/full
map:
http://www.vukcevic.talktalk.net/PGISU.gif
Interesting
Texas Flood – Stevie Ray Vaughn
https://youtu.be/BWGB91DZkVE
Enjoy!
Great loss as a musician.
You know if your fill a bathtub halfway, mark the level on all 4 sides, add more water, mark the level on all 4 sides, drain the water, then measure the 4 level deltas you will find that they are never equal to each other.
/sarc
Despite the sarcasm, your point is valid. Climatologist witch doctors intentionally confuse the general public by conflating subsidence with sea level rise. They are two completely separate and independent issues driven by completely separate and independent mechanisms.
Interestingly, it has been suggested that spent nuclear fuel (mischaracterized as “waste”) although not producing enough energy to drive the turbines of a nuclear plant any longer, still retains an enormous amount of its previous energy – roughly 95%. That means that, instead of spending money to bury the spent fuel for a long period to allow their radioactivity to return to background levels, which does nothing more than heat the enclosure that contain them, we should use our brains and place them into cask containers (currently being used) , which they will heat initially (and for a very long time afterward) to a temperature well beyond the boiling point of water – up to 350 degrees. This essentially free energy can easily be used to desalinate an enormous amount of seawater , removing the need to extract water from a city’s aquifer, perhaps eliminating most subsidience.
http://nuclearstreet.com/virginia_nuclear_energy_consortium/w/wiki/330.a-novel-way-ti-recycle-spent-nuclear-fuel
Most of the subsidence shown on that map IS in fact related to groundwater withdrawal, with some impact also from oil and gas removal as well, hence the two bullseyes around the Texas City and Baytown areas, where refineries pumped huge amounts of O&G in the past and huge volumes of GW for use in their processes. The subsidence in the Houston-Galveston area has been greatly mitigated near the coast in recent years as most of the communities and large volume users have been converted over to surface water supplies provided by the City of Houston. Not all of the petrochemical assets susceptible to storm damage are floating or moored to the bottom in the gulf. Some of the largest petrochemical complexes in the country are between Galveston and Houston and are mostly located at or below 20′ above sea level.
I should correct myself to say that the “refineries” didn’t pump huge amounts of O&G…but large numbers of wells placed very near the refineries did. For an interesting view of things, go to Google Earth and search for “Tabbs Bay” near Baytown, Texas. If you look north of Hog Island on the 1978 historical image on Google Earth, you can see several dozen oil wells in Tabbs Bay. I have historical photos from that area showing an enormous cluster of wells in the bay in that areas over a period of several decades. Those wells correlate to one of the small bullseyes showing around 10′ of subsidence on David’s original map. The subsidence along the bay near Baytown was so severe that the Brownwood Subdivision was bought out by the government due to repeated flooding and is now used as a nature center.
The completion of GCWA’s infrastructure mostly ended major groundwater withdrawal on municipal and industrial scale.
Texas City, Kemah, LaMarque, and Galveston (most all of Galveston County) including rice irrigation in Galveston and Brazoria Counties, is supplied water by Gulf Coast Water Authority. The freshwater needs of the refineries and chemical plants are supplied by same. The source is the Brazos River. The infrastructure for the drinking water and raw water from the Brazos was essentially completed in the mid-seventies. That transition ties nicely with the end of the subsidence in the maps above.
The levee’s surrounding Texas City were built in the 50’s/60’s. They were originally 17′ AMSL…. for a Cat 3 surge….not anymore.
I worked down there from 1999-2007, the last for were with GCWA.
David, you are a treasure! I’m a geologist and geological engineer (BSc Eng ’61, MSc Geol 68) with an eclectic work history still practicing full time as a consultant in mining and metallurgy.
My first work – Geological Survey of Manitoba, then hydrologist along the rightofway of the Greater Winnipeg Floodway (Red River of the North) , at the time second only to the Panama Canal in terms of cubic yardage excavated, and in town water supply during which I discovered the extension of the former old Missouri River channel at depth below Lake Agassiz bottom clays in Manitoba when it flowed north to the Arctic during earlier interglacials (reversed flow during glacial damming and was captured by a river that is now the lower modern Missouri). Did Geo Survey work, mineral exploration and metallurgical in Nigeria (co-founder and lecturer at Nigerian School of Mines), other Africa, mineral economics for Canadian Feds writing chapters in the Canadian Minerals Yearbook,
I worked for the oil and gas industry for 5yrs, went on to consulting in mining, exploration and metallurgy. I keep up my interest O&G and even wrote a tech-ec report on the proppants (Frac sand- natural and manufactured) industry in North America for Roskill Information Services in UK (Roskill. com) which they sell for a small king’s ransom! And have an interest in climate and never miss one of your excellent articles. Real geologists came to the fight relatively late. I used to think the alarm was real before delving in.
Geologist all around, my daughter is one, working for a well known international mining company, one of the largest. Strangely many of them, including the three world largest have headquarters in the UK, while the UK virtually has no mining of any consequence.
You don’t have to live in the shadow of a head frame.
And if you are the supplier of capital rather than labour you generally choose not to be near it except for the yearly photoshoot for the annual report
Gary, I am flattered and honored by your compliments. My work has pretty well been the inverse of eclectic. All “little oil” (as opposed to Big Oil).
I worked East Texas from 1981-1988 and then I’ve worked the Gulf of Mexico (mostly East Cameron South Addition and Garden Banks) ever since. The first offshore project and first 3d survey I ever worked was a field in East Cameron South Addition. I’ve worked that same field for 4 of the 5 companies I’ve worked for… 😉
David, you certainly are eclectic and thorough in your wide ranging topics demolishing Big Climate. I consider the neomarxbrothers’ policies to solve a non problem to be the biggest threat that mankind has ever faced and we need application of logic, incisive analytics and a skill with words like you possess in this task. I’ve always thought of geological deduction as the pinnacle of forensics. I have a beautiful example of just this idea: The global warmth and biological productivity of the Eocene was determined by a variety of such forensic analyses. The following direct window into the Eocene was discovered in the Ekati Diamond pipe near the Arctic Circle in NWTerritories in northern Canada: redwood chunks dating at 53Mybp – real wood with crystallized sap seams and even the red color was preserved- were found my miners at the 300m level in the open pit. Did the MSM jump all over this story? Of course not. Enjoy.
https://www.livescience.com/23374-fossil-forest-redwood-diamond-mine.html
Great article as always, David.
Harris county (Houston) is almost all exclusively surface water now. The conversion happened over many years, but (back in the day) western Harris County was covered with rice farms which were told they could no longer pump water to flood their rice patties. The farmers got the message, and eventually sold their farms to create subdivisions.
The main culprits of the sinking were the refineries. They use a lot, and the sinking surrounds their wells. But all in the multi-county area had to stop using ground water. There was resistance from small water districts who wanted to keep using ground water. After all, the surface water reservoir is in east Harris County, and the water districts in western Harris County weren’t interested in converting.
As the map shows, some areas sunk more (faster) than other areas.
When Hurricane Alicia struck, it devastated low lying areas that had sunk the most along upper Galveston Bay. It completely took out one subdivision called Brownwood in Baytown. The owners were forced to leave. This has since been turned into a nature center. The evidence of sinking/destruction of Brownwood was the last straw, and was used as the scare tactic to get/force the rest of Harris County on surface water.
So the big financial threat from fantasised extreme climate change is to oil rig assets that would be rendered valueless in a decarbonised economy. Rather a weird argument.
I does push the weirdness envelope… It logically compares to “We have to pass the bill, so we can see what’s in it”… 😉
It is the never ending flow of b.s. by the climate obsessed that I despise the most. The simple, closed minded anti-reality positions of the climate true believers is so predictable and so deceptive.
Thank you David for another informative article.
My first visit to Baytown was in the mid 60’s and was told then by an engineer that the local subsidence and flooding at high tide was due to ground water removal. It may be more complicated but the issue has been going on for a long time.
Living along the NJ coast, I know that the barrier islands have been sustained since I was a youngster by pumping sand from the ocean back to the beaches and the streets still flood during a heavy rain.
The “Adjustocene”? I’m going to have to remember that one- BRILLIANT!
The credit goes to Josh…
SUBSIDENCE: The go-to site for subsidence (or its opposite) in the USA is always the NOAA CORS project.
The data available for Galveston, TX is:
https://www.ngs.noaa.gov/cgi-cors/CorsSidebarSelect.prl?site=txga&option=Time%20Series%20(short-term)
ftp://www.ngs.noaa.gov/cors/Plots/Longterm/txga_08.long.png
Galveston seems to be rising up a bit in the last few years, rather than subsiding. One must remember that Galveston is built on a sand bar — a barrier island — not solid ground.
Climate change sea level alarmism is nonsense. At any location, the local sea level is dominated by land movements, not climate change. And worldwide, coastal land areas over the past 30 years have actually increased (e.g. from river silting and land uplift) more than they have decreased (e.g. from subsistence), as revealed from actual satellite observations:
http://www.nature.com/nclimate/journal/v6/n9/full/nclimate3111.html
https://www.deltares.nl/en/news/how-the-earth-has-changed-over-the-past-30-years/
David,
Yet another thoroughly educational and entertaining article, refuting the ‘topping-the-snorkel’ assertions of accelerating sea level rise while leading us through so many more points of historical and geological interest! Thank You!
“The Helix Producer I DP2 monohull floating production unit”
I like it!
It started its maritime life as a North Sea train ferry. Helix is kind of like the Thunderbirds of oilfield services vessels.
Sea level change — raise and fall — are associated with several natural [earthquakes, volcanoes, tsunami, etc] and man made causes [destruction of coastal zones, water-oil-gas extraction, testing of atomic bombs, dumping of waste along the coast lines, etc]. For each station or region the detailed analysis on cause and effect must be studies by taking account the natural cyclic variations including associated with the Moon’s phases.
I discussed these aspects in my latest book [Climate Change and its Impacts: Ground Realities” [2016].
Dr. S. Jeevananda Reddy
https://www.eenews.net/climatewire/2017/07/18/stories/1060057519
Announcing a lawsuit demanding compensation from oil companies for sea level rise.
The beauty of tide gauge charts is that there are plenty of them all over the world, so they can be cherry-picked to find those where local vagaries provide meat for those who seek to mislead.
The inescapable fact of the satellite record is that the global rate of sea level rise has doubled since the late 20th century – and is accelerating.
“Cherry picking”? A bit of projection there, Jack? The only “acceleration” in sea level rise is almost certainly due to grafting tide-gauge records onto satellite estimates. The problems with the satellites has been covered quite extensively, and you almost certainly know that, and do not care.
David Middleton – this is my third attempt to reply to you – somehow my replies don’t get through. So I won’t waste much time on this one.
1. They didn’t adjust the data to fit the model. They corrected an error in the data and then found it agreed with multiple other real world data.
2. That there was a data error had been verified by others:
““Whatever the methodology, we all come up with the same conclusions,” says Anny Cazenave, a geophysicist at the Laboratory for Studies in Space Geophysics and Oceanography (LEGOS) in Toulouse, France.
[…]” (the omitted section didn’t suit your argument?)
3. You guys spend your time besmirching what is in fact a magnificent international collaborative effort. We should all be thankful that these guys are out there and able to forewarn us.
Inescapable fact? Really?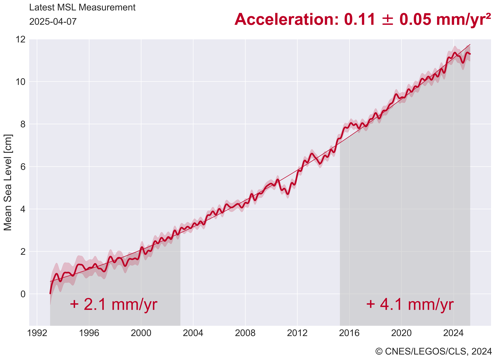

https://www.aviso.altimetry.fr/en/data/products/ocean-indicators-products/mean-sea-level.html
http://sealevel.colorado.edu/files/2016_rel4/sl_ns_global.png
http://sealevel.colorado.edu/
http://www.cmar.csiro.au/sealevel/images/alt_gmsl_seas_rem.jpg
http://www.cmar.csiro.au/sealevel/sl_hist_last_decades.html
https://podaac-ftp.jpl.nasa.gov/dataset/MERGED_TP_J1_OSTM_OST_GMSL_ASCII_V4
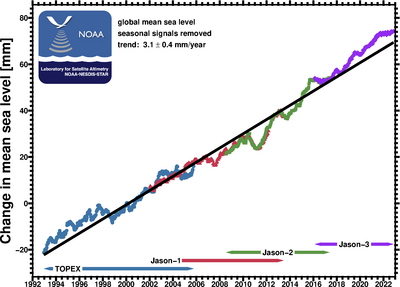
https://www.star.nesdis.noaa.gov/sod/lsa/SeaLevelRise/
It looks like everyone needs to adjust their data.
The recent announcement of accelerated sea level rise was due to a decision to apply a downward adjustment to the data in the early 1990’s.
They dropped the early 1990’s from about 3.4 mm/yr to 1.8 mm/yr. Present day sea level rise remains where is was prior to the proposed adjustments. They propose to slow down the past to make the present appear to be accelerating.
No – you guys are just plain wrong:
https://tamino.wordpress.com/2017/01/30/sea-level-acceleration/
You’d be a danger to the planet if you weren’t holed up here in your ghetto talking crap to fellow travellers who have a taste for crap.
The world is fast waking up to the climatic emergency and you guys will melt away – shamefaced.
Try to follow along. I will try not to use any big words.
When the observations don’t match the models, adjust the observations…
Steven Nerem leads the sea level team at the University Colorado. This is what their sea level trend looks like today:


A nice, steady 3.4 mm/yr (+/-0.4 mm)
The adjustment, he refers to in the Nature article will move the early 1990’s down to 1.8 mm/yr and the present up to 3.9 mm/yr.
So… They accomplished accelerated sea level rise by slowing down the past.
I also provided you with the current sea level trends from all of the other academic and government groups tracking satellite altimetry sea level. All of them show steady trends of about 3 mm/yr.
None of these groups have adjusted their data yet.
Just a few months ago, Nerem and company published a paper bemoaning the fact that they had yet to detect any acceleration… http://sealevel.colorado.edu/content/new-group-publication-detection-accelerated-sea-level-rise-imminent-fasullo-et-al
A little perspective…
More perspective…
And more perspective…
Dr. Nerem suggests that his adjusted sea level trend could lead to 75 cm (750 mm) of sea level rise by the end of the century. This would necessitate a late 21st century rate greater than the Holocene transgression..
When there was a helluva lot more ice to melt…
“When the observations don’t match the models, adjust the observations…”
Paranoia is not such a big word either – and might apply to your claim.
They didn’t slow the past, they corrected an instrument error.
If the adjustment for satellite error is valid, your argument collapses. “It’s all coming together.” That’s what any detective says when he starts pulling all the threads of the case together and appreciating the big picture. These guys are experiencing the thrill of the chase while you guys sit back and misconstrue their data for murky personal reasons. Only a jaundiced observer would take the statement as evidence of malfeasance.
Probably time for a new more powerful and accurate satellite – in the appropriate orbit. Spacex is offering cheap rides.
David Middleton wrote, “When the observations don’t match the models, adjust the observations…”
Jack Davis replied, “Paranoia… might apply to your claim.”
Just because you’re paranoid that doesn’t mean they aren’t out to get you. The Climategate emails provide ample cause to suspect a thumb on the scale. Do you recall this discussion between Phil Jones and Tom Wigley about how to adjust-down the 1940s “warm blip,” to support the Hockey Stick narrative?
FOIA/1254108338.txt
BTW, Jack, how are you coming on your quest to find even one high-quality, long-term, sea-level measurement record which exhibits significant sea-level rise acceleration? Are you ready to give up yet? Are you ready to admit that none of the high-quality, long-term, sea-level measurement records show significant, sustained acceleration in rate of sea-level rise?
Jack Davis wrote, “You’d be a danger to the planet if you weren’t holed up here in your ghetto talking crap to fellow travellers who have a taste for crap.”
Mind your manners, Jack. This is not Tamino’s silly blog.
Tom Halla and David Middleton are trying to help you understand this. David, especially, has been very generous with his time. Show a little gratitude
Jack Davis wrote, “The inescapable fact of the satellite record is that the global rate of sea level rise has doubled since the late 20th century – and is accelerating.”
That is untrue. If you know how to read a graph, and if you actually read what David Middleton wrote to you, you should know that what you wrote is untrue.
Even President Obama’s former Undersecretary for Science, Dr. Steven Koonin, has noted that:
Neither the satellites nor the tide gauges have measured significant, sustained sea-level rise acceleration.
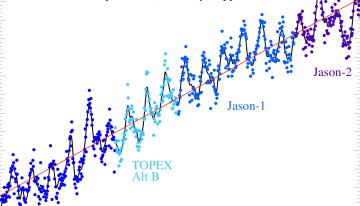
In the case of the satellite altimetry, that’s pretty meaningless, because the data is very poor quality, and endlessly corrected/adjusted, and the longest single-instrument measurement records are only about a decade. The trends measured by satellite altimeters depend more on the instruments than on the actual sea-level.
But the tide gauge data is excellent. We have many long, high-quality, trustworthy, sea-level measurement records from tide gauges, including around five dozen extending back for more than a century. Those data needn’t be constantly corrected, adjusted & homogenized.
None of those high-quality, long-term, sea-level measurement records have measured significant sea-level rise acceleration since the 1920s or before. At most sites it’s been more than a century since they’ve measured significant sea-level rise acceleration.
Jack wrote, “The beauty of tide gauge charts is that there are plenty of them all over the world, so they can be cherry-picked to find those where local vagaries provide meat for those who seek to mislead.”
No, they can’t.
I challenge you to try it. See if you can find even one high-quality, long-term (>100 year) sea-level measurement record which shows significant acceleration.
You can’t do it, because there aren’t any.
That’s why “those who seek to mislead” about sea-level mostly talk about satellite altimetry, and/or tide gauges with very short measurement records. The high-quality, long-term measurement records all show the same thing: anthropogenic GHG emissions and anthropogenic global warming have not caused sea-level rise to measurably accelerate.
Measured rates of sea-level change vary from location to another, mostly due to local differences in VLM. But most of the VLM processes close to linear on century-level and shorter timescales, so they have little effect on acceleration. Consequently, all the highest-quality, long-term, sea-level measurement records show the same thing w/r/t acceleration: two-thirds of a century of soaring GHG levels and the associated global warming have caused no significant, detectable acceleration in the rate of sea level rise.
North Pacific:
http://www.sealevel.info/MSL_graph.php?id=Honolulu
http://www.sealevel.info/1612340_Honolulu_vs_CO2_annot1.png
South Pacific:
http://www.sealevel.info/MSL_graph.php?id=Sydney&c_date=1930/1-2019/12&boxcar=1&boxwidth=3
http://www.sealevel.info/680-140_Sydney_1930-2016_vs_CO2_425x179.png
US East Coast:
http://www.sealevel.info/MSL_graph.php?id=Newport,+RI&boxcar=1&boxwidth=3
http://www.sealevel.info/8452660_Newport_RI_vs_CO2_2016_425x179.png
Europe:
http://www.sealevel.info/MSL_graph.php?id=Wismar&c_date=1866/1-2019/12&boxcar=1&boxwidth=3
http://www.sealevel.info/120-022_Wismar_2017-01_150yrs_425x179.png
The average is just under 1½ mm/year (about 6 inches/century). Honolulu & Wismar are about average, Sydney is slightly below average, Newport, RI is quite a bit above average. But all of them show the same thing w/r/t acceleration: there’s been none since the 1920s or before.
Perhaps your problem is that you know how to recognize “acceleration” in a graph. If that is the case, this should help you:
http://www.sealevel.info/acceleration_primer.html
http://www.sealevel.info/acceleration_primer_screenshot_709x1569_ltgrey.png
I hate it when my typos invert the meaning.
“Perhaps your problem is that you know how…”
should be:
“Perhaps your problem is that you don’t know how…”
Dave, of course I know acceleration when I see it on a graph.
About 1900, when the Scandinavian chap whose name I forget (Arhellius?) calculated the effect that doubling atmospheric CO2 would have on planetary temperature, he was pretty much in agreement with modern science. What he didn’t foresee was that we would be up there so fast – that carbon powered industry would accelerate as fast as it has. He thought it might take a thousand years to get CO2 levels to where they are today.
That’s at the base of the problem we have in interpreting the data. The physical chemistry of carbon and its heat trapping ability has been well understood for almost 200 years. However, the radical build-up in atmospheric carbon levels has ocurred over such a short period of time geologically that it is easy to make spurious arguments and fail to realise the big picture from a very small section of time.
I’m over arguing today – it won’t be too many years now before the science will be irrefutable and you’ll be wondering why you couldn’t see it.
Either that, or you’ll still be arguing it’s not happening when the waves are breaking over Lady Liberty’s sandals.
Cheers
Jack Davis wrote, “Either that, or you’ll still be arguing it’s not happening when the waves are breaking over Lady Liberty’s sandals.”
Don’t hold your breath waiting for that, Jack.
The Lady Liberty’s sandals are more than 150 feet above sea level.
Since 1925, sea-level at Battery Park, NYC, has been rising at a remarkably steady 3.18 ±0.18 mm/year (and at least half of that is subsidence, rather than GMSL rise).
Despite a 33% (100 ppmv) increase in CO2 and a 83% (0.84 ppmv) increase in CH4, in all that time the rate of sea-level rise has not accelerated, at all.
http://www.sealevel.info/MSL_graph.php?id=battery&boxcar=1&boxwidth=3&c_date=1925/1-2019/12
http://sealevel.info/8518750_The_Battery_2017-01_since_1925.png
Using the high end of the confidence interval (3.36 mm/yr), at the current rate 150 feet of sea-level rise would require 11,339 years.
To get 150 feet of GMSL would require melting the entire Greenland Ice Sheet, plus the entire West Antarctic Ice Sheet, plus 62% of the East Antarctic Ice Sheet.
Did you try to find “even one high-quality, long-term (>100 year) sea-level measurement record which shows significant acceleration”?
Do you acknowledge that you can’t find one, because there aren’t any, because sea-level rise hasn’t accelerated since the 1920s?
The Battery sea level data plotted at the same scale as the Statue of Liberty…
OK – it was an attempt at a colorful turn of phrase. I didn’t expect you to take it literally.
It has acceleated – the most recent determination is, as you’ve said, a doubling of rate in about twenty years. As with all good science, I expect that contention to be rigorously tested and checked from different angles in the near future.
I also expect you guys to find fault with any support for the contention – it’s human nature and it may be our downfall.
No. It hasn’t accelerated. Dr. Nerem said that he thinks the early portion of the satellite record needs to be adjusted in order to better match the tide gauge data. His calculations indicate that this will lead to an early 1990’s rate of 1.9 mm/yr and a current rate of 3.9 mm/yr. They have not yet applied that adjustment to the data.
When they do, it will reflect what Jevrejeva et al., 2008 demonstrated…
Sea level was rising at about 3.5 mm/yr in the early 20th century. The rate declined to about 1 mm/yr during the mid-20th century. Since about 1985, the rate of sea level rise has returned to about 3.5 mm/yr. That is not an acceleration.
Jack Davis wrote, “the most recent determination is, as you’ve said, a doubling of rate in about twenty years.”
What is this “as you’ve said” nonsense? I don’t know who you’re addressing, but all three of us have explained to you that there’s been no acceleration. There certainly hasn’t been any “doubling of rate” in the last twenty years.
Perhaps you were confused by that silly Sallenger “hotspot” Nature Climate CHange paper, “Hotspot of accelerated sea-level rise on the Atlantic coast of North America.” It was based on data through 2009, and focused on the NYC Battery Park gauge.
Here’s what’s happened there since 2009:
http://sealevel.info/8518750_The_Battery_1890_to_2017-01_trend_since_2009_no_CO2.png
Takeaway lesson: The ocean is full of water, and it sloshes.
David Middleton wrote, “Sea level was rising at about 3.5 mm/yr in the early 20th century. The rate declined to about 1 mm/yr during the mid-20th century. Since about 1985, the rate of sea level rise has returned to about 3.5 mm/yr. That is not an acceleration.”
David, that Jevrejeva graph doesn’t look anything like the individual tide gauge measurement records.
Here’s Honolulu, 1930-present, +1.29 ±0.27 mm/year:
http://www.sealevel.info/MSL_graph.php?id=Honolulu&c_date=1930/1-2019/12&datasource=noaa&boxcar=1&boxwidth=3&thick
Here’s Honolulu, 1930-1960, +1.53 ±1.31 mm/year:
http://www.sealevel.info/MSL_graph.php?id=Honolulu&c_date=1930/1-1960/1&datasource=noaa&boxcar=1&boxwidth=3&thick
Here’s Honolulu, 1960-1985, +2.13 ±1.78 mm/year:
http://www.sealevel.info/MSL_graph.php?id=Honolulu&c_date=1960/1-1985/1&datasource=noaa&boxcar=1&boxwidth=3&thick
Here’s Honolulu, 1985-present, +1.62 ±1.17 mm/year:
http://www.sealevel.info/MSL_graph.php?id=Honolulu&c_date=1985/1-2019/12&datasource=noaa&boxcar=1&boxwidth=3&thick
Here’s Wismar, Germany, 1930-present, +1.61 ±0.28 mm/year:
http://www.sealevel.info/MSL_graph.php?id=Wismar&c_date=1930/1-2019/12&datasource=noaa&boxcar=1&boxwidth=3&thick
Here’s Wismar, 1930-1960, +1.82 ±1.29 mm/year:
http://www.sealevel.info/MSL_graph.php?id=Wismar&c_date=1930/1-1960/1&datasource=noaa&boxcar=1&boxwidth=3&thick
Here’s Wismar, 1960-1985, +1.38 ±1.57 mm/year:
http://www.sealevel.info/MSL_graph.php?id=Wismar&c_date=1960/1-1985/1&datasource=noaa&boxcar=1&boxwidth=3&thick
Here’s Wismar, 1985-present, +1.37 ±1.55 mm/year:
http://www.sealevel.info/MSL_graph.php?id=Wismar&c_date=1985/1-2019/12&datasource=noaa&boxcar=1&boxwidth=3&thick
The Jevrejeva reconstructions are of eustatic sea level rise. In theory, they have removed the isostatic effects (land rising and/or subsiding).
According to Peltier, there’s very little isostatic movement at Honolulu and Wismar. (Negative is uplift, positive is subsidence; the last column is the estimated current rate.)
http://sealevel.info/Peltier/drsl.PSMSL.ICE6G_C_VM5a_O512.txt
http://sealevel.info/Peltier/drsl250.PSMSL.ICE5Gv1.3_VM2_L90_2012b.txt