Monster Solar Minimum Approaching?

Monster minimum or short solar cycle?

Guest essay by David Archibald

This recent post was on the fact that the Sun’s EUV emissions had fallen to solar minimum-like levels well ahead of solar minimum. The implication was that the Solar Cycle 24/25 minimum was either going to be very deep and prolonged, or that Solar Cycle 24 would be very short, which in turn would be strange for a weak cycle.

The indicator of the EUV flux is the Lyman alpha index. To recap, this chart shows the index over the last three cycles, starting from solar minimum:

clip_image002

Figure 1: Lyman alpha index Solar Cycles 22,23,24


Figure 1 shows that Solar Cycle 24 has reached solar minimum-like levels three years ahead of minimum, if Solar Cycle was going to be 12 years long. What happens at solar minimum is that the proportion of EUV as part of Total Solar Irradiance falls. For the 23/24 minimum, the extent of the fall was a surprise, with the density of the thermosphere shrinking 30%. The following figure plots up the ratio of the F10.7 flux, less its activity floor at 64, and the Lyman alpha index, less a presumed average floor of activity of 3.5:

clip_image004

Figure 2: F10.7 Flux/Lyman alpha ratio 1980 – 2017

The peak associated with the 23/24 minimum that surprised atmospheric researchers is quite evident. Also evident is a smaller peak associated with the 22/23 minimum. Nothing much seemed to happen prior to that. How that plots up with the F10.7 flux, and thus the solar cycles, is shown in the following figure:

clip_image006

Figure 3: F10.7 Flux/Lyman alpha ratio 1980 – 2017

As Figure 1 showed, the departure of the Lyman alpha index to minimum-like levels seemed early. But just how early is it if everything else is normal? That is shown in the following graphic:

clip_image008

Figure 4: F10.7 Flux/Lyman alpha ratio aligned on solar maximum

Figure 4 aligns the F10.7 Flux./Lyman alpha ratio on solar maximum for solar cycles 21 to 24 to two years beyond solar minimum, with the maxima being:

  • Solar Cycle 21 December 1979
  • Solar Cycle 22 November 1989
  • Solar Cycle 23 November 2001
  • Solar Cycle 24 April 2014

Based on the normal cycle tail from solar maximum, Solar Cycle 24 might have another three and a half years to go. So what is going to be: a monstrous minimum with a shrunken thermosphere and all the climatic effects associated with that, or a strangely short cycle?

We know when a solar cycle is over when the heliospheric current sheet flattens. The current state of the heliospheric current sheet is shown in the following figure:

clip_image010

Figure 5: Heliospheric Current Sheet Tilt Angle 1976 – 2017

The heliospheric current sheet tilt angle is 10° off the apparent floor of 3° but, based on the prior solar cycles, could still take a few years to get there. If Solar Cycle 24 does turn out to be short, then there is one person who predicted that: Ed Fix. Ed Fix, a retired B52 pilot in Ohio, sent me his planet-based solar model in 2009. He was inspired to created the model because the oscillation of the solar cycle reminded him of the ideal spring in mechanics. This is how the model plots up (red) and the historic sunspot record in green:

clip_image012

Figure 6: Ed Fix’s solar activity model

The model has the Solar Cycle 24/25 minimum in 2017. Solar Cycle 25 is predicted to be weak and short also. If events of the next year or so prove Ed Fix’s model to be correct, then it will be as significant as the results of any of the expeditions to observe solar phenomena over the last three centuries, but we get to watch in real time.


David Archibald is the author of American Gripen: The Solution to the F-35 Nightmare

0 0 votes
Article Rating
373 Comments
Oldest
Newest Most Voted
Inline Feedbacks
View all comments
Gabro
July 11, 2017 10:04 am

Meton was right. Herschel was right.
Only today’s educated idiots would imagine that CO2 and not the sun, with its activity modulated by earth’s orbital and rotational mechanics, is the control knob on climate.

Jeff in Calgary
Reply to  Gabro
July 11, 2017 12:13 pm

I’m fairly sure earth doesn’t have a significant effect on the sun. If anything planet was to effect the sun it would be Jupiter (with it’s enormous size) or Venus (with its close proximity).

Greg
Reply to  Jeff in Calgary
July 11, 2017 12:37 pm

I’m guessing that the comment indended to say the received insolation was modulated ….. , not the sun’s output.

Gabro
Reply to  Jeff in Calgary
July 11, 2017 1:47 pm

Earth’s orbital mechanics and rotation do indeed have a great effect, such as in causing ice ages.

Reply to  Jeff in Calgary
July 11, 2017 2:45 pm

It’s interesting that the sunspot cycle seems to be about the same as the orbital period of Jupiter. Perhaps when Jupiter and Saturn are on the same side of the Sun, tidal forces acting on the fusion core are at a maximum and when they align on opposite sides it’s at minimum. Not exactly sure which would generate more Sunspots, but my guess is that when the core is tidally stretched it would lead to more sunspot activity owing to non uniform fusion reaction rates, while with tidal effects minimized, the reaction rate is more uniform throughout the core.
This effect would also be modulated by the variability in the orbits, both of which are quite elliptical. For example, the largest tidal effect would be when Jupiter and Saturn align on the same side and both are at perihelion and the smallest when both are at aphelion and on opposite sides. The question becomes how long before an effect acting on the fusion core finds its way to the surface? Would the space between the fusion core and the photosphere be alternating layers of symmetric and anti-symmetric plasma propagating from the core to the surface?

Reply to  co2isnotevil
July 11, 2017 2:49 pm

You are on the right track. William Arnold also saw the link with Jupiter, Uranus and Saturn. The smaller planets also weigh in …

tony mcleod
Reply to  Jeff in Calgary
July 11, 2017 5:56 pm

comment image
Occam’s razor

Tom in Florida
Reply to  Jeff in Calgary
July 12, 2017 4:25 am

co2isnotevil July 11, 2017 at 2:45 pm
” The question becomes how long before an effect acting on the fusion core finds its way to the surface?”
I believe that Leif has stated that to be a couple of hundred thousand years.

TA
Reply to  Jeff in Calgary
July 12, 2017 9:26 am

All the planets have some effect on the Sun. Some more, some less.

Arnold Roquerre
Reply to  Gabro
July 11, 2017 6:09 pm

CO2 Cools
Given that increases in CO2 lags global warming, and high CO2 concentrations precedes ice ages. Is it that once CO2 passes a certain level, the cooling attributed to CO2 drives the lowering of global temperatures? And, because CO2 hangs around a long time, it takes longer than the warm up for levels to drop enough for warming to begin the cycle again.

ferdberple
Reply to  Arnold Roquerre
July 12, 2017 12:38 pm

The ice age records support this. Warming starts when CO2 levels are low, and cooling begins when CO2 levels are high. The opposite of what the GHG theory predicts.

george e. smith
Reply to  Gabro
July 12, 2017 8:13 pm

If I remember my 4-H club Atomic Spectra Physics, the Lyman alpha line is the lowest energy in the Lyman Series of the Bohr atom model, so the Lyman series are all in the UV.
The discovery of the simple (mathematical) series of frequencies of the hydrogen atomic spectrum lines seen in the solar spectrum, is one of the neatest discoveries of modern Physics.
That’s just my humble opinion of course so don’t go quoting me in your PhD thesis or you will be rejected by the bunch of judges or whatever goes for a selection process in your club.
G
PS And I could be all wrong about the above.

Tom Halla
July 11, 2017 10:16 am

Hard to tell what this will do to climate. It seems reasonable that solar variation would affect climate, but the actual instrumental measurements do not seem to have much correlation, at least over the last few solar cycles.

Gabro
Reply to  Tom Halla
July 11, 2017 10:26 am

Climatic phenomena correlate strongly with solar cycles and with their longer-term supercycles. And of course with Milankovitch cycles, ie the effect of earth’s movements on insolation.

Curious George
Reply to  Gabro
July 11, 2017 11:30 am

Link, please.

Gabro
Reply to  Gabro
July 11, 2017 1:40 pm
Gabro
Reply to  Gabro
July 11, 2017 1:46 pm

My initial reply contained too many links, so is in moderation. Maybe these to the East Asian monsoon will be few enough to pass prompt muster:
Robust Response of the East Asian Monsoon Rainband to Solar Variability
http://journals.ametsoc.org/doi/full/10.1175/JCLI-D-13-00482.1
https://www.researchgate.net/publication/256146174_Solar_Cycle_Signature_in_Decadal_Variability_of_Monsoon_Precipitation_in_China
It’s ludicrous to imagine that the solar cycle and solar activity in general have no effect on terrestrial weather and climate.

Gabro
Reply to  Gabro
July 11, 2017 2:26 pm

SST and air pressure:
Relationships between solar activity and variations in SST and atmospheric circulation in the stratosphere and troposphere
http://www.sciencedirect.com/science/article/pii/S104061821501143X
The influence of solar activity on action centres of atmospheric
circulation in North Atlantic
http://www.ann-geophys.net/33/207/2015/angeo-33-207-2015.pdf

observa
Reply to  Gabro
July 12, 2017 9:04 am

“Link please”
Is this a trick question? Umm..night and day.

Curious George
Reply to  Gabro
July 12, 2017 10:42 am

Gabro, thank you for the links provided. I looked only at two articles; sorry, the don’t look good. The NCAR news release finds “that, as the Sun’s output reaches a peak, the small amount of extra sunshine over several years causes a slight increase in local atmospheric heating.” They find it in models. The Hiremath article analyzes Indian monsoon rainfall data, totally unconvincingly to me. There is a strong evidence for so-called 11 year solar cycle. If there is a correlation with a climatic phenomenon, I would expect to find the same cycle in that phenomenon. Show me. I see plenty of words and graphs, but nothing relevant.

Gabro
Reply to  Gabro
July 12, 2017 1:14 pm

CG,
Just what evidence would you find convincing? I’m guessing none, since it’s clear you’re a True Believer for whom scientific evidence doesn’t matter, only blind faith in your cult.
Solar activity, cosmic rays, and Earth’s temperature: A millennium-scale comparison
http://onlinelibrary.wiley.com/doi/10.1029/2004JA010946/pdf

Curious George
Reply to  Gabro
July 12, 2017 1:30 pm

An evidence of a 11- or 21-year periodicity in a climate phenomenon would be convincing.

Gabro
Reply to  Gabro
July 12, 2017 1:40 pm

CG,
Climate requires a minimum of 30 years, so what would be required with respect to the solar cycle is evidence of a climatic effect from the long-term variations in the ~11-year solar cycles.
And there is ample evidence of this, for the Gleissberg and other cycles.
THE SOLAR WOLF-GLEISSBERG CYCLE AND ITS INFLUENCE ON THE EARTH
Shahinaz M. Yousef
http://www.virtualacademia.com/pdf/cli267_293.pdf
Dr. Easterbrook, who comments here often, could enlighten you as the even longer-term, periodic solar cycle fluctuations.
https://wattsupwiththat.com/2011/06/17/easterbrook-on-the-potential-demise-of-sunspots/

afonzarelli
Reply to  Gabro
July 12, 2017 3:37 pm

http://www.drroyspencer.com/wp-content/uploads/TSI-est-of-climate-sensitivity2.gif
Curious, this is from one of dr roy’s posts: detrended, smoothed three years to round out enso, with early 90s pinatubo cooling removed. Graphs like this one should be all over the web. (one wonders why they are not)…

Reply to  afonzarelli
July 12, 2017 4:27 pm

Graphs like this one should be all over the web. (one wonders why they are not)…
Because it is well-known that the solar cycle variation of the temperature is of the order of 0.1K. Just like it is not necessary to remind people all the time that the Earth is round.

afonzarelli
Reply to  Gabro
July 12, 2017 4:51 pm

No, it is not well known. People are constantly saying that the 11 year cycle is not represented in the temperature data. If more (and better) graphs than this one were available, then the misinformation would be stopped in its tracks. As it is, folks keep going over the same old ground. i feel very fortunate to have stumbled across this one. One can eyeball graphs like the one weber has and see it, but it’s much better to have something definitive like this to put it all to rest. Besides, i’d like to see other graphs like this done. Particularly removing el ninos altogether, just to see what the numbers come to. In this graph of spencers, two of the minimums during the period in question have large el ninos. It would be nice to see how the numbers shake out without them. We can NEVER have enough data…

Reply to  afonzarelli
July 12, 2017 4:54 pm

People are constantly saying that the 11 year cycle is not represented in the temperature data
People who don’t know what they are talking about [and there are so many of those] may say so constantly, but every atmospheric scientist worth her salt knows this. I [e.g.] have preached that for decades. It is trivially true.

Dr. S. Jeevananda Reddy
Reply to  Gabro
July 12, 2017 5:23 pm

Cycles in Rainfall
Rainfall data is critical for arriving at a reasonable conclusion. Different groups use different averages to present relative variations that affect the conclusions drawn from such series.
Though India receives around 78% of the annual rainfall during the southwest monsoon season [June to September], they are highly variable over different parts of the country. (late) Dr. B. Parthasarathy [a close friend of mine] compiled rainfall data sets [monthly, seasonal and annual] for 32 sub-divisions [India was divided into 32 met sub-divisions]. He sent me a copy of the published booklet containing this data in 1995. “Using this data series” I analyzed for possible cyclic nature for all-India southwest monsoon and Andhra Pradesh [comprising three met-subdivisions] which receives rainfall not only in southwest monsoon but also during northeast monsoon [October to December] and cyclonic activity in Bay of Bengal. I presented these results in my book “Andhra Pradesh Agriculture: Scenario of the last four decades” [2000].
All-India Southwest Monsoon Rainfall presented a clear cut 60-year cycle – by simply plotting 10-year averages. Here, one must keep in mind that different groups used different data series to represent all-India Southwest Monsoon rainfall series and thus averages differ. Also, as the data presents a cyclic pattern, any truncated data may present biased average based on which part (s) of the cycle the data represents.
I tried to correlate this cycle to global average temperature anomaly. Later somebody published the 60-year cycle superposed on trend [1880 to 2010] – this I presented in my 2008 book “Climate Change: Myths & Realities”.
The annual rainfall data series of Mahalapye in Botswana presented 60-year cycle with sub-multiple of 30-, 20- & 10- years [published in 1981]. Durban annual rainfall in South Africa presented 66-year cycle with sub-multiple of 22 years [published in 1984]. Eretria [in Ethiopia – now separate country] presented 22 year cycle in annual rainfall [1993 book].
In the case of Andhra Pradesh, southwest monsoon rainfall data series presented a 56-year cycle. Though northeast monsoon data series also presented 56-year cycle, but in opposite phase. The cyclonic activity in Bay of Bengal followed the northeast monsoon pattern. Catuane in Mozambique presented 54 year cycle with sub-multiple of 18 years [published in 1984].
I collected dates of onset of southwest monsoon over Kerala Coast [starting point of monsoon] and studied and this data presented 52 year cycle [published in 1977]. Fortaleza precipitation in Brazil presented 52 year cycle with sub-multiples of 26, 13 & 6.5 years [published in 1984].
All these suggest that the cycles show a systematic trend with latitude. General circulation patterns change them or overlapping of two cycle zones also present different pattern.
Astrological significance
See few inferences from my paper “Rainfall prediction for agriculture: past, present and future” – Proc. International Conference “Agricultural Heritage of Asia”, Asian Agri-History Foundation, 2004, pp:147-154:
The science of Astrology started with the understanding seasons and weather in relation to movements of extra-terrestrial bodies, known as planets. All, or most, cultures have developed a form of astrology such as Indian Astrology, Western Astrology, Chinese Astrology, Mexican Astrology, Celtic Astrology, etc. The Western Astrology is solar-based, the Chinese Astrology is lunar based, and the Indian Astrology is luni-solar based.
A lot of the ancient lore lost it s glory with industrialization, as the family tradition in astrology lost its shine. When we look into these studies in terms of weather prognostication, two important aspects emerge: the onset of rains and the total seasonal rains. The former is linked to the wind direction before the onset of rains and the later is linked to the phases of the Moon and Nakshatras (constellations) and this is integrated with the movement of other planets in terms of cycles. The recurring changes in the position of the Sun during the day – events on the Sun – the periodic waxing and waning of the Moon, the regular appearance and disappearance of the planets, all unmistakably projected a cycle of events that were gradually woven into the socio-religious fabric.
I observed a clear relationship between the onset of the monsoon over the Kerala Coast and the zonal component of wind at 50 mb level over Singapore, an equatorial station in the month of May. If the winds are westerly then the monsoon is early; if the winds are easterly, the monsoon is late.
The Chinese Astrology has a 60-year cycle, based on a combination of five elements and twelve animal signs. The current 60-year cycle began in 1984/85. In Indian Astrology [current starting year is 1987/88], the calendar system claimed to have been revealed is the same as or similar to what is called the 60-year cycle – the cycle of the Sun (6-years) and the Moon (10 years), i.e., 6 of 10 years, or the cycle of Jupiter – a cycle of five 12 years, similar to the Chinese 60-year cycle. The Indus Valley Civilization, which was before the Vedic period , used the 60-year cycle. The Aztecs noted that 5 Venus years equal to 8 Sun years. These cycles only repeated after 65 Sun and 104 Venus years, i.e., once in 520 years. The number 104 is the longest period in Mexican time keeping, and was called one “old age”. The Mexican Century was 52 years. Around this zone even the rainfall presents a cycle of this nature – Fortaleza in Brazil.
Southern Oscillation [ENSO]
1880-2006 – 126 years data of southwest monsoon rainfall: number of years
D BN N AN S Total
El Nino 7 5 5 0 1 18
Normal 14 13 37 14 6 84
La Nina 0 0 7 7 10 24
Total 21 18 49 21 17 126
D = deficit, BN = below normal, N = normal, AN = above normal and E = excess
However global solar radiation presents sunspot cycle and its multiples.
Dr. S. Jeevananda Reddy

afonzarelli
Reply to  Gabro
July 12, 2017 6:43 pm

Sure, that goes without saying, but i’d think that would be true for any number of things that the general public wouldn’t readily know. We’ve got graphs for just about EVERYTHING. Why not that?

afonzarelli
Reply to  Gabro
July 12, 2017 7:23 pm

(my comment is in response to you, dr svalgaard… dr reddy’s comment wasn’t there when i posted my comment. his must have been held up in moderation)

Reply to  afonzarelli
July 12, 2017 7:28 pm

You can avoid this, by always [as I, most of the time anyway] citing first the words you are objecting to.

george e. smith
Reply to  Gabro
July 12, 2017 8:24 pm

So Curious George would find an 11 or 21 year cycle convincing.
So I venture he would be ecstatic to find agreement to say eight significant digits, between observed measurement, and theoretical derivation.
But one such theoretical derivation of the value of the fine structure constant (alpha) , was pure poppycock; and simply mucking around with numbers; with NO connection to the physical universe whatsoever. Yet it agreed with the best experimental value to about 30% of the standard deviation of that experimental value.
So be very careful what you believe just because it seems to fit.
G

afonzarelli
Reply to  Gabro
July 13, 2017 12:37 am

Yes, george, true, but at least it is there in the data (complete with the one year lag). Most folks don’t even get that far…

george e. smith
Reply to  Gabro
July 13, 2017 10:33 am

A very simple Black Body calculation suggests that the observed (measured) solar cycle variation in TSI could account for about 70 mK change in earth Temperature. My 4-H education suggests that’s the most it could cause.
So Dr. Leif is being generous when he says that anybody knows it’s about 0.1 deg. And I have to agree that anybody with a smattering of knowledge about thermal things would start with a table cloth BB calculation.
Leif has mentioned the magnitude many times here at WUWT, so no excuses for readers here.
And I would swear on a stack of Farmer’s Almanacs that Leif has even given the 70 mK number right here at WUWT himself, because I know that I first calculated it when I saw his post on it. I don’t check to corroborate; just to get a better understanding of why.
G

Reply to  george e. smith
July 13, 2017 11:52 am

george e. smith
I think you have a somewhat simplistic idea on what is happening here on earth
hints
1) we are protected here by the sun’s most harmful radiation/ particles, by our atmosphere. Hence my advice: don’t go to Mars…before you have created an atmosphere.
2) In its turn, the ozone, peroxides and N-oxides formed by these particles from the oxygen, nitrogen and water vapor, filter out certain UV radiation reaching the oceans…
3) If the solar magnetic field strengths varies, the amount of energy going into the oceans varies.
TSI is a red herring
You have to measure via / via to see what is really happening.

Reply to  henryp
July 13, 2017 12:03 pm

3) If the solar magnetic field strengths varies, the amount of energy going into the oceans varies.
TSI is a red herring

The sun’s magnetic field does not do anything as such, but its variations cause variations of TSI and hence of the amount of energy reaching the Earth to go into the oceans.

Reply to  lsvalgaard
July 13, 2017 12:10 pm

Thanks for your reaction, but please, do tell me where and how ON and IN earth TSI is measured, exactly?
[remember I am from the school that don’t trust the sat’s]

Reply to  henryp
July 13, 2017 12:22 pm

TSI is measured very accurately by several spacecraft orbiting within a million miles from the Earth’s surface. We can easily correct for the varying distances to get what actually hits the Earth.

Reply to  lsvalgaard
July 13, 2017 1:04 pm

Good heavens. You honestly believe that what happens a million miles on top of us is a fair representation of what happens with T right on top of my own head???
Get real.

Reply to  Henryp
July 13, 2017 1:18 pm

You honestly believe that what happens a million miles on top of us is a fair representation of what happens with T right on top of my own head
Indeed yes, as there is nothing to stop the energy flow to the top of the atmosphere [not your head which may need some examination…]. In fact, I believe that what happens 93 million miles away is a fair representation of the energy hitting the Earth.

Reply to  lsvalgaard
July 13, 2017 1:42 pm

I rather trust my own head, thx.

Reply to  Henryp
July 13, 2017 1:44 pm

There is such a thing as ‘learning’…

Reply to  lsvalgaard
July 13, 2017 1:53 pm

I have studied and learned the daily data of 54 weather stations. 27 for each hs. For the past 40 years.
Min. Max. Mean.
How many figures are that?
Not sure now. Is it me or is it you with a learning problem?

Reply to  Henryp
July 13, 2017 1:57 pm

But you don’t seem to have learned much. There is more in this world that 54 weather stations. For example, there is that big globe in the sky that gives us the heat that makes life possible. And which energy output we carefully measure and study.

Reply to  lsvalgaard
July 13, 2017 2:14 pm

It is the distribution of particles released that matters. Especially the fraction with a lot of energy which seem to get more when the solar polar fieldstrength drops. Total energy stays the same?
In my hay days they simply called TSI the solar constant.
Are you saying it is not constant anymore?
Anyway. What effect would you predict from the moving north pole?
See previous comment.

Reply to  Henryp
July 13, 2017 2:17 pm

It is the distribution of particles released that matters
Not at all.
Are you saying it is not constant anymore?
So you have not even learned that it actually varies a tiny bit.
What effect would you predict from the moving north pole?
None.

Gabro
Reply to  Tom Halla
July 11, 2017 10:36 am

Not just correlation of course, but many causation mechanisms are known as well.

Auto
Reply to  Gabro
July 11, 2017 2:55 pm

Gabro,
Thanks.
Amid all the uncertainty, we will soon be told that, actually, the science is settled.
Probably by a politician with a knife to grind.
And it is not pellucid whether we will warm or cool – let alone how much.
Myself, I don’t like hot weather – the ‘hot’ (27C/81F, but humid, and I have to commute . . . . .) spell in Southern England broke today; 20C/68F, and rain, thank goodness! – but gentle overall warming is to be preferred.
Many fewer deaths from (reduced) cold versus a very few more from the (increased) heat.
Will we get it?
‘Ah, there’s the rub!’
Auto

Gabro
Reply to  Gabro
July 11, 2017 2:58 pm

I don’t like either hot, as now, or cold, as past winter, but that’s what I get for living in a continental climate zone, with a temperature range from -35 to 118 degrees F. But so far this summer we haven’t yet hit 100 F. Close, though.
Which is why most winters I spend in South America.

Gabro
Reply to  Gabro
July 11, 2017 3:07 pm

ENSO is actually measured based upon relative air pressure, compared between Darwin, Australia and Tahiti. What causes the trade winds to weaken or even reverse at the onset of an El Nino is often described as “mysterious”.
My hypothesis is that the sun is responsible not only for the build up of warm water in the tropical WestPac, but also for the strength and weakness of the trades. My testable hypothesis would be a correlation between the time integral of the solar cycle and ENS oscillations. Also specifically UV flux and its effect on ozone. A volume of air is warmed by having more O3 in it, hence affecting air pressure, thence wind speed.

ferdberple
Reply to  Gabro
July 12, 2017 12:51 pm

the ‘hot’ (27C/81F, but humid, and I have to commute . . . . .)
==============
27C/81F is lethal without technology.
The human body generates about 150 watts internally to maintain body heat. At temperatures around 27.5C/82F and below, the naked human body begins to radiate more than 150 watts, leading to death by exposure.

Jeanparisot
Reply to  Tom Halla
July 11, 2017 6:03 pm

That’s with or without the thumbs on the scales?

Tom Halla
Reply to  Jeanparisot
July 11, 2017 6:19 pm

Jeanparisot, I am judging temperature trends since 1979 by UAH, which seems to vary with El Ninos, but generally flat since 1998. That covers parts of two cycles, and temperature has not been declining with the solar cycles.

Merchant
July 11, 2017 10:20 am

So, it should be cold now, and for quite some time.

tony mcleod
Reply to  Merchant
July 11, 2017 4:05 pm

Not only that, it should have been cooling since 2014. Lo and behold – the opposite has happened according to every soruce I am able to access.
This is zombie junk form a junk peddler.
From a link in the post:
“These seemed to confirm his belief: when the sun has spots, the weather tends to be wetter and rainier.”
This is what David appears base all his climate ideas on. It’s the ‘belief’ of someone called Meton who aparently live in ancient Greece. WTF!
The whole thrust of this post and every other that I have read from this bloke is based on a massive “if”.
“If events of the next year or so prove Ed Fix’s model to be correct, then it will be as significant as the results of any of the expeditions to observe solar phenomena over the last three centuries”.
Or some variation of: if this happens then I’ll be proven right afterall.
If my autie was a man she’d be my uncle.
I guess Archibald actually belives this stuff – he has been peddling it for years and he is not alone. It’s time a few more of the sensible viewers on this site stopped letting him get away with it and not just leaving up to Leif as captain zombie-slayer.

afonzarelli
Reply to  tony mcleod
July 11, 2017 5:59 pm

Tony, svalgaard doesn’t even believe that the oceans are warming. OHC increasing? Nah. Sea level rise of 1.1mm/year due to thermal expansion? Nope. How can you have any faith in a guy like that?

James Allison
Reply to  tony mcleod
July 11, 2017 6:24 pm

tony – try using both spell and grammar check ‘if’ you ‘beileve’ it ‘could’ help with your credibility, or some variation of it.

tony mcleod
Reply to  tony mcleod
July 11, 2017 7:21 pm

I haven’t seen him nailing those positions to the mast (not saying he hasn’t), but you have to admit he is tireless in slaying what I agree with him is a TSI zombie.

afonzarelli
Reply to  tony mcleod
July 11, 2017 9:11 pm

Tony, problem is that if he did believe that the ocean is warming, then he would also believe in feedbacks relating to a warming ocean. As he does not, his analysis then is flawed…

tony mcleod
Reply to  tony mcleod
July 12, 2017 1:32 am

afonzarelli, his analysis may have flaws but I thinks his flaying of these solarists is entirely justified. The variations in TSI are so minute, in the order of 0.001%, they are not going to show up in years or even decades. Massive gas pulses that rapidly alter atmospheric thermal properties on the other hand do – but that conflicts with the bias.

Reply to  tony mcleod
July 12, 2017 4:19 am

“Or some variation of: if this happens then I’ll be proven right afterall.”
Wherein Tony McPlod following years in the trackless wilderness of total unfalsifiability discovers what a testable hypothesis is. Bravo! Congratulations Tony.

MarkW
Reply to  tony mcleod
July 12, 2017 6:44 am

Once again, McClod tries to pretend that the recent El Nino never happened so that he can attribute all of it’s warming to CO2.
Regardless, McClod also wants to pretend that there is no such thing as thermal mass.
As always, the warmists ignore physics.

tony mcleod
Reply to  tony mcleod
July 12, 2017 7:20 am

So cephus0 you’re in the hokes camp? What: socialists? Chinese? Rich Gore types? Sneaky scientists?
Who’s the problem? Or is it the massive 0.001% delta TSI that’s causing the ice to halve in volume in 30 years?comment image

MarkW
Reply to  tony mcleod
July 12, 2017 8:46 am

Measured from the highest point in the last couple hundred years, arctic sea ice levels have dropped.
Ho hum.
Of course the loss of arctic sea ice is a massive negative feedback that results in lots of extra heat being lost to space. But who cares, we’ve got people to scare and money to rip off.

Reply to  tony mcleod
July 12, 2017 8:52 am

Tony,

The variations in TSI are so minute, in the order of 0.001%, they are not going to show up in years or even decades.

That’s a “non-sequitur.” You are assuming climatic changes due to solar variability must be due to variations in TSI. Science is exploring other possibilities that you have chosen to ignore, like changes in stratospheric pressure, temperatures, and/or ozone content and distribution.
Building your own TSI strawmen to shoot down is also a fallacy. Your approach to solar variability effect on climate is tainted with bias.

Reply to  tony mcleod
July 12, 2017 9:22 am

Tony,

Or is it the massive 0.001% delta TSI that’s causing the ice to halve in volume in 30 years?

That graph is not real ice, but modelled ice. Real Arctic sea ice is doing this:comment image
As this article explains:
https://wattsupwiththat.com/2016/10/07/evidence-that-multidecadal-arctic-sea-ice-has-turned-the-corner/
The past behavior of Arctic sea ice has been explained in several articles and it is linked to the AMO.

Reply to  Javier
July 12, 2017 9:43 am

Javier
100%

Michael darby
Reply to  tony mcleod
July 12, 2017 9:37 am

Excellent cherry you picked there Javier. Note in a longer term plot of September Arctic sea ice how 2007 is a low point relative to years before and after.. Try starting in 2006 or 2005 and see how your trend line changes!!!
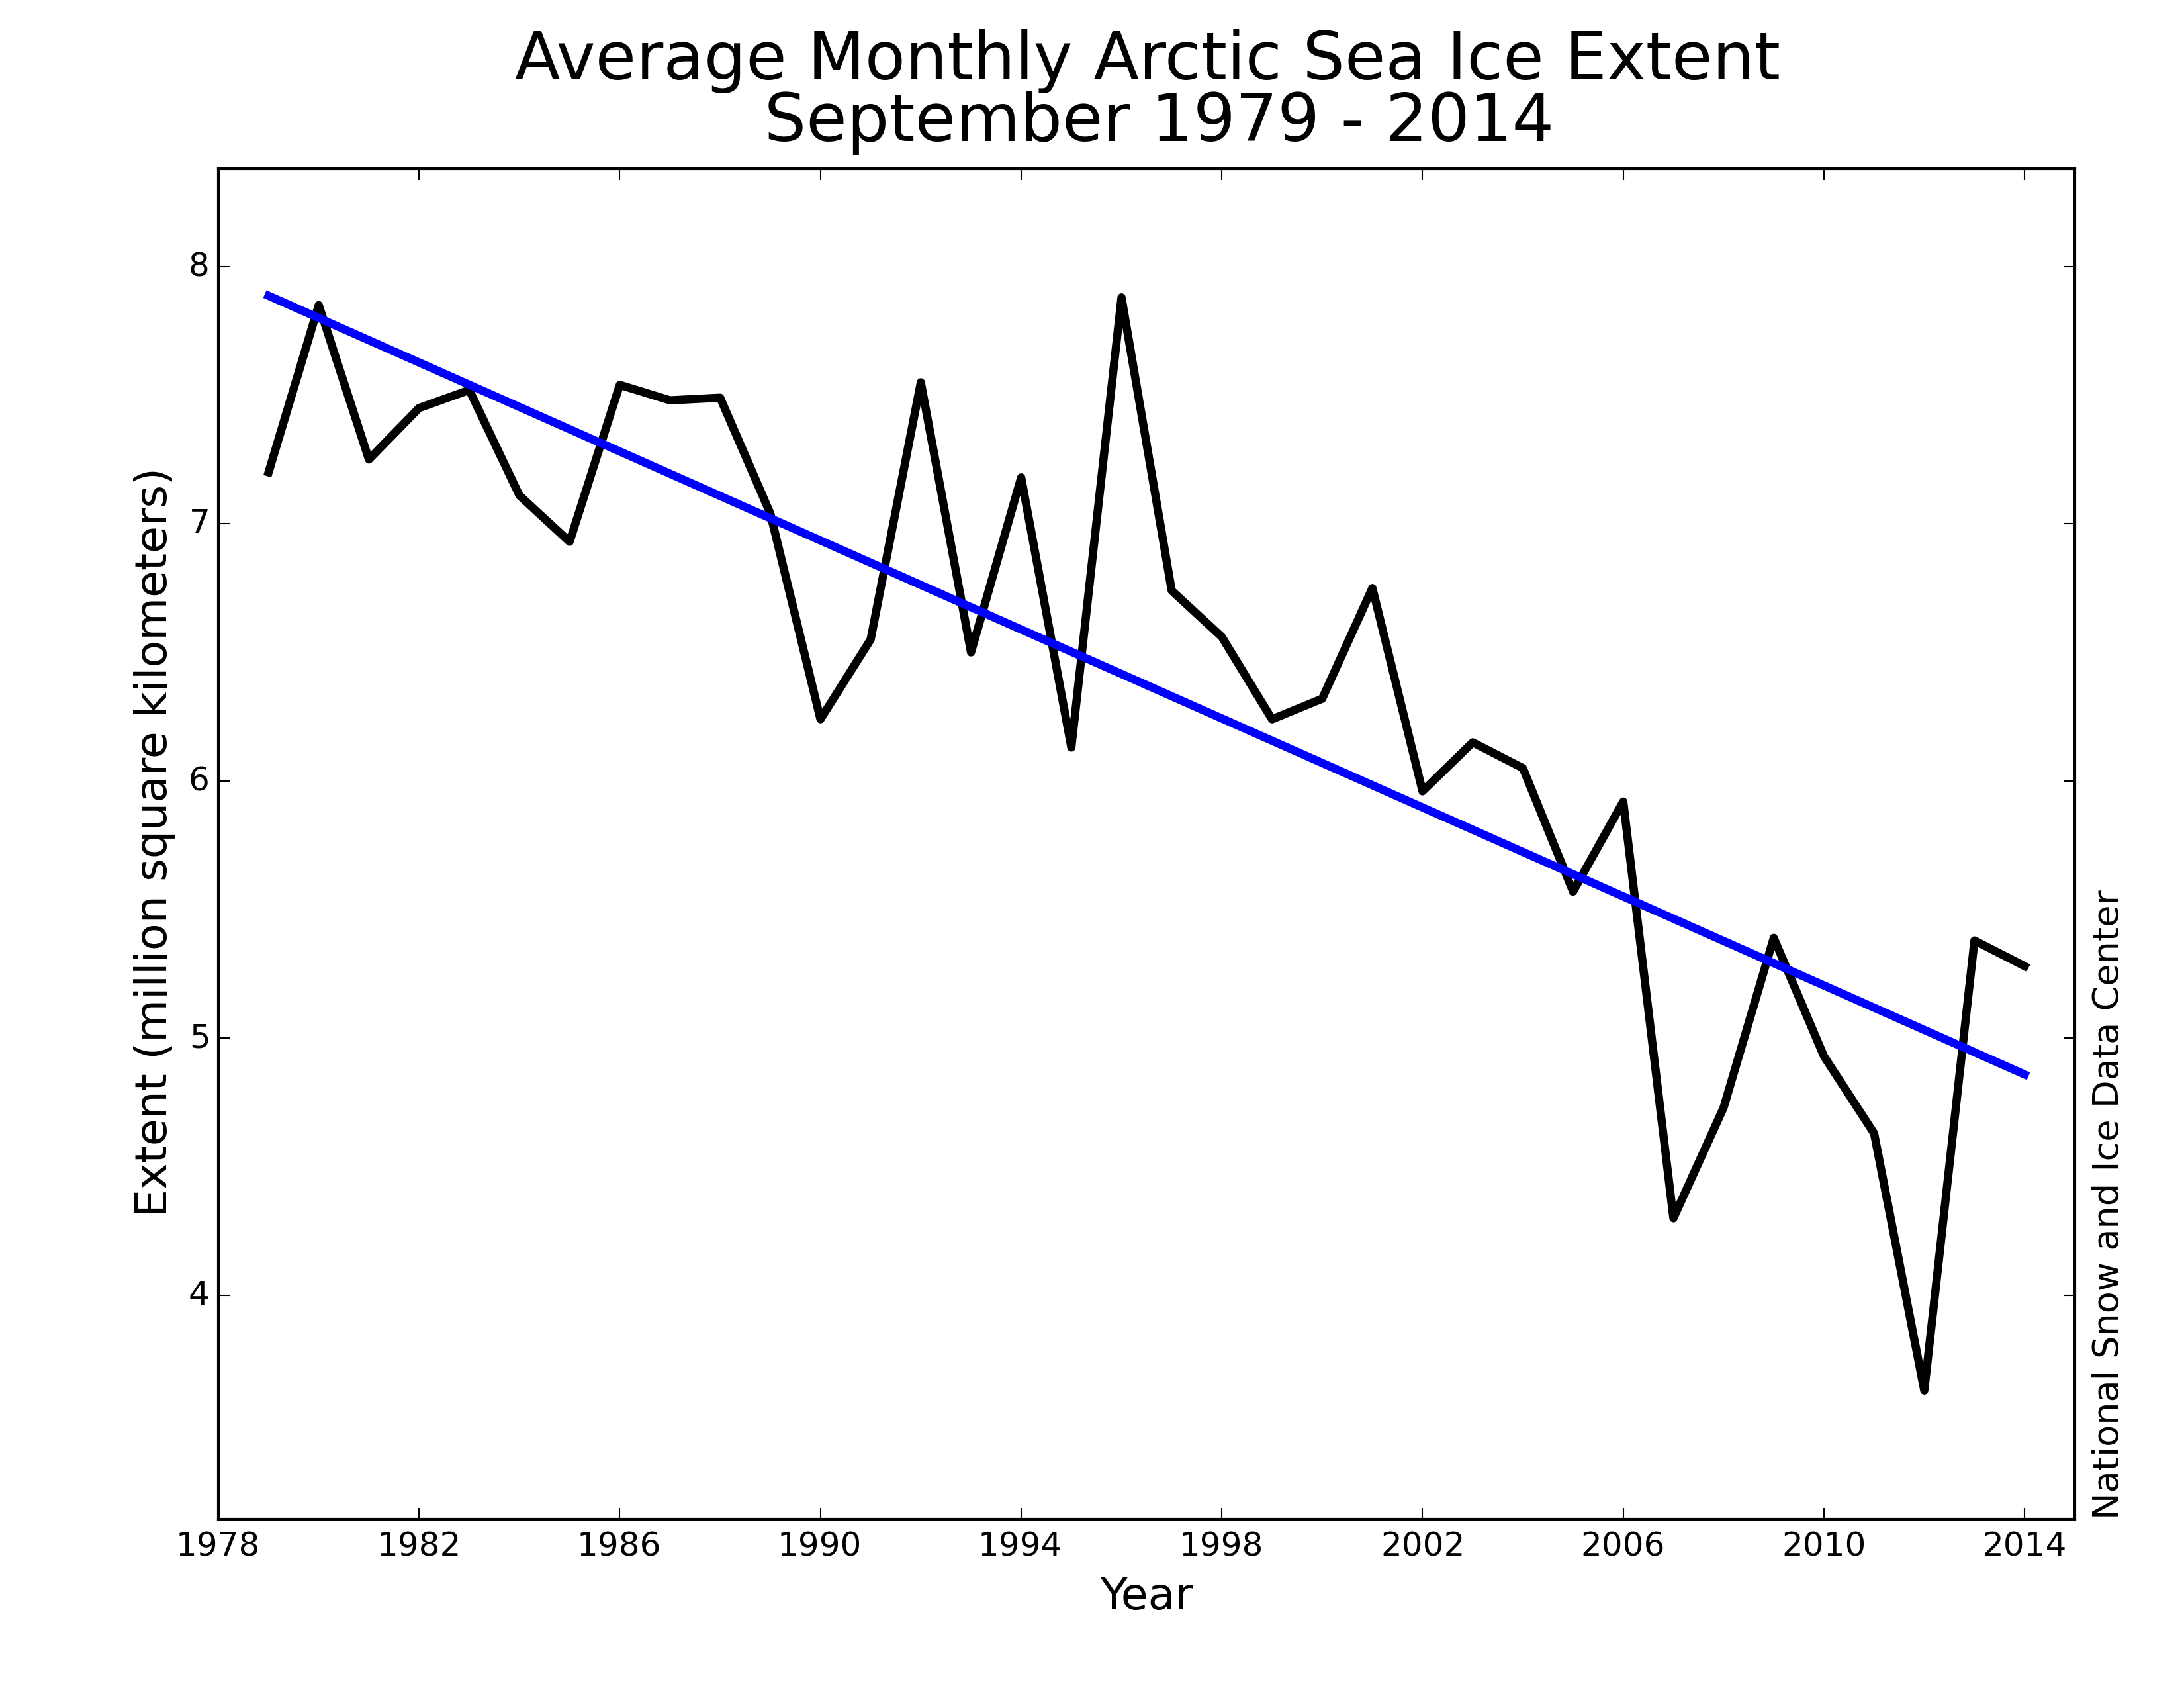
..comment image

Reply to  tony mcleod
July 12, 2017 9:56 am

Michael,

Excellent cherry you picked there Javier.

Still more September Arctic sea ice than 10 years ago. Do you have an explanation for that? Because I have three scientific articles that say that it is due to AMO. And all three predict this Arctic non-melting is going to continue for quite a few more years.
Arctic alarmism is taking a serious beating.

Michael darby
Reply to  tony mcleod
July 12, 2017 10:15 am

Your graphic is misleading.

If you go here: http://nsidc.org/arcticseaicenews/charctic-interactive-sea-ice-graph/

1) Then add in 2007, you’ll note that currently we are at exactly the same level today as in 2007.
2) You have to wait two more months before you can say: “Still more September Arctic sea ice than 10 years ago.”
3) How do you explain the long term trend since 1978?

Reply to  tony mcleod
July 12, 2017 10:36 am

Your graphic is misleading.

So you say, but it is clearly labelled and the source of the data indicated.

you’ll note that currently we are at exactly the same level today as in 2007.

Do not move the goal posts. We were told the Arctic was to become ice-free in the summer. The minimum month is September. The extent on July 12, or May 26 is not relevant if the minimum doesn’t go down.

You have to wait two more months before you can say: “Still more September Arctic sea ice than 10 years ago.

I am equally happy with 9 years until then.

How do you explain the long term trend since 1978?

Explaining is not a problem. I can think of several different explanations. Demonstrating is the problem.
It is clearly not CO2 since these cycles existed when CO2 was much lower.
It is likely not temperatures, as we have had record temperatures for like 4-5 years since 2007, although temperatures might contribute.
That leaves the atmosphere or the ocean. I am more inclined to the second one as the main factor, since the AMO has been implicated.
Meanwhile here you have a graph of polar temperatures this year to mull over:
http://ocean.dmi.dk/arctic/plots/meanTarchive/meanT_2017.png
For over two months temperatures have been below the 1958-2002 average North of 80º. That’s correct, 1958-2002 average.

Michael darby
Reply to  tony mcleod
July 12, 2017 11:09 am

You are funny. First you say: “Do not move the goal posts.” Then you move the goal posts by saying: “We were told the Arctic was to become….” This is not a discussion about predictions, so leave them out. The extent on July 12, or May 26 is relevant if it sets a record low, being lower than any September low. Now, you know 9 years or 10 years doesn’t make a “trend”
….
Now you are claiming the AMO as the cause of the variation in your graph? Sorry, you can’t take a 9 or 10 year slice of data to illustrate a 60-80 year cycle. A 9 or 10 year graphic doesn’t “demonstrate” anything.
….
Lastly you posted a graphic of “temperatures”…. Did you look closely at what you posted? It says “ECMWF operational model” …That’s right, you’re posting MODEL output and claiming it’s real??????

Reply to  tony mcleod
July 12, 2017 11:50 am

The extent on July 12, or May 26 is relevant if it sets a record low, being lower than any September low.

Obviously it doesn’t. Every year September has the lowest extent.

Now, you know 9 years or 10 years doesn’t make a “trend”

Of course it does. It is a 9-year trend.

Now you are claiming the AMO as the cause of the variation in your graph?

I am not. Do you have a problem finding and reading bibliography in the link above? I’ll make it easier for you:
Miles et al., 2014
http://folk.uib.no/ngftf/CV/PDF_Furevik/miles_et_al_grl_2014.pdf
Wyatt & Curry, 2014
http://cdn.cnsnews.com/documents/Curry,%20Wyatt%20paper.pdf
Artun et al., 2017
https://www.nature.com/articles/ncomms15875
They are the ones claiming it.

Did you look closely at what you posted? It says “ECMWF operational model”

Do you have an idea of what ECMWF ERA is? That’s reanalysis which means real temperature data from surface stations and satellites is being assimilated every few hours. That is what produces weather forecasts every few hours and lives depend on them. An international effort from 34 countries. Much better than those silly adjusted databases that get changes every month.
That the Arctic is colder than in previous years during the melt season is a fact. Go look it up.

Michael darby
Reply to  tony mcleod
July 12, 2017 12:14 pm

A model is a model is a model is a model.

Sortta like this? comment image

I hope you understand what 2 standard deviations mean.
..
Oh, and 9 years out of 60 is not a “trend”

Michael darby
Reply to  tony mcleod
July 12, 2017 12:15 pm

PS : “That is what produces weather forecasts”
..
BINGO, models produce forecasts!!

Reply to  tony mcleod
July 12, 2017 12:33 pm

The Arctic is still not melting after 9 years, Michael. We were told less ice means less albedo, more irradiation, higher temperatures and less ice. We were told the Arctic was in a death spiral. We just went through the warmest years ever registered. The warmest years in centuries. The years with highest CO2 levels in hundreds of thousands. The Arctic didn’t melt further.
Do you have an explanation for that, Michael? Some bibliography that can explain it? Why did the Arctic melt more rapidly when it was colder, with less CO2 and had more ice, than now that is warmer, with more CO2 and has less ice?

Michael darby
Reply to  tony mcleod
July 12, 2017 12:39 pm

“The Arctic is still not melting after 9 years, Michael”……… you must be immune to data. I posted NSIDC graphic that shows a 40% decline over the course of 38 years. The long term trend says something completely different than your 9 year trend line. You do understand that long term trends are more significant that short term ones, right?

Reply to  tony mcleod
July 12, 2017 12:58 pm

The long term trend says something completely different than your 9 year trend line.

Trends change. Pauses and cooling periods happen. There was a very clear trend change in 1976 well recognized in several publications. If you have a linear understanding of climate and extrapolation is your only tool you won’t understand what is going on. Another change in trend has taken place but you are too blind to see it. Read those papers I linked. Their authors do recognize the recent change in trend.
You might need another 20 years to see the change in trend. Others can see it already and are reporting it in scientific publications. By the time you accept a change in trend has taken place a new one might be underway.

ferdberple
Reply to  tony mcleod
July 12, 2017 1:16 pm

Ed Fix’s model
========
it makes a whole lot more sense to publish the model now rather than later. publishing a prediction after the fact cannot be trusted as proof of anything.
as to the prediction of the current cycle ending this year, that would certainly qualify as an “unexpected” result, which is one of the criteria for acceptance of a new theory.
Now it could be said that publishing unproven predictions is a waste of time and money, which argues strongly that the billions of dollars spent on climate models is wasted.
At least in the case of Ed Fix’s model, the jury is still out. In the case of climate models, they predicted accelerated warming. What actually happened is that the rate of warming accelerated in the opposite direction to what was predicted and we got “The Pause”.
Having failed to predict climate, climate science has responded by adjusting the historical climate records to better match the models. Even RSS appears to have gotten into the act, adjusting the satellite data to match a model.

Reply to  ferdberple
July 12, 2017 1:18 pm

True

Gabro
Reply to  tony mcleod
July 12, 2017 1:20 pm

tony mcleod July 12, 2017 at 7:20 am
Except Arctic sea ice won’t be gone in September. Its extent then will depend upon whether there are cyclones in August, as in other lower than usual ice years. Minimal sea ice this year should be between the 2012 low and 2009 high of the past decade, ie 2007-16.
Do you promise never to comment here again when you’re shown ludicrously wrong, yet again, as always?
See you in September, then buh-bye!

Michael darby
Reply to  tony mcleod
July 12, 2017 1:36 pm

“There was a very clear trend change in 1976 well recognized in several publications.” There was? You mean they spliced the satellite data with some other kind of data? Wasn’t that what Marcott did?

“You might need another 20 years to see the change in trend.” But but but but…your graphic was 9-years?????

Gabro
Reply to  tony mcleod
July 12, 2017 1:43 pm

Michael,
The pre-1979 satellite data aren’t spliced. They are satellite observations, which started in the 1960s, before there was a dedicated sea ice satellite. They show that 1979 was the highest sea ice year since the 1960s and probably for the past century.

Michael darby
Reply to  tony mcleod
July 12, 2017 2:12 pm

Gabro, the SMMR was not flown until 1978, so yes, anything prior to that date would be a “splice.”

Michael darby
Reply to  tony mcleod
July 12, 2017 2:24 pm

For example Gabro: comment image

With the following posted with the graphic: “Mean sea ice anomalies, 1953-2012: Sea ice extent departures from monthly means for the Northern Hemisphere. For January 1953 through December 1979, data have been obtained from the UK Hadley Centre and are based on operational ice charts and other sources. For January 1979 through December 2012, data are derived from passive microwave (SMMR / SSM/I).
….
SPLICE !!!!!

Michael darby
Reply to  tony mcleod
July 12, 2017 2:38 pm

Here ya go Gabro, read this: http://nsidc.org/data/g10010

Gabro
Reply to  tony mcleod
July 12, 2017 2:39 pm

It is satellite observations “spliced” onto satellite observations, which is not remotely like “splicing” tricky tree ring “data” onto cooked book thermometer “data”.

Michael darby
Reply to  tony mcleod
July 12, 2017 2:54 pm

Gabro incorrectly says: “It is satellite observations ‘spliced’ onto satellite observations”

Check out “Table 1” for data sources: http://onlinelibrary.wiley.com/doi/10.1111/j.1931-0846.2016.12195.x/full

tony mcleod
Reply to  tony mcleod
July 12, 2017 5:44 pm

Javier, typing: “Real Arctic sea ice is doing this” and then posting a cherry-picked time period that reveals your bias is either disingenuous or incredibly gullible.
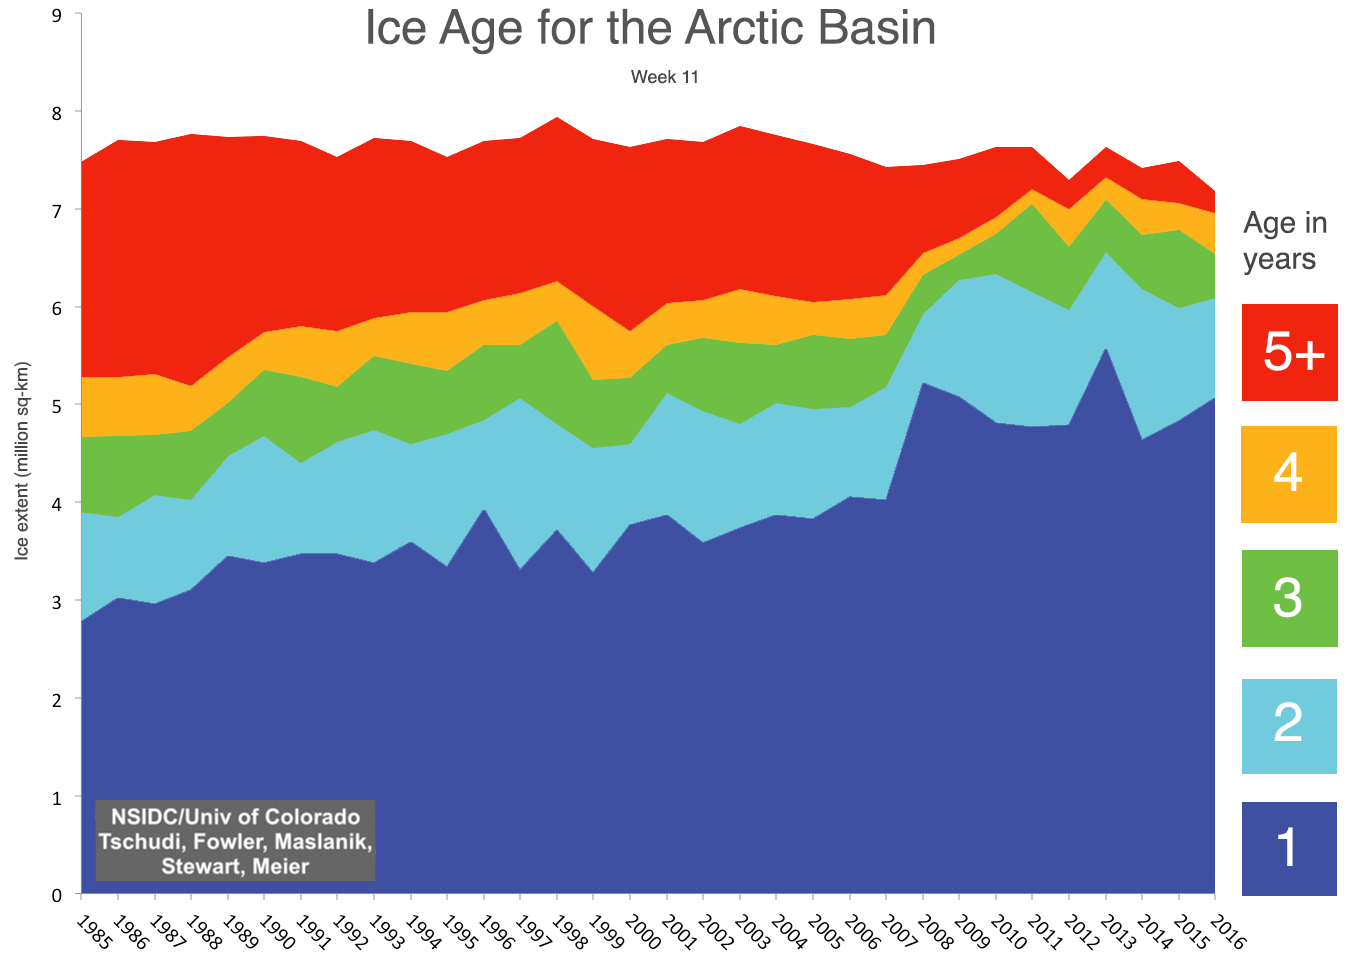
Are you really trying to argue that the Arctic sea-ice is not in steep and rapid decline?comment image?w=1200
Extent and area are useful metrics but volume, although more difficult to calculate, is far more revealing.
As far as multi-year ice goes:comment image
There is no yoga position you can twist yourself into that is going to make those graphs appear to head north.
Is the AMO having some effect? Quite possibly, but sheesh…

tony mcleod
Reply to  Merchant
July 11, 2017 6:34 pm

Point taken.

Curious George
Reply to  tony mcleod
July 12, 2017 10:50 am

Ah, models. Trump surrounds himself with models, but they don’t model Arctic ice.

Robert from oz
Reply to  tony mcleod
July 16, 2017 1:23 am

Thanks for the graph Tony , I had no idea that the arctic only had sea ice since 1985 !
We are definitely doomed , I can see 1000 feet of sea rise in a few short years at that pace .

tony mcleod
Reply to  Merchant
July 12, 2017 7:10 am

That’s point taken James.

Robert from oz
Reply to  tony mcleod
July 16, 2017 1:24 am

Oops my bad , since the 1980s.

July 11, 2017 10:43 am

Hmm, as per figure 6, the model presented anticipates SC25 slightly more active than SC24, and SC26/SC27 > SC24/SC25.
It is unclear where the monster solar minimum approaching prediction comes from. Ed Fix’s model predicts activity going up, not down.

Gabro
Reply to  Javier
July 11, 2017 11:01 am

It appears that David refers only to the minimum for this cycle, not a grand minimum. Ed does indeed forecast increasing activity for the next three cycles.

Ted
Reply to  Gabro
July 11, 2017 12:13 pm

The monster minimum would be a standard length cycle, with the low section starting now and continuing for a few years. Ed Fix’s model is an alternative, the ‘short cycle’ in the title of the post. The strength of the coming cycles is irrelevant to those choices, but would be relevant to evaluating the Fix model.
As a side note, Ed Fix’s model doesn’t show 25 and 26 to be more active than 24 has been, it predecticted SC24 to be even weaker than it actually was. The cycles aren’t predicted to be stronger than observations for 24 until SC27.

Greg
Reply to  Javier
July 11, 2017 12:39 pm

The implication was that the Solar Cycle 24/25 minimum was either going to be very deep and prolonged, or that Solar Cycle 24 would be very short

a very short cycle being the opposite on deep and long it looks like this is saying today will either hot or cold. Take your pick but keep your options open !

rbabcock
July 11, 2017 10:57 am

Personally I think the solar cycle has a big effect but the oceans buffer it so much, the actual impact is hard to determine.

LT
Reply to  rbabcock
July 11, 2017 11:50 am

I am writing software to take the binary RSS dataset of the lower stratosphere and break it into a month vs latitude graph. And then use a deconvolution algorithm to remove the annual cycle from each latitude band. Then generate a frequency spectrum for each latitude band to see if the 11 year cycle shows up in the remaining data at any latitudes, if it does then a case could be made that solar variability has in fact been detected in the climate system. The point is, that the Stratosphere should be somewhat decoupled from the buffering of Earth’s oceans. Stay tuned…

Reply to  LT
July 11, 2017 12:32 pm

yes
the data always follow the sun…
and the sun makes no sense unless you look at it long term, and even very long term
some of us – Javier and others know –
http://oi65.tinypic.com/2u8axl5.jpg

Greg
Reply to  LT
July 11, 2017 12:55 pm

Interesting initiative LT. Some comments on the method.
Why deconvolution. All deconvolution methods introduce distortions, this seems like unnecessary degradation. Why not low-pass filter?
Use daily data if possible , monthly averages are improper resampling without using an anti-alias filter. This just muddies and corrupts the data. I don’t know whether RSS give daily data but UAH does. Suggest using UAH.
If this daily data is too big for your frequency analysis to run in a convenitent time. Do a low-pass filter at say 54 days and then resample at 27 day intervals ( proper anti-alias ). I suggest 27d because this is the solar equatorial rotation. You may try some other periods like 732d filter and 365 resampling.
Try doing your frequency analysis without filtering. The annual will be large but may not drown out the rest. Suck and see.
Please don’t use running means ( which is in effect what monthly averages do ). This distorts the data in horrible ways and does not correctly deal with any periodic components in the data. ( eg 27 solar cycle, 27 and 29d lunar cycles , which you should at least assume may be present.
See this article about running means and find links to a number of options for well-behaved LP filters with code provided. You should be able to adapt to whatever language you use.
https://climategrog.wordpress.com/2013/05/19/triple-running-mean-filters/
hope that helps. Keep us posted on what you find. Even if it is nothing. A rigorous nothing is a powerful result. 😉

Greg
Reply to  LT
July 11, 2017 1:02 pm

before I get shouted down : monthly average is the same as running mean followed by a monthly resampling. Thus it is a distorting filter which is only half of the length required to properly anti-alias the data.
Climatology is hugely into monthly means which would only be valid if you can be sure that all variation below 60 days is totally random. It is pretty certain the both lunar and solar periods shorter than 30/31 days could be present making monthly averages totally bad for the job.
Here’s why you want to avoid runny means as a filter.comment image

Reply to  LT
July 11, 2017 1:31 pm

If you look for the magnetic 21.5 year periodicity you will find it without any difficulty. It is there in both land and ocean surface temperatures.
http://www.vukcevic.talktalk.net/5Spectra.gif

Reply to  vukcevic
July 11, 2017 1:57 pm

21.5 is the correct solar cycle.
Hale and Nicholson understood this. Schwabe is the half cycle. Gleisberg is 86.5 years.
DeVries is 210. Beyond that… who knows??

crackers345
Reply to  LT
July 11, 2017 2:18 pm

henryp, that is the most mindless
fit i have ever witnessed.

Reply to  crackers345
July 11, 2017 2:45 pm

True. I was hoping there for more than o.5 correlation.
Must overlay with solar parameter. I m sure you will see a fit then. That was my point.

LT
Reply to  LT
July 11, 2017 2:31 pm

Greg,
The annual cycle has +/- 90 watt deviation (because of earths 1 million mile elliptical orbit) and we are looking for a difference of just a couple of watts over two decades in a 2 solar cycles, so there is a process we use in seismic processing called predictive deconvolution used for removing echoes in the subsurface. So this process uses only the first N-Samples of the autocorrelation of the signal to compute the prediction filter, and convolves the prediction filter with the time series to get the predictable portion, and then subtracts it from the original signal. This is a more robust process than simply convolving the inverse filter with the time series. But it needs the toeplitz matrix to properly partition the energy, so it is not a very common process among most industries, but in the seismic business, we truly have some of the most advanced signal processing algorithms available.

Jeff in Calgary
Reply to  rbabcock
July 11, 2017 12:17 pm

rbabcock, I think you are a genius. Any effect is going to be a slow gradual nudge in one direction or the other. It likely would require a prolonged solar quiet period to have any noticeable effect. But once the effect was noticeable, it would have a ton of momentum and would result in dramatic changes.

chadb
Reply to  rbabcock
July 11, 2017 12:23 pm

Agreed. If ocean mixing gives a 30 year filter with a 15 year lag then it really doesn’t matter if there is an 11 year cycle – what matters is the long term trend. It would be interesting to see correlation coefficients between the temperature trend vs. average sunspot number for varying time constants (correlation 1 year, 5 year, 10 year etc).

Greg
Reply to  chadb
July 11, 2017 1:19 pm

The cross-correlation function does that for ALL lags. An example for Tahiti looks like this :comment image
https://climategrog.wordpress.com/tahiti_ssn_slpmatsst_cc/

Greg
Reply to  chadb
July 11, 2017 1:24 pm

It should be noted that the correlation is very small, meaning that only a very small amount of the variation matches SSN.

Greg
Reply to  chadb
July 11, 2017 1:26 pm

PS. Since this is daily data, and the annual component of earth variables will not correlate with SSN, this graph does not suffice to say SSN is negligible. As some have suggested in the past.

Greg
Reply to  chadb
July 11, 2017 1:29 pm

Apologies, that was based on monthly data, not daily as stated above. Sloppy work not properly labelling the x axis.

LT
Reply to  rbabcock
July 11, 2017 5:47 pm

Greg,
Is it possible to get daily data from the satellite record? I would think it would take days of orbits to get a single global sampling.

July 11, 2017 10:59 am

It looks like that spike is driven by just the last month of data. I would like to see at least 6 more months of data before getting too excited about what might happen next

RWturner
July 11, 2017 11:24 am

Most predictions show solar cycle 25 to be relatively normal but cycle 26 will be extremely quiet.

crackers345
Reply to  RWturner
July 11, 2017 2:17 pm

where can i read
these predictions?

erastvandoren
July 11, 2017 11:31 am

How is this a surprise? Zharkova-model predicted this minimum. And much larger minimum from the mid-20s.

Reply to  erastvandoren
July 11, 2017 12:30 pm

The surprise would be that she is actually correct.

Dena
July 11, 2017 11:50 am

The Fix model seems to be at least a good deal of the picture however what would be interesting to see is the model running back to the early 1600’s. Sun spot records go back nearly that far but I suspect the model might have difficulty dealing with events like the little ice age. If there is a mismatch at that point, there is a second factor that needs to be considered.

Ed Fix
Reply to  Dena
July 11, 2017 6:52 pm

Dena, the model I played around with a few years ago is a simple resonant spring equation excited by the changes in the sun’s chaotic orbit about the barycenter of the solar system. It was only ever meant to be a proof of concept exploration of whether some resonant process could be excited by a the sun’s orbit to produce something like the sunspot cycle. Really nothing more.
When I saw David’s post about a possibly shortened cycle, my immediate thought was, “Oh no, he’s not going to mention my model again, is he?” I was kinda hoping to just watch the sunspot cycle for a few more months. If it seems to start an uptick in the next year or so, I could pop up and say, “see, I predicted that”, and if not, just stay quiet. Oh, well.
The model is a dynamic simulation, and each step is determined only by the current state of the oscillator and an input force derived from the sun’s orbit; specifically the radial acceleration of the sun relative to the barycenter.
Clearly, whatever’s going on in the sun is much more complex than a simple damped spring, so there is no possibility that the model could mimic the sunspot cycle long term. Whatever happened during the Maunder Minimum to disrupt the sunspot cycle is absolutely not in this model, so no, it doesn’t replicate the Maunder Minimum.
Incidentally, the model can’t be “run back” to the 17th century. It’s a dynamic model (with cause and effect) and can only run forward. However, I can start it in the 16th century and run it forward, and that’s how I confirmed it does not replicate the Maunder Minimum.
To set the spring, force, damping, and mass constants for the spring equation, I started with the sunspot cycle around 1750, starting from a known maximum, and adjusted the constants to produce something like the real sunspot cycle. I use a version of the Hale cycle, treating half the familiar sunspot cycles as the “negative” half of a sinusoid. Briefly, I did that because the sunspots of alternating cycles have reversed magnetic fields, so the familiar 11 year cycle seemed to me to be a rectified (absolute value) sinusoid. I just added a sign.
I have already had two predictions validated. After I set the parameters so the model produced a sunspot cycle-like output starting from a known initial condition, I set the starting point in the year 1500 with the initial conditions all set to 0. When the simulation got to 1750, it’s phase and amplitude closely match the real thing. That, I reasoned, couldn’t happen unless I had the parameters of the forcing function essentially correct.
In mid 2008, the modeling effort had progressed to the point that I predicted that if the sunspot number stayed very low through 2008, it would not start increasing again until the beginning of 2010. In fact, it started picking up in Dec. 2009. Close enough.
The model shows something very peculiar (unprecedented in the record) going on with the transition from cycle 24 to 25. I’m waiting to see if something like that happens.
Because it’s based on such a simple oscillatory process, I have no faith in the model’s ability to predict anything long term, and would be ecstatic if it predicts anything over the next cycle or so. The odd transition it seems to predict from cycle 24 to 25 seems to be a great test.

richard verney
Reply to  Ed Fix
July 12, 2017 2:21 am

Thanks for that insight; the insider view.

Samuel C Cogar
Reply to  Ed Fix
July 12, 2017 5:51 am

Ed Fix July 11, 2017 at 6:52 pm

Because it’s based on such a simple oscillatory process, I have no faith in the model’s ability to predict anything long term,

Now Mr. Ed, best you reconsider the above, simply because it is a well-known fact that there are numerous “simple oscillatory processes” than can, do and/or will result in dramatic changes or results, ,,,,,, intended or otherwise.
The loss of a counter-weight on an automobile tire or a “balance” wheel will create a simple oscillatory process that will continue to deteriorate if not corrected. And don’t forget about Galloping Gertie, the 1940 Tacoma Narrows Bridge — https://en.wikipedia.org/wiki/Tacoma_Narrows_Bridge_(1940)
And remember, “The term vibration is precisely used to describe mechanical oscillation.
And Ed, there is another naturally occurring “simple oscillatory process” that is, IMLO, directly responsible for the bi-yearly cycling of an average 6 ppm in/of atmospheric CO2 quantities, as well as the dramatic changes that occur in opposite phases in the Northern and Southern Hemispheres, ……. and that “oscillatory process” is commonly referred to as the changing of the “seasons”, …….. aka: spring and fall equinoxes, …… that occurs when the Sun’s zenith passes over the earth’s equator on September 23rd and March 21st.
Failure to see or recognize the dramatic effects of said “simple oscillatory processes” is akin to those persons who “can’t see the forest because of all the trees”.
Sam C

Ed Fix
Reply to  Ed Fix
July 12, 2017 6:26 am

Good morning, Sam
What I meant by that “simple oscillatory process” statement is that the model is a one-dimensional model that mimics a three-dimensional process, and it has no provision for nonlinearity, or threshold effects. Therefore, its predictive ability is bound to be weak, at best.
The spring model I used is really just a place-holder to test the premise that some oscillatory process, forced/excited by changes in the sun’s chaotic orbit about the solar system barycenter, could produce something like the sunspot cycle.

Butch2
July 11, 2017 11:53 am

Hate to nit pick, but…..
“He was inspired to created the model” ….Create ? ( no d ?)

Sam Hall
Reply to  Butch2
July 11, 2017 1:49 pm

Hate to nit pick, but…..
Then don’t

stan stendera
Reply to  Butch2
July 11, 2017 5:55 pm

+100

jai mitchell
July 11, 2017 12:21 pm

Should start cooling any minute now. . .
http://www.huffingtonpost.ca/lawrence-solomon/global-cooling_b_4413833.html
circa 2013) (three record warm years ago)

Dr Deanster
Reply to  jai mitchell
July 12, 2017 6:51 am

And a huge El Niño. cant really tell what you are implying, but leaving out the fact that at least two of those so called record warm years were due to a big El Niño. Don’t know that co2 played any role at all.

A C Osborn
Reply to  Dr Deanster
July 12, 2017 7:14 am

And they weren’t anywhere near “Record Breaking” either for the Thermometer records, not when they have cooled the 1997/98 temperatures by 2.9 degrees C.

July 11, 2017 12:22 pm

Clearly
minimum is imminent
within a year from now.
http://services.swpc.noaa.gov/images/solar-cycle-sunspot-number.gif

Tucker
Reply to  henryp
July 11, 2017 12:28 pm

When I look at that graph, I can see minimum in three years, not one. Current smoothed sunspot value is roughly equal to early 2006 and minimum occurred in 2009.

Reply to  Tucker
July 11, 2017 12:45 pm

e.g looking at ssn 25
the decline from a year ago is much steeper than the decline from 2006 toward that mininmum ?
hint
look at the rate of decline

Greg
Reply to  Tucker
July 11, 2017 1:10 pm

HP: Hint if slope is much steep we are farther from the minimum. I’m with Tucker. more like 3 than 1.

Reply to  Greg
July 11, 2017 1:22 pm

Greg
Compare the current rate of decline with those of previous cycles.

Ted
Reply to  Tucker
July 12, 2017 2:12 am

Henry, I think it deals with exactly where you’re looking. The smoothed average did drop faster during 2005 than during the portion of 2016 for which it is shown, supporting your contention. But from November 2005 to Feb 2006 there was a sharp decline which is unlikely to be seen once the smoothed average is filled in for the corresponding months of 2016-2017.
The past few months the number has been hovering just above ten, about the same as eleven years ago in 2006. At the beginning of 2016, the smoothed average is near 35, eleven years ago it was about 35.
Start of 2015, between 50 and 55, 2004, between 50 and 55. I believe these are the figures that Tucker and Greg are referring to.

MarkW
Reply to  Tucker
July 12, 2017 6:54 am

Just looking at the last 6 months and comparing it to the trend line, it looks like the trend line is going to level out for awhile.

joe
July 11, 2017 12:31 pm

At the end of SC23, the “97%” consensus was that SC24 would be similar to SC22 and 21, but a few “deniers” said SC24 would be weak. So who were the non-conformists and what are they predicting for SC25?
The (C-AGW) Klimate Khange people call us deniers who refuse to admit that CC is anthropogenic. The Sun does not change and hence cannot be the cause of climate variations.
So then many of us here are double deniers, both CC deniers and solar in-variable deniers!

stan stendera
Reply to  joe
July 11, 2017 5:57 pm

I would be proud to be included in the double denier cohort!!!

ren
July 11, 2017 1:25 pm

During winter and during periods of low solar activity, ionizing radiation in the lower atmosphere rises.
http://sol.spacenvironment.net/raps_ops/current_files/rtimg/table.png

July 11, 2017 1:25 pm

Some explanation needed for Fig. 6 in the blog. The green graph is called a historic sunspot graph. Sunspot number cannot be negative and it looks like it has passed the minimum. This conflicts with the graphs of real sunspot number of henryp above. Is the original graph available somewhere?

Ed Fix
Reply to  aveollila
July 11, 2017 7:02 pm

Gladly.
https://www.mediafire.com/folder/4x54o0ju31v9m/Solar_Simulation
The PDF is a paper published in 2010, and the zip file is all my spreadsheets. Caution: BIG spreadsheets.
The sunspot cycle I used is akin to the Hale cycle. In each successive 11-year cycle the magnetic polarity of the sunspots is reversed (mostly) from the previous cycle. I represented the reversed polarity as a negative number in the graphed sunspot numbers.

Gabro
Reply to  ren
July 11, 2017 1:42 pm

As would be expected.

Reply to  Gabro
July 11, 2017 2:00 pm

No. Why?

Reply to  Henryp
July 11, 2017 2:09 pm

Consider solar polar fieldstrength rather than ssn as a function of release of more or less energetic particles that form ozone, peroxide and N oxides TOA

Gabro
Reply to  Gabro
July 11, 2017 2:13 pm

Because the highest energy UVC makes and breaks ozone. UVB does to a lesser extent, but some of it penetrates farther into the air, so that its effect can be felt in the troposphere. The vast majority of UV reaching the surface is UVA.

July 11, 2017 1:53 pm

My comment disappeared down WP black hole, i’ll take liberty and repost.
There is not much new here.
As it happens Dr. Svalgaard and some of us were discussing forthcoming solar downturn some 8 or 9 years ago, at the time when the NASA’s top man was predicting opposite.
BTW, as long ago as 2003, I completed paper on exactly what we are observing currently and may indeed occur in next decade or two.
The NASA’s man said impossible. A Nobel prize Astrophysicist, the JPL solar expert and another solar theoretical physicist all reserved their judgement until the SC24 peaks.
So what was the result ?
I called it an ‘incredible coincidence’, the SC24 peaked within a decimal point of what the equation calculates (details are here )

DWR54
July 11, 2017 2:02 pm

Re fig 1: it’s pretty clear that solar cycle 24 (SC24) has seen a lot less total solar irradiance (TSI) from the sun reaching the earth than in the previous 2 solar cycles.
Despite this, the period covering SC24 has been by far the warmest continuous period since instruments began measuring temperatures on earth or in its atmosphere.
It’s pretty clear then that TSI isn’t the dominant influence on surface temperatures that David Archibald seems to believe it is.
Something else is, but what?

Reply to  DWR54
July 11, 2017 2:05 pm

Who is guarding the guards? It is already cooling since ca. 2000
Says I

DWR54
Reply to  Henryp
July 11, 2017 2:18 pm

Henryp

Who is guarding the guards? It is already cooling since ca. 2000 Says I

You’re entitled to your opinion and to your say of course Henry; but every global temperature data set we have, whether surface or satellite, says different.
Even UAH, the coolest of the global temperature data sets and a measure of the lower troposphere rather than the surface in fact, shows warming at a rate of 0.11 C per decade since 2000. In RSS, which measures the same thing as UAH, the warming reported since 2000 is 0.17 C per decade.
Just saying that there has been ‘no warming since 2000’ is okay as an opinion, but it doesn’t actually stack up with the facts, which some people are sticklers for.

Reply to  DWR54
July 11, 2017 2:37 pm

In science. Trust no one but yourself. Have you checked out T min in your own backyard over the past 20 years? What does it tell you?

Gabro
Reply to  Henryp
July 11, 2017 2:23 pm

Actually the statement does stack up to observations, upon which it’s based.
There was no warming between the two super El Ninos of 1999 and 2016. If any so-called “data set” shows some, then it’s totally “Mann-made”, not anthropogenic.

DWR54
Reply to  Henryp
July 11, 2017 2:51 pm

Henryp

Have you checked out T min in your own backyard over the past 20 years? What does it tell you?

I have done so intermittently Henry; however I am keenly aware that my own back yard is not representative of the globe.
Gabro

There was no warming between the two super El Ninos of 1999 and 2016. If any so-called “data set” shows some, then it’s totally “Mann-made”, not anthropogenic.

How do you know there was “no warming” between 1999 and 2016 if you don’t trust any data set? There’s no way you can say that definitively if you don’t trust any of the global data sets, whether surface or satellite.

Gabro
Reply to  Henryp
July 11, 2017 2:54 pm

I didn’t say I didn’t trust any data set, only those which show bogus warming.
Those which show cooling or no statistically significant warming, I trust.
You seem to have misinterpreted my comment.

DWR54
Reply to  Henryp
July 11, 2017 4:41 pm

Gabro

I didn’t say I didn’t trust any data set, only those which show bogus warming.

We’ve already confirmed that all global temperature data sets show warming since 2000.

Those which show cooling or no statistically significant warming, I trust.

There aren’t any. Your bar is a temperature data set that shows no warming or else cooling since 2000 even though no such a temperature data set exists.

You seem to have misinterpreted my comment.

Heh.

Reply to  Henryp
July 11, 2017 5:14 pm

Those which show cooling or no statistically significant warming, I trust.

That is called data selection and considered a serious bias.

tony mcleod
Reply to  Henryp
July 11, 2017 5:48 pm

Gabro July 11, 2017 at 2:54 pm
Those which show cooling or no statistically significant warming, I trust.
What’s the difference between that and this:
Those that confirm my bias, I trust?

stan stendera
Reply to  Henryp
July 11, 2017 6:00 pm

+100

Ktm
Reply to  Henryp
July 12, 2017 12:49 am

USCRN shows cooling since its inception. Current anomalies are below the nClimDiv anomalies from ca. 2000.
So, the question about your own backyard thermometer is well posed, especially for those of us who live in the United states.

A C Osborn
Reply to  Henryp
July 12, 2017 7:36 am

DWR54 July 11, 2017 at 2:18 pm “You’re entitled to your opinion and to your say of course Henry; but every global temperature data set we have, whether surface or satellite, says different. ”
Which of course is not really true.
All of the Raw Ground (Thermometer) datasebases show cooling, as I said above, the final NOAA set 1997/98 final temp has been reduced by 2.9C since 1998/99.
The Satellites are not measuring the same thing at all as they are measuring the heat leaving the Surface via the Atmosphere (ie cooling), which is not what we experience.
You only have to look at the last few months where NH cold temp records have been broken all over the place and yet the Satellites show the SH Anomaly as colder.
This sort of descrepancy has been apparent for years.

Gabro
Reply to  Henryp
July 12, 2017 1:23 pm

Javier July 11, 2017 at 5:14 pm
No bias at all. Simply rejecting alleged “data” invented in violation of the scientific method, in favor of actual data, it observations.

DWR54
Reply to  DWR54
July 11, 2017 2:06 pm

That should be: “It’s pretty clear then that TSI isn’t the dominant influence on [the observed changes to] surface temperatures that David Archibald seems to believe it is.”
________________
The sun is of course the main contributor to earth’s surface temperature. Sorry.

crackers345
Reply to  DWR54
July 11, 2017 2:14 pm

but not to changes in it.

Gabro
Reply to  DWR54
July 11, 2017 2:29 pm

Crackers,
Changes in solar activity do indeed influence surface and air temperature. Dramatically.
CO2, not so much.

DWR54
Reply to  DWR54
July 11, 2017 2:35 pm

Agreed. The changes to TSI, during solar cycle 24, which consist of a small reduction in the amount of solar energy received from the sun on earth compared to previous recent cycles, have had no cooling impact whatsoever on observed global surface and atmospheric temperatures.
Contrary to David Archibald’s past predictions, there has not been a reduction in temperatures as a result of this decreased solar irradiance, indeed, the exact opposite has occurred. Temperatures in the surface and lower troposphere data sets have reached record new warm extremes during solar cycle 24; whereas Archibald was predicting a slide into a new ice age!
So something is badly wrong with the solar models David Archibald has been working with this past decade. Even he must see that. So what are his explanations for the clear failures of his previous predictions? Alas, we are never told.

Bill Illis
Reply to  DWR54
July 11, 2017 5:13 pm

TSI is still in 1361.75 W/m2 range. The last solar minimum was down to 1361.6 W/m2 for a good 1 and a half years so we are still not down the lowest TSI number which is the one measure which impacts the climate more than any other. It is several Orders of magnitude higher energy higher than all the other measures shown in this post. And it is TOTAL solar irradiance so it is the total solar energy received.
http://lasp.colorado.edu/data/sorce/total_solar_irradiance_plots/images/tim_level3_tsi_24hour_3month_640x480.png

Bill Illis
Reply to  DWR54
July 11, 2017 5:16 pm

Sorry image doesn’t update to the current values which is here.comment image

adrian smits
Reply to  DWR54
July 11, 2017 6:30 pm

Oviously there is far more involved with the solar cycles than TSI

Dr Deanster
Reply to  DWR54
July 12, 2017 7:04 am

dWR54 …… bajesus ….. why oh why do people keep saying “warmest eva ” in the context of forcing while omitting the impact of the El Niño? R ya just so biased that you can’t say it?
I personally don’t think we r capable of accurately calculating the “global temperature” …. but it doesn’t matter because “global” is meaningless. However, this assertion that the last three years have been the warmest eva without defending the El Niño is just plain disingenuous !

Gabro
Reply to  DWR54
July 11, 2017 2:19 pm

TSI is important but so is its spectral composition.
There is a lag in solar effect on climate, since the key is the time integral of solar output. It takes a while for the climate system to get rid of heat from higher solar activity.
But the effect of lower solar power in the current cycle indeed has been felt and is reflected in stagnant to falling temperatures. The 2016 super El Nino blew off a lot of heat, as did the 1999 super El Nino.
No surprise if the 20th century featured the warmest intervals (1930s and ’90s) in the instrument record, since that record began during the Maunder Minimum in the depths of the Little Ice Age.

Michael Keal
Reply to  Gabro
July 12, 2017 1:40 pm

“TSI is important but so is its spectral composition.”
Gabro, I’ve had some thoughts on this and would value your comments on whether I’ve missed something or if I’m completely off track on this as I’m trying to improve my understanding.
My understanding is that when the Sun is active EUV is high and when it is quiet EUV is, relatively speaking, low. And yet there is not that much variance in TSI.
This seems to suggest that there might be an overall change in the spectral composition of the Sun between active and quiet resulting in a downward shift across the Solar spectrum.
Now EUV interacts with Oxygen and Nitrogen and if my understanding is correct the upper atmosphere is virtually opaque to it.
This would mean the fraction of the TSI’s heat energy entering different parts of the atmosphere would vary, according to the level of the Sun’s activity and might have a larger effect than might be expected from TSI variance alone.
So if the Sun is less active, as it is now, we might expect to see not only less energy imparted to the upper atmosphere but at the same time more energy getting through to the lower atmosphere.
If so this could result in higher air temperatures in the lower atmosphere and the surface of the oceans due to more energy being received there resulting in more active weather in spite of the lower TSI.
However, coupled with this, changes in the jet streams that occur when EUV is low would result in more heat being transported to the poles and would presumably offset any lower atmosphere and ocean heating resulting in the overall effect of cooling over time. (I’m saying this because that’s what we seem to be happening.)

Gabro
Reply to  Gabro
July 12, 2017 1:51 pm

Michael,
Since to some extent lower UV correlates with lower TSI, Dr. Svalgaard argues that spectral composition doesn’t matter. I’ve commented that it does, because the climatic effect of UV is qualitatively different from lower energy wavelengths in sunlight. And besides, UV fluctuates much more than does TSI.
The highest energy UV (UVC) is indeed 100% absorbed by the atmosphere, in which it makes and breaks ozone. The vast majority of UVB is also absorbed. The UVA which reaches the surface however is also climatically important because it penetrates seawater farther than visible and IR light.
Your hypotheses about the climatic and meteorological effects of differing spectral bands sound convincing to me, and should be subject to test.

Jeanparisot
Reply to  DWR54
July 11, 2017 6:19 pm

Bad measurements?

Reply to  DWR54
July 11, 2017 8:24 pm

Imo, the dominant influence of surface temps is the oceans. The Sun feeds the oceans, and the oceans are the main control know of the climate.

MarkW
Reply to  DWR54
July 12, 2017 6:56 am

Two confounding factors.
Thermal inertia and a super El Nino.

Richard Keen
July 11, 2017 2:09 pm

All this makes next month’s total solar eclipse all the more interesting – as if these eclipses can ever not be interesting!
Forty years ago Jack Eddy in his landmark paper on the Maunder Minimum noted lack of florid descriptions of the solar corona during eclipses in that period of the 1600s, concluding that there simply may not have been the lovely corona as we know it from recent eclipses. More about this on this comment I made to one of David’s earlier posts:
https://wattsupwiththat.com/2017/07/01/thus-it-begins/#comment-2539983
So if you eclipse chasers are disappointed in next month’s corona, you heard it first here.
But if, more likely, the corona is normally spectacular – and I think it will be, with the Grand Minimum a cycle or two away, maybe – you also heard that first here.
But don’t let it stop you from going to the eclipse!

Ed Fix
Reply to  Richard Keen
July 11, 2017 7:05 pm

I’ll certainly be there!

Richard Keen
Reply to  Ed Fix
July 11, 2017 8:10 pm

Ed, where?
I’m heading a few hours north to Glendo, Wyoming.
clear skies!

Ed Fix
Reply to  Ed Fix
July 11, 2017 8:20 pm

Richard, I’m thinking western Nebraska, but I’ll be checking the weather in the days leading up, and won’t decide exactly where until the day before or so.

Richard Keen
Reply to  Ed Fix
July 11, 2017 11:57 pm

I, and a dozen friends, will stay in Cheyenne the night before, to get a head start on the northward rush from Colorado on eclipse morning. We have passes for Glendo park, and will go there unless the morning’s weather says elsewhere – E to Nebraska or beyond Glendo to Casper.

Reply to  Ed Fix
July 12, 2017 6:40 am

Try to be in an area where there are birds. I have witnessed two total eclipses and on the both occasion there was a sudden cool breeze with a dawn chorus couple of minutes later.

crackers345
July 11, 2017 2:15 pm

what is the climate’s
sensitivity to changes in the
Lyman alpha index? dT/dLai?

jlurtz
July 11, 2017 3:01 pm

A relationship between the Solar Cycle and the Climate must be based on all cumulative Solar Energy reaching the Earth’s surface since year 1650. Year 1700 was the end of the Maunder Minimum. This is the beginning of the Earth’s Oceans warming. This is important since the Oceans store the heat from the Sun.
Now, the Solar Energy obviously comes from the Sun, but the radiation of the Earth’s stored energy [heat] leaves from the North and South Poles. This should be obvious, since the temperature difference between the Equator and the Poles is about 80 to 180 degrees Fahrenheit. Now the energy radiation control is indicated by the Ozone Layer. Ozone layer thick expands the upper atmosphere so much that NASA monitors it to help satellite operators, so they can move their satellites into a higher orbit.
A thicker atmosphere reduces energy flow to space. A thinner atmosphere allows energy flow to space.
The 10.7 Flux is a good indication of the amount of Ozone being formed: Lots of Flux, lots of Ozone; little Flux, little Ozone.
This is the smoking gun of Earth’s Climate control switch.
Presently, we have warm Oceans and low Flux [translates to cooler land]. As the Oceans give up stored heat, the Global temperature must decline!

Gabro
Reply to  jlurtz
July 11, 2017 3:09 pm

Please see my comments on ozone above. Thanks.

Gabro
Reply to  Gabro
July 11, 2017 3:13 pm

PS: Atomic weight of CO2 is 44, but of O3 48.

Gabro
Reply to  Gabro
July 11, 2017 3:20 pm

It is also not always appreciated how important O3 was in Earth’s first atmosphere. The young sun produced on the order of 10,000 times more UV than now, while the early atmosphere contained a lot or H2O. Hence, plenty of ozone was made.
Ozone is generally thought only to have become common in the air after the evolution of cyanobacteria, which release oxygen as a waste product of photosynthesis. But ozone abounded during the Hadean and Archean Eons as well, during the emergence of life on Earth.
So the climate of our planet has often, if not always, been influenced by ozone.

crackers345
Reply to  jlurtz
July 23, 2017 6:26 pm

sorry, but heat does not leave
the earth by just the N and S poles

Editor
July 11, 2017 3:20 pm

I don’t understand Figure 6. It appears as though Mr. Fix or Mr. Archibald think that the sun swaps magnetic polarity at the low point of the sunspot cycle. My understanding is that the swap takes place around the maximum of the sunspot cycle.
What am I missing here?
w.

David Archibald
Reply to  Willis Eschenbach
July 11, 2017 4:38 pm

My bad. The graph shows the solar cycle with every second cycle negative, equating to the oscillations of a spring.

AJB
Reply to  Willis Eschenbach
July 11, 2017 5:56 pm

IIRC, the y-axis units are ‘polarized sunspot number’. The model is barycentre based and does not address hysteretic magnetic cycle evolution.

Ed Fix
Reply to  Willis Eschenbach
July 11, 2017 7:08 pm

The magnetic polarity of the sunspots (actually sunspot pairs) swap at the sunspot minimum. The global magnetic field of the sun swaps around the maximum.

Reply to  Ed Fix
July 12, 2017 5:20 pm

Ed, that’s true … but what you’re counting is sunspot numbers, which vary with the global magnetic field of the sun. As you point out, this swaps around the maximum … but your graph shows it swapping at the minimum.
Best regards,
w.

Reply to  Willis Eschenbach
July 12, 2017 5:27 pm

some confusion here:
there really isn’t something called the ‘global magnetic field’ of the sun.
There is the ‘toroidal magnetic fields’ [east-west] which switch at minimum [sunspots] and ‘poloidal magnetic fields’ [north-south] which switch at maximum.

Ed Fix
Reply to  Ed Fix
July 12, 2017 7:31 pm

Dr. Svalgaard, thanks for the info and clarification.
Willis, individual sunspots, and east-west-oriented sunspot pairs, have their own local magnetic fields. The sunspot pairs of one cycle generally have the one polarity (eg. magnetic north to the east, and magnetic south to the west), and sunspot pairs of the next cycle generally have the opposite polarity.
So the answer to your question is that the (cycle to cycle) alternating local magnetic polarity of the sunspot pairs was the basis for the negative sign I assigned to alternating sunspot numbers. The choice of which polarity was positive and which negative was entirely arbitrary.
The origin of the term “Hale Cycle”, consisting of two 11 year (Schwabe) cycles came about because Dr. G. E. Hale first observed that sunspots have magnetic fields (paper published in 1908) and, during the next cycle that the magnetic polarity of the sunspot pairs was reversed (published 1919). Time and time again, during my literature search for my paper, I found people referring to the Hale cycle and citing the 1908 paper–published long before he had a chance to observe the polarity reversal in the cycle that began in 1912. Makes me wonder if the people citing huge lists of publications actually read any of them.

Reply to  Ed Fix
July 12, 2017 7:37 pm

It is best to always use the terms toroidal and poloidal fields that say precisely what they are.

Sid_Davis
July 11, 2017 4:13 pm

I am glad to see someone else coming at it a different way, and reaching the same conclusion about the length of the 24/25 trough that my time series analysis shows. I have identifies over 200 statistically significant cycles in the 1749 to present sunspot data set, with five of those being major oscillations in the 10 to 12 year range which make up what other people call the 11 year cycle. Those five alone would be a major finding if it can be confirmed by understanding of the physics of the sun that the 11 year cycle is not itself an actual stand alone single oscillation. By projecting these over 200 cycles into the future, the result shows that beginning in the summer of 2018 and lasting for 3.5 to 4 years, there will be virtually no sunspots. Again during the 25/26 trough the numbers will be low, mostly near zero, for a similarly unusually long time compared to historic averages.
For what it is worth, here is a screen shot of the graph of my amateur work, adding these oscillations together in visual form: The top section is continuous from 1749 to sometime past the end of this century. The bottom section is just a blowup of the latter part of the chart. The cycles identified are derived from the actual data, so of course they match fairly closely up until the present, which will only continue into the future if the work is reasonably good.

Sid_Davis
Reply to  Sid_Davis
July 11, 2017 4:17 pm

Well, the link to the image did not appear. See if this works.
http://i.imgur.com/h3f8ueT.png
If the link does not appear, you can go to it manually with “http://i.imgur.com/h3f8ueT.png”

AJB
Reply to  Sid_Davis
July 11, 2017 6:47 pm

Which sunspot series is this based on?

AJB
Reply to  Sid_Davis
July 11, 2017 7:05 pm

You might find this interesting: http://www.sidc.be/silso/spotless

Sid_Davis
Reply to  Sid_Davis
July 11, 2017 8:32 pm

The series is version 1.0 of the data collected, I believe originally by the Swiss. I acquired the data in pre-internet days from the Foundation for the Study of Cycles and kept it up from their update until it became readily available on the internet. Times have changed.
I also have done the calculations on version 2.0 after the revision of the early data (something of which I was suspicious) but the results are very close to the version 1.0 results.

July 11, 2017 4:27 pm

There is a 12 year +/- delay between the solar activity maximum at about1991 and the millennial temperature maximum at about 2003.
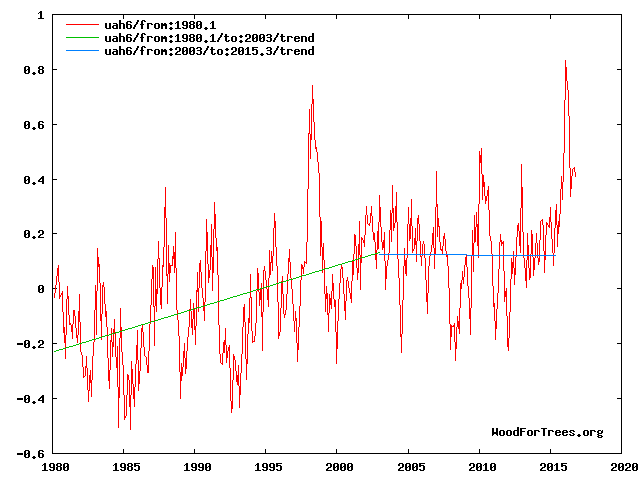
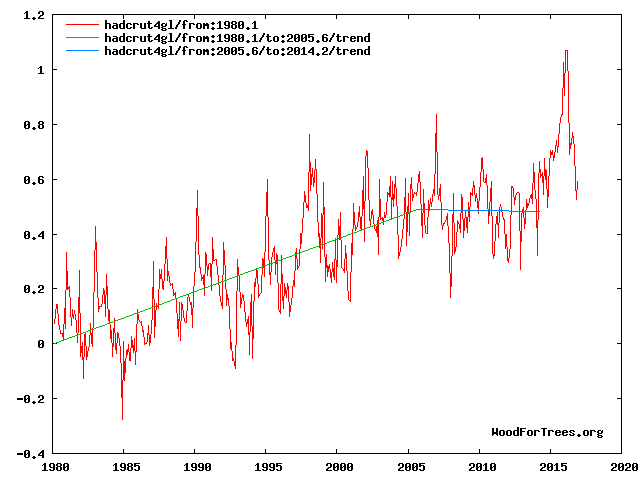
Climate is controlled by natural cycles. Earth is just past the 2003+/- peak of a millennial cycle and the current cooling trend will likely continue until the next Little Ice Age minimum at about 2650.See the Energy and Environment paper at http://journals.sagepub.com/doi/full/10.1177/0958305X16686488
and an earlier accessible blog version at http://climatesense-norpag.blogspot.com/2017/02/the-coming-cooling-usefully-accurate_17.html
Here is the abstract for convenience :
“ABSTRACT
This paper argues that the methods used by the establishment climate science community are not fit for purpose and that a new forecasting paradigm should be adopted. Earth’s climate is the result of resonances and beats between various quasi-cyclic processes of varying wavelengths. It is not possible to forecast the future unless we have a good understanding of where the earth is in time in relation to the current phases of those different interacting natural quasi periodicities. Evidence is presented specifying the timing and amplitude of the natural 60+/- year and, more importantly, 1,000 year periodicities (observed emergent behaviors) that are so obvious in the temperature record. Data related to the solar climate driver is discussed and the solar cycle 22 low in the neutron count (high solar activity) in 1991 is identified as a solar activity millennial peak and correlated with the millennial peak -inversion point – in the UAH6 temperature trend in about 2003. The cyclic trends are projected forward and predict a probable general temperature decline in the coming decades and centuries. Estimates of the timing and amplitude of the coming cooling are made. If the real climate outcomes follow a trend which approaches the near term forecasts of this working hypothesis, the divergence between the IPCC forecasts and those projected by this paper will be so large by 2021 as to make the current, supposedly actionable, level of confidence in the IPCC forecasts untenable.”
The current situation is seen in Figs 4 and 5 in the linked blogpost and paper.comment image
Fig 4.UAH6 trends showing the millennial cycle temperature peak at about 2003 (14)
Figure 4 illustrates the working hypothesis that for this UAH6 time series the peak of the Millennial cycle, a very important “golden spike”, can be designated at 2003.
The Hadcrut 4gl data trends are very similar to the UAH6 data trends with the millennial peak at 2005.3 in Fig. 5 (15).comment image
Fig. 5 Hadcrut 4gl trends showing the millennial cycle temperature peak at about 2005.6
The UAH cooling trend in Fig. 4 and the Hadcrut4gl cooling in Fig. 5 were truncated at 2015.3 and 2014.2, respectively, because it makes no sense to start or end the analysis of a time series in the middle of major ENSO events which create ephemeral deviations from the longer term trends. By the end of August 2016, the strong El Nino temperature anomaly had declined rapidly. The cooling trend is likely to be fully restored by the end of 2019.

Bruce of Newcastle
July 11, 2017 4:30 pm

Noteworthy that UV cratered during the Maunder. The following graph is from Shapiro et al 2011:comment image

Reply to  Bruce of Newcastle
July 11, 2017 4:51 pm

This Shapiro Figure fits well with my suggested millennial activity peak at 1991.comment image

Yogi Bear
July 11, 2017 4:32 pm

“The heliospheric current sheet tilt angle is 10° off the apparent floor of 3° but, based on the prior solar cycles, could still take a few years to get there.”
By which time it will be 2020, which is when Ed Fix says SC25 maximum will be, a mere six years after the maximum of SC24. Most unlikely.

July 11, 2017 5:58 pm

Hello Ed Fix
Like your model
Thanks
These cycles may contain a lot of uncertainty perhaps even in the form of non-linear dynamics known to exist in almost all natural phenomena.
https://papers.ssrn.com/sol3/papers.cfm?abstract_id=2767274

stan stendera
Reply to  chaamjamal
July 11, 2017 6:11 pm

+1000

Ed Fix
Reply to  chaamjamal
July 11, 2017 7:14 pm

Hello, Cha-am Jamal
Thanks for the shout. See replies further up for a link to the full paper and calculations, as well as a little more information and/or clarification to what David posted.

Carla
July 11, 2017 7:27 pm

This is really fluxed up.
We know that there was another flux that that went up to a “space age high” and never went back down again.
But whats up with this?comment image
And the current sheet, does it bobble bi-annually, whether it is on its way up, or on the way down?comment image
Talk about your wavy current sheet, wow.

Carla
July 11, 2017 7:44 pm

The Sun in transition? Persistence of near-surface structural changes through Cycle 24
R. Howe, G. R. Davies, W. J. Chaplin, Y. Elsworth, S. Basu, S. J. Hale, W. H. Ball, R. W. Komm
(Submitted on 25 May 2017)
Introduction
…Some activity indicators dropped to remarkably low values
during the Cycle 23/24 minimum (e.g. the geomagnetic aa-index
and the ISN). Solar wind turbulence, as captured by measures of
interplanetary scintillation, had been declining since the early part
of Cycle 23. There have been results suggesting a decline – from
the Cycle 23/24 boundary through the rise of Cycle 24 – in the average
strength of magnetic fields in sunspots (Livingston et al. 2012;
see also Watson et al. 2014) and others pointing to a change in
the size distribution of spots between Cycles 22 and 23 (e.g., see
Clette & Lef`evre 2012; de Toma et al. 2013).
Helioseismic studies of the internal solar dynamics showed
that the characteristics of the meridional flow altered between
Cycles 23 and 24 (Hathaway & Rightmire 2010). Changes to the
meridional flow have potential consequences for flux-transport dynamo
models. Differences have also been seen in the east-west
zonal flows (e.g., Howe et al. 2013) and in the frequency shifts
of globally coherent p modes, which have been weaker than in
preceding cycles (e.g., see Basu et al. 2012; Salabert et al. 2015;
Tripathy et al. 2015; Howe et al. 2015).
Upton & Hathaway (2014) have suggested that it was actually
a weak Cycle 23 that was responsible for the following, extended
minimum and weak Cycle 24. Jiang et al. (2015) have proposed
that observed weak polar magnetic fields, and as a result the weak
Cycle 24, may have resulted from the emergence of low-latitude
flux having the opposite polarity to that expected (which then hindered growth of the polar fields). Predictions for Cycle 25 are now
beginning to appear (e.g., see Pesnell 2016).
https://arxiv.org/pdf/1705.09099.pdf

Carla
July 11, 2017 7:46 pm

Musical Sun reduces range of magnetic activity
Last Updated on Tuesday, 04 July 2017 11:55
Published on Monday, 03 July 2017 23:01
“Recent activity maxima have actually been rather quiet and the last cycle had a long, extended minimum,” notes Elsworth. “It will be interesting to see if the minimum of this current cycle is extended in the manner of the previous one or if it will soon be back to the conditions of the past. However, if it is a normal minimum it will also be interesting to ask why the previous one was unusual.”
In work just published in the Monthly Notices of the Royal Astronomical Society, the team shows that the interior of the Sun has changed in recent years, and that these changes persist in the current cycle. In combination with theoretical models, the observations suggest that the magnetic field distribution in the outer layers may have become a bit thinner. Other seismic data shows that the rotation rate of the Sun has also undergone some changes in the way the Sun rotates at different latitudes.
“Again, this is not how it used to be and the rotation rate has slowed a bit at latitudes around about 60 degrees. We are not quite sure what the consequences of this will be but it’s clear that we are in unusual times. However, we are beginning to detect some features belonging to the next cycle and we can suggest that the next minimum will be in about two years,” says Elsworth.
http://www.ras.org.uk/news-and-press/3008-musical-sun-reduces-range-of-magnetic-activity

Carla
July 11, 2017 7:52 pm

The Sun in transition? Persistence of near-surface structural changes through Cycle 24
R. Howe, G. R. Davies, W. J. Chaplin, Y. Elsworth, S. Basu, S. J. Hale, W. H. Ball, R. W. Komm
(Submitted on 25 May 2017)
Discussion
It is tempting to speculate whether these results, and the multitude
of other unusual signatures relating to Cycle 24, might be
indicative of a longer-lasting transition in solar activity behaviour,
and the operation of the solar dynamo.
The existence of the Maunder Minimum, and other similar
minima suggested by proxy data relevant to millennal timescales,
indicate that there have likely been periods when the action of the
dynamo has been altered significantly. We finish by speculating
whether these events might presage a radical transition suggested
by data on other stars. Results on activity cycle periods shown by
other stars hint at a change in cycle behaviour – a possible transition
from one type of dynamo action to another – at a surface
rotation period of around 20 days (B¨ohm-Vitense 2007). There is
also more recent intriguing evidence from asteroseismic results on
solar-type stars (van Saders et al. 2016; Metcalfe et al. 2016) that
shows that the spin-down behaviour of cool stars changes markedly
once they reach a critical epoch, with the corresponding surface rotation period depending on stellar mass. For solar-mass stars, the results suggest a change in behaviour at about the solar age (and
solar rotation period).

https://arxiv.org/pdf/1705.09099.pdf

July 11, 2017 8:00 pm

You used to show Cycle 5. 24 is more like 4 than 5. Cold weather could come, I agree. But we have low statistical confidence on what 25 will bring.
I think we are in for a cool down (half) cycle. But the science of solar cycles is full of uncertainty. No worse than climate change science, but no better.

Carla
July 11, 2017 8:01 pm

SOLAR CYCLE VARIABILITY INDUCED BY TILT ANGLE SCATTER IN A BABCOCK–LEIGHTON SOLAR DYNAMO MODEL
BIDYA BINAY KARAK AND MARK MIESCH
https://arxiv.org/pdf/1706.08933.pdf
Draft version June 28, 2017
Abstract
We present results from a three-dimensional Babcock–Leighton dynamo model that is sustained by the explicit emergence and dispersal of bipolar magnetic regions (BMRs). On average, each BMR has a systematic tilt given by Joy’s law. Randomness and nonlinearity in the BMR emergence of our model produce variable magnetic cycles. However, when we allow for a random scatter in the tilt angle to mimic the observed departures from Joy’s law, we find more variability in the magnetic cycles. We find that the observed standard
deviation in Joy’s law of σδ = 15◦ produces a variability comparable to observed solar cycle variability of ∼
32%, as quantified by the sunspot number maxima between 1755–2008. We also find that tilt angle scatter can promote grand minima and grand maxima. The time spent in grand minima for σδ = 15◦
is somewhat less than that inferred for the Sun from cosmogenic isotopes (about 9% compared to 17%). However, when we double the tilt scatter to σδ = 30◦, the simulation statistics are comparable to the Sun (∼18% of the time in grand minima and ∼ 10% in grand maxima). Though the Babcock–Leighton mechanism is the only source of poloidal field, we find that our simulations always maintain magnetic cycles even at large fluctuations in the tilt angle. We also demonstrate that tilt quenching is a viable and efficient mechanism for dynamo saturation; a suppression of the tilt by only 1-2◦ is sufficient to limit the dynamo growth. Thus, any potential observational signatures of tilt quenching in the Sun may be subtle.

Germinio
July 11, 2017 9:53 pm

As far as I can see from the original paper Ed Fix’s model makes no sense either mathematically or
physically. In addition the data is then altered to agree with the model.
The original article is at
http://www.sciencedirect.com/science/article/pii/B9780123859563100142
and the relevant equation is Eq. 3 which describes a mass on a spring with damping and a forcing
term. i.e. the acceleration a(t)= -k x(t) +b v(t)+ Fr(t)
this is the “integrated” incorrectly to give Eq (5)
x(t) = F_r*t^2 +v_0*t x_0
this equation is clearly wrong since the solutions for a mass on a spring are oscillatory while his equation
has a parabolic position dependence. Hence the model is fundamentally flawed since he appears to be
incapable of simple integration. Next he approximates this by some sort of weird finite difference and get
rid of the t^2 term by stating that t=1. Which again makes no sense in any mathematical or physical way.
Then he decides that he can reset his model to zero “resetting the initial condition” whenever his model
gives the wrong answer. And “the next manipulation was to reverse the polarity sign of all the sunspot data between 1810 and 1912” because it doesn’t agree with his model. So any agreement between his model
and reality is completely spurious and should not be taken seriously at all.

KLohrn
July 11, 2017 10:43 pm

If Solar cycle magnetics unwind Earth’s orbit enough, we could start taking Mars orbit.

July 12, 2017 2:12 am

This study was posted by Judith Curry in her weekly science review.
It shows that (surprise surprise!) European climate can be predicted a few years in advance from the heat content of the northerly extension of the gulf stream:
https://www.nature.com/articles/ncomms15875
From this there is already the prediction of at least half a decade of cooling European climate and Arctic sea ice growth. Both of these are predictable from the northern gulf stream heat, lagged by a few years.
The ocean is the gatekeeper of climate, and it operates slowly with lags of anything from years to thousands of years. (Javier showed previously that obliquity forces interglacials with 6,500 years lag.)
This controlling role of the ocean, and its long lags, are the reason why evidence is so flimsy for prompt climate effects of either solar or CO2 or any other forcing-de-jour. Such prompt effects are illusory and non-existent. All influences on climate go through the ocean and wait in line for a long time.
Weather = atmosphere; climate = ocean.

Robert of Ottawa
July 12, 2017 2:39 am

Why is the F10.7 Flux/Lyman alpha ratio significant? It appears to just be a haphazard number to me unless there is some underlying physical process.

July 12, 2017 2:48 am

KTM
I started looking in my own backyard in 2010
here is a summary of results of my investigations, in case you never saw that:
Concerned to show that man made warming (AGW ) is correct and indeed happening, I thought that here [in Pretoria, South Africa} I could easily prove that. Namely the logic following from AGW theory is that more CO2 would trap heat on earth, hence we should find minimum temperature (T) rising pushing up the mean T. Here, in the winter months, we hardly have any rain but we have many people burning fossil fuels to keep warm at night. On any particular cold winter’s day that results in the town area being covered with a greyish layer of air, viewable on a high hill outside town in the early morning.
I figured that as the population increased over the past 40 years, the results of my analysis of the data [of a Pretoria weather station] must show minimum T rising, particularly in the winter months. Much to my surprise I found that the opposite was happening: minimum T here was falling, any month….I first thought that somebody must have made a mistake: the extra CO2 was cooling the atmosphere, ‘not warming it’. As a chemist, that made sense to me as I knew that whilst there were absorptions of CO2 in the area of the spectrum where earth emits, there are also the areas of absorption in the 1-2 um and the 4-5 um range where the sun emits. Not convinced either way by my deliberations and discussions as on a number of websites, I first looked at a number of weather stations around me, to give me an indication of what was happening:comment image
The results puzzled me even more. Somebody [God/Nature] was throwing a ball at me…..The speed of cooling followed a certain pattern, best described by a quadratic function.
I carefully looked at my earth globe and decided on a particular sampling procedure to find out what, if any, the global result would be. Here is my final result on that:comment image
Hence, looking at my final Rsquare on that, I figured out that there is no AGW, at least not measurable.
Arguing with me that 99% of all scientists disagree with me is useless. You cannot have an “election” about science.
My opinion on the sat’s that don’t show the same as my results is that the material used to measure are degenerated more quickly due to the current conditions of the sun. The terrestrial based datasets are all biased towards the NH. Nobody balanced the stations properly NH and SH to zero latitude like I did. In addition, to cancel the effect of longitude, I looked at the average change from the average in K/ year, over the periods indicated.
So, let me stick to my results. Must say: we are talking about minute changes e.g. as can be seen above, my results indicate that T min (global) is going down at an average rate of ca. 0.01K / annum
[my wife still laughs at me for finding such a small silly end result….]

tony mcleod
Reply to  henryp
July 12, 2017 7:36 am

Do you have any results for the last 17 years?

Reply to  tony mcleod
July 12, 2017 12:31 pm

my graph was made in 2015
including the results of 2014
meaning it is there [except 2015 and 2016]

ren
July 12, 2017 2:54 am

The relative decline in solar activity will occur after 2020 after the conjunction of Jupiter and Saturn.

Reply to  ren
July 12, 2017 3:24 am

Yes, the 2020 Jupiter-Saturn conjunction is pretty big in astrological circles.
http://i2.wp.com/mauricefernandez.com/wp-content/uploads/2016/01/2-Jupiter-Saturn.png
http://mauricefernandez.com/the-saturn-pluto-conjunction-and-the-transits-for-the-year-2020/
“If we contemplate the whole sequence of astrological events in the year 2020, with its dramatic planetary alignments, we can anticipate great intensity and changes on many levels. These events will likely have a destructive edge as a new world order is programmed — change is not always a smooth process. However, since all the year’s transits culminate in the Jupiter–Saturn conjunction in Aquarius, we will see new solutions and paradigms emerge.”
I wonder why we bother with science and demand evidence.

ren
Reply to  Javier
July 12, 2017 9:55 am

The gas giant is so big that its centre of mass with the Sun, or barycenter, actually lies 1.07 solar radii from the middle of the Sun — or 7 percent of a Sun-radius above the Sun’s surface. Both the Sun and Jupiter orbit around that point in space.
This not-to-scale gif from NASA illustrates the effect:
https://www.sciencealert.com/jupiter-is-so-freaking-massive-it-doesn-t-actually-orbit-the-sun

Reply to  ren
July 12, 2017 10:07 am

jupiter-is-so-freaking-massive-it-doesn-t-actually-orbit-the-sun
If you are standing on the Sun, you will find that Jupiter actually does orbit the Sun. If Jupiter’s orbit were circular [that would not materially alter the center of gravity] you would find that the distance to the sun would always be the same, i.e. Jupiter does orbit the sun perfectly. That the sun wobbles a bit does not change that.

ren
Reply to  Javier
July 12, 2017 10:47 am

Does a Spin–Orbit Coupling Between the Sun and the Jovian Planets Govern the Solar Cycle?
I. R. G. Wilson A C , B. D. Carter B and I. A. Waite B
+ Author Affiliations
Publications of the Astronomical Society of Australia 25(2) 85-93 https://doi.org/10.1071/AS06018
Submitted: 13 June 2007 Accepted: 28 April 2008 Published: 26 June 2008
Abstract
We present evidence to show that changes in the Sun’s equatorial rotation rate are synchronized with changes in its orbital motion about the barycentre of the Solar System. We propose that this synchronization is indicative of a spin–orbit coupling mechanism operating between the Jovian planets and the Sun. However, we are unable to suggest a plausible underlying physical cause for the coupling. Some researchers have proposed that it is the period of the meridional flow in the convective zone of the Sun that controls both the duration and strength of the Solar cycle. We postulate that the overall period of the meridional flow is set by the level of disruption to the flow that is caused by changes in Sun’s equatorial rotation speed. Based on our claim that changes in the Sun’s equatorial rotation rate are synchronized with changes in the Sun’s orbital motion about the barycentre, we propose that the mean period for the Sun’s meridional flow is set by a Synodic resonance between the flow period (~22.3 yr), the overall 178.7-yr repetition period for the solar orbital motion, and the 19.86-yr synodic period of Jupiter and Saturn.
http://www.publish.csiro.au/as/Fulltext/AS06018

Reply to  ren
July 12, 2017 10:56 am

We postulate that the overall period of the meridional flow is set by the level of disruption to the flow that is caused by changes in Sun’s equatorial rotation speed. Based on our claim that changes in the Sun’s equatorial rotation rate are synchronized with changes in the Sun’s orbital motion about the barycentre
Does not explain the phase change that is postulated to match the solar cycles [apart from all the other problems with the idea], so is basically falsified.

Curious George
Reply to  Javier
July 12, 2017 11:04 am

I use this opportunity to emphasize that the International Space Station does not orbit the Earth, but the barycenter of the Earth-Moon system. Right or wrong?

AJB
Reply to  Javier
July 12, 2017 11:51 am

To better bet the farm and weather the ravages of political turmoil wrought by an emotional attachment to bogus numerology purporting to be mathematics perhaps 🙂 /cynical
https://solarcycles.files.wordpress.com/2012/03/trading-the-sun.pdf

ren
July 12, 2017 3:04 am

“Everyone’s assumption has been that the shape of the heliosphere was molded by the flow of interstellar material passing around it,” said Merav Opher, an astronomer at Boston University, who is lead author on the paper. “Scientists thought the solar wind flowing down the tail could easily pull the magnetic fields in the heliosphere along as it flowed by, creating this long tail. But it turns out the magnetic fields are strong enough to resist that pull – so instead they squeeze the solar wind and create these two jets.”
Opher and her colleagues found the jets and determined the new shape when they adjusted simulations of the heliosphere based on observations collected from NASA’s Voyager 1 spacecraft, which recently moved outside of the heliosphere into interstellar space. As the first man-made object outside of our solar system, Voyager provided our only glimpse so far of the interstellar medium and it provided one giant surprise: The magnetic fields out there were aligned pretty much the same as the ones in here, though it had long been expected they would be oriented in a different direction.
https://www.nasa.gov/content/goddard/two-solar-wind-jets-found-in-the-heliosphere

Sara
July 12, 2017 4:39 am

You guys are all missing the most obvious issue: what effect will this have on farming and on the food you put on your plate?
Solar cycles affect weather far ahead of changes in climate cycles. Weather is the immediate short-term effect, climate is the longer term effect. The solar input is what drives weather on our little planet, everything from excessive snow-melt to excessive rain and flooding, bitter cold but dry winters (little to no snow), hurricanes/tropical storms, etc. It’s a complex system that does NOT have one answer for everything.
The question we should all be asking is how much will this obviously weaker than normal return to solar activity affect rain and snow totals, both of which have a direct impact on food supplies?
Here’s an example: two years of heavy rains, nearly nonstop, with flooding, will not only make it nearly impossible for any farmer to get out and plow and plant croplands, but will also make the growing/ripening season shorter for grains and will damage those crops. If you think you don’t use grain products, go look at what’s in your cupboard and fridge. That’s only one example.

July 12, 2017 7:06 am

This is a ‘model’ of sunspot magnetic cycle (hemisphere’s polarity change, not to be confused with polar fields magnetic cycle, two cycles run with 90 degree phase difference) published in January 2004.
http://www.vukcevic.talktalk.net/SSC.gif
23.724 =2 x 11.862 Jupiter orbital period and 19.859 J-S synodic period. One odd thing about it is that there is phase change every 100 or so years at the sunspot’s centenary minima.

ren
Reply to  vukcevic
July 12, 2017 9:15 am
Reply to  vukcevic
July 12, 2017 9:45 am

One odd thing about it is that there is phase change every 100 or so years at the sunspot’s centenary minima.
And that shows that the model is incorrect, because we know [from geomagnetic data] that the sun’s magnetic cycle did not have a phase change at any point since the 1840s.

Reply to  lsvalgaard
July 12, 2017 10:35 am

Leif
your graph shows that the solar polar magnetic forces were the weakest ca. 2014
as predicted by me from the Gleisberg solar cycle
weakest in 86.5 years…..
http://oi63.tinypic.com/2ef6xvo.jpg

Reply to  henryp
July 12, 2017 10:40 am

your graph shows that the solar polar magnetic forces were the weakest ca. 2014
So, they were as they went to zero, but they do that every solar maximum, i.e. about every 11 years.

Reply to  lsvalgaard
July 12, 2017 11:19 am

Leif
I am saying
– there is a Gleisberg SC, 86.5 years, as predicted from my very own results – and the minimum solar polar field strengths was reached at SC 24 max, 2014
– you are saying
that during SC 25 the solar polar magnetic field strengths are going be lower than in SC 24,
following the very logic of your graph….

Reply to  henryp
July 12, 2017 12:12 pm

following the very logic of your graph
Except that the Sun does not know that and does what it wants. We can only watch. And at this point it looks that SC25 is going to be a bit stronger than SC24 because the polar fields are becoming stronger than they were back in 2007-2009.

Reply to  lsvalgaard
July 12, 2017 12:24 pm

so
like I told you before
put a mirror at that graph at 2014 and look what will happen in the next 44 years…
it is easy if you studied the actual daily data from 54 weather stations…
https://wattsupwiththat.com/2017/07/11/monster-solar-minimum-approaching/#comment-2549301

Reply to  henryp
July 12, 2017 12:34 pm

Unfortunately, the Sun does not have a mirror and does not know about your marvelous discoveries. The Sun is now where it was about a century ago, but does not seem to have a memory about what it is supposed to do next.

Reply to  lsvalgaard
July 12, 2017 12:42 pm

you finally get it!
the sun is changing its behavior because of….

Reply to  henryp
July 12, 2017 12:49 pm

You tell me…And tell the sun. It doesn’t know.
And not on a 88 [sorry 86.5, or is it 86.51?] cycle.

Reply to  lsvalgaard
July 12, 2017 12:57 pm

Explain to all of us why you agree that 2014 was a turning point?

Reply to  Henryp
July 12, 2017 1:07 pm

I just wonder if it would be at all possible
To take the ice broken off from the antarctic on a ship to cape town where we have the worst drought in 100 years….
It would be fresh water for us….

Reply to  lsvalgaard
July 12, 2017 11:42 am

funny
shame
now you have to admit one way or another that 2014 was a turning point…
hahah

Reply to  henryp
July 12, 2017 12:13 pm

2014 was a turning point
As is every solar max. Lots of turning points.

Reply to  lsvalgaard
July 12, 2017 1:42 pm

Dr. Svalgaard:“…..because we know [from geomagnetic data] that the sun’s magnetic cycle did not have a phase change at any point since the 1840s.”
Hale’s polarity (Hale 1908) is known since 1908 and has been consistently reversing every sunspot cycle for a century since. I don’t know of a method that could have established the polarity for previous two centenary cycles.
SC25 & 26 by all accounts may initiate a new centenary cycle and will show if the Hale polarity is reversed or not. I will not be surprised by either result, but it wouldn’t defy logic if the polarity fails to reverse at the start of either of the next two cycles, after all there are always ‘rogue’ polarity spots at beginning of every cycle.
Physical mechanism ‘explaining’ the Hale’s polarity reversal is based hypothesis that is not possible to verify.

Reply to  vukcevic
July 12, 2017 2:32 pm

I don’t know of a method that could have established the polarity for previous two centenary cycles.
That you don’t know it, does not mean that it does not exist. The method is explained in Section 9 of
http://www.leif.org/research/suipr699.pdf
An application back to the 1840s is here
http://www.leif.org/EOS/95GL03086.pdf
This is not in doubt, but is a well-established phenomenon

Reply to  lsvalgaard
July 12, 2017 2:52 pm

Thanks for references. Your article from 77 I remember reading some years ago, but forgotten most of details, but clearly remember Fig.23, will read again.

Pamela Gray
July 12, 2017 7:16 am

The machinations evident here is similar to the tortured Mann data. We fillet Mannian methods coming from the other side so we must fillet similar tactics from this side. If simple observation between two entities does not show robust correlation, torturing the data till it does steps outside the necessary limits of research put in place lest we return to belief in snake oil salesmen.

tony mcleod
July 12, 2017 7:39 am

Looks like Leif has given up trying to counter this crack-pottery, I don’t blame him.

Reply to  tony mcleod
July 12, 2017 9:50 am

basically, yes. Not worth comments.

Jim G1
Reply to  lsvalgaard
July 12, 2017 10:08 am

Comments such as your one above re phase change are however very helpful.

afonzarelli
Reply to  tony mcleod
July 12, 2017 12:41 pm

Tony, you are being a disingenuous troll here. You disagree with this man’s thought processes and , yet, here you are patting him on the back like Trump patting Putin! (“way to go vlad, i owe you one”) BTW, TSI varies 0.1%, not your 0.001%. Even svalgaard admits to a .1C increase in temperature due to this. What he is in d’nial of are the feedbacks associated with the increase which you apparently aren’t. (so, in reality, you couldn’t be in disagreement with svalgaard any more than you are)…

Toneb
Reply to  afonzarelli
July 12, 2017 11:29 pm

What about the 0.1C decrease when the cycle goes to the minimum? it is a cycle after all and averages out as a big fat zero. Feed-backs the same, unless you are arguing some sort of runaway effect, that mysteriously happened in tune with increasing anthro CO2….. the logic of which is that it will never stop.

afonzarelli
Reply to  afonzarelli
July 13, 2017 1:12 am

Toneb, .1C would be the result with detrended data. That would say nothing about the trend from feedbacks with an average increase of .05C over the length of the cycle. (one could also argue that the .1C number is actually higher than that)…
Higher solar activity correlates with warming trends:
http://m.imgur.com/yvrMXFy?r

Bob Weber
July 12, 2017 8:55 am

TSI could now be very nearly repeating the 2006-2009 TSI pattern:comment image
I expect a near repeat of the 2005-2008 HadSST3 drop from low TSI going into this minimum:
http://climate4you.com/images/SunspotsMonthlySIDC%20and%20HadSST3%20GlobalMonthlyTempSince1960%20WithSunspotPeriodNumber.gif
This temperature drop will depend on the length of time this low TSI lasts, ie the cycle length.

ren
July 12, 2017 12:04 pm

The decrease in solar activity hinder the creation of a strong El Niño because of changes in circulation.
http://www.cpc.ncep.noaa.gov/products/analysis_monitoring/ocean/anim/wkxzteq_anm.gif

July 12, 2017 12:45 pm

I am surprised that the decline in the Earth’s magnetic field hasn’t gotten more attention. If recent data showing a 10% per decade decline is evidence that we are moving toward a pole reversal, I would think the potential impacts on climate would be widely discussed. I seldom see it mentioned.

AJB
Reply to  Nelson
July 12, 2017 1:46 pm
Reply to  ren
July 12, 2017 2:22 pm

Hemispheric difference in the change of the geomagnetic intensity is due to the asymmetry (lopsidedness) of the inner core, it melts on one side and crystallises on the other; this enhances/impedes outer core circulation where magnetic field is generated .
Due to the inner core’s differential rotation the effect of hemispheric magnetic intensity time gradient slowly drifts westward.
Strangely but physically not analogues, as far as I know, the sun’s magnetic field is also lopsided, and the anomaly is drifting longitudinally. Few years back (prompted by work of much younger Dr. Svalgaard) from the available data I constructed this diagram:
http://www.vukcevic.talktalk.net/nSSLong.gif
which I believe is still unique

Reply to  vukcevic
July 12, 2017 2:42 pm

which I believe is still unique
Not at all. This had been discussed for over a century. Starting with Maunder. A recent discussion is here
http://www.leif.org/research/AGU-2016-Fall-SH31B-2548.pdf
and here:
http://www.leif.org/EOS/Gough-Is-the-Sun-a-Magnet.pdf

Reply to  ren
July 12, 2017 2:56 pm

It says:
“Few years back (prompted by work of much younger Dr. Svalgaard) from the available data I constructed this diagram: which I believe is still unique”
In the plain English it says ‘diagram is unique’, your references show nothing of a kind.

afonzarelli
Reply to  ren
July 12, 2017 5:03 pm

Eh, vuk, the school yard bully’s at it again…

ren
Reply to  ren
July 12, 2017 9:44 pm

Researchers usually assume that the magnetic field is effectively frozen into the liquid under the surface of the core-mantle boundary (approximately 3000 km below the Earths surface). This means the magnetic field is advected by the flowing liquid (i.e. drifts along with it) over short timescales (< 10 years, say). In reality, the actual interaction between the liquid in the outer core and the magnetic field is far more complex and is currently poorly understood in detail. However, if the simplifying assumption is made that any observed change in the spatial pattern of the magnetic field is due to fluid flow, we can mathematically invert the changes in the magnetic field we measure at and close to the surface of the planet to infer the pattern of fluid flow at the top of the outer core.
Using several years of magnetic field observations from observatories and satellites can help us build up a picture of what the large-scale flow patterns in the core look like (this is known as a steady flow model). Figure 1 (top) shows an image of the changes of the magnetic field and the flow patterns that could cause this on the core-mantle boundary (continents shown for reference). In the Atlantic hemisphere, the flow tends to be relatively fast, while in the Pacific hemisphere it is slow or non-existent. The change of the magnetic field variation and hence the accelerated flow is about ten times smaller (bottom). This map also shows strong changes in the Indian Ocean, suggesting this is a location of relatively rapid acceleration.
http://www.geomag.bgs.ac.uk/research/modelling/SVpredictions.html

ren
Reply to  ren
July 12, 2017 9:48 pm

What is Swarm?
Swarm is the fifth Earth Explorer mission approved in ESA’s Living Planet Programme, and was successfully launched on 22 November 2013.
The objective of the Swarm mission is to provide the best-ever survey of the geomagnetic field and its temporal evolution as well as the electric field in the atmosphere using a constellation of 3 identical satellites carrying sophisticated magnetometers and electric field instruments.
https://earth.esa.int/web/guest/missions/esa-operational-eo-missions/swarm;jsessionid=5C5CB2F4996DA238E1076CCC951AE817.jvm2

July 12, 2017 4:23 pm

In the plain English it says ‘diagram is unique’, your references show nothing of a kind.
I(f course your diagram is unique unless you stole it somewhere [you must think the readership are morons]. What is not unique is the information it presumably was intended to convey, namely that the sun is magnetically lopsided, as my references so nicely show.

Reply to  lsvalgaard
July 13, 2017 6:33 am

Doc, you made me laugh, the fact that you or your solar colleagues failed to construct one is your problem, else if you did do it would have been here in a flash.
“unless you stole it somewhere “
… ah, that old Danish proverb comes to mind….
It has been long time (mid 1800s) since my great, great grandfather led his gang across the border rustling Ottoman’s cattle. Since the house was bombarded few times by Turkish canons, pot marks are still there in one meter thick stone walls, the family refocused on running somewhat more honest business, producing good quality wine, and rather small quantity of the most excellent crystal clear brandy, which was served by the old president to his most distinguished guests including one Nikita Khrushchev and the word is to the queen Elisabeth, not exactly ladies drink, but I’m sure the old sea veteran Philip the Greek wouldn’t have missed a chance of a tipple or two.
http://www.vukcevic.talktalk.net/T&E.jpg

Reply to  vukcevic
July 13, 2017 6:54 am

the fact that you or your solar colleagues failed to construct one is your problem
The diagram is just a way of showing what Maunder said a century ago. Because the Sun is rotating, the diagram just shows a time sequence wrapped around the Sun. The physics is that there is longitudinal structure in the Sun’s magnetism, as Wilcox and Gonzales suggested in 1971 [and Gough in 2017]:
http://www.leif.org/research/Wilcox-Gonzales-Dipole.png
Nothing unique about that.

pochas94
July 13, 2017 4:12 am

Repeating an idea I’ve held for some time. There are 180 years in a Jose cycle. During the first 60 years of a Jose cycle the Schwabe cycles are exactly 10 years long. If the preferred length of a Schwabe cycle is 10 years, then there should be 18 Schwabe cycles in a Jose cycle. But, counting observed cycles, there are only 16. Is there a missing Hale cycle in every Jose cycle? IIRC, a paper by Usoskin suggests that there is no missing Hale cycle, only a period of very low solar activity such that the missing Hale cycle is not observed, even though magnetic activity continues.
https://arxiv.org/pdf/1402.4720v1.pdf

July 13, 2017 6:25 am

Ed Fix
Putting rainfall data into the relevant Hale cycles gives interesting patterns…comment image

ren
July 13, 2017 7:11 am

It is a pity that North America is not prepared for a real “earthquake”.

July 13, 2017 12:33 pm

leif, ren
on another note
– nothing to do with my earlier comment to lsvalgaard just now –
it seems very feasible to me to assume that a change in solar magnetic field strengths also re-aligns earth’s magnetic field,
similar to how a magnetic stirrer works [in a lab]
My own results show no warming in the SH but some warming in the NH over the past 40 years.
How is this possible to explain other than by a movement of earth’s inner core?
Come down 1 km down in a gold mine here in South Africa and notice the elephant in the room…
Indeed, last time I looked I did find that the north pole has been moving, fast, over the past 50 years, north east. I think it is already outside Canada by now.
Indeed I wonder if this was not the reason for the earth quake in Japan and the F. nuclear disaster.
Indeed, in that case, if my thinking is right,
leaving California soon might not be a bad thing to do…

afonzarelli
Reply to  henryp
July 13, 2017 4:08 pm

Henry, i believe the magnetic north pole is now in siberia. (been a while since i took an interest in that so i’m not really sure) i was in a small earthquake back in the 80s in hawaii. It made all the news there in hawaii and i learned back then a curious bit of info. Earthquakes were being recorded in just 4 states here in the u.s. California, Hawaii, Alaska and (upstate) New York. Several years ago, i was listening to audio of a geologist who gave the same stat. Back in the day just 4 states, but now 17 states(!) i grew up north of washington d.c. My sister told me back in ’09 that she felt a trembler in northern virginia. In 2010, a 3.9 magnitude quake was measured in my home town of rockville, maryland. And in 2011, of course, there was the quake that shook all of washington d.c. They even had to shut down the washington monument (an obilisk) for repairs. That sort of stuff was NOT happening when i was a kid. So, i would think that something is up. One last tidbit, fox news reported that the annual sunrise festivals at the artic circle no longer happen on the same day as they used to. (love it when this type of news boils up to the surface of the main stream media, as did the movement of the magnetic north pole) We live in strange times indeed…

Reply to  afonzarelli
July 14, 2017 5:53 am


interestingly, the scientist speaking towards the end of the this video mentions a cycle time of 240 years.
Anyone any idea where he got this from?

Reply to  afonzarelli
July 16, 2017 1:03 pm

In March of 2011 the Great Tohuko Quake inspired me to start following the daily quake map. At the time I was still commenting at Newsvine. I started a post that was meant to be a place for me to record daily changes in the quake count. The process was interesting, and I started making connections, mainly with changes in the quake count coinciding with Moon phases. Also of minor interest at the time, but of more import now as I see it was that for 6 to 7 months after the Japan quake I never noted any quakes striking in Oklahoma or anywhere in the eastern US.
Then in around Oct/Nov of 2011 I noted a quake striking in Oklahoma. I made a note of it at the time in my post at Newsvine as it was an oddity as far as I knew. Following that initial Oklahoma quake the area started to post quakes every day or two, and then the flurries started of multiple quakes in a day or several days. Then there was a quake in Arkansas. I made a joke about Clinton’s library getting too heavy, which none of the many liberals on Newsvine thought was funny. In the following months there were occasional quakes in some of the other eastern states, and Oklahoma had become a steady producer of small quakes.
That is when I came across info on the New Madrid Fault Zone in further reading. Along with that I noticed the correlation between large quakes striking the NMFZ and GSM/Gleissberg periods. It was apparent to me that the probability for large quakes as well as large volcanic eruptions increased during the time of a GSM or Gleissberg event. Being that we should be close to the next Gleissberg, and possibly the next GSM then it would not be surprising for a large quake on the NMFZ, or elsewhere in the active quake zones around the planet. As for the prediction below for a 9+ mag quake on the West Coast, I came across a possible clue which points to that event being more likely to occur around the year 2200. That does not mean that a lesser strength quake is out of the question in the interim.

July 14, 2017 6:28 am

The sun accounts for over 99% of all the energy released on earth. Take all the oil, gas, uranium, wood, etc. consumed in a day, and it only amounts to <1% of the energy hitting earth and its atmosphere from the sun.

July 14, 2017 2:51 pm

In m opinion, the “monster solar minimum” is speculative hyperbole. Let’s see what happens first. Having one weak cycle is not a “monster solar minimum” nor would two weak cycles. It would be akin to the Dalton which would be significant but not a “monster”. Can we dial back the histrionics a little?

Reply to  crosspatch
July 15, 2017 5:00 am

crosspatch
lsvalgaards position as shown by his comments is that the sun is god and that it does what it wants….this is the same thinking of the Egyptians 5000 years ago and it worked for them. But they knew the cycles and were able to correlate them with the flooding of the Nile…50 years generally going down and thereafter 50 years generally going up..
some of us here and some of our forefather scientists [before they allowed the CO2 nonsense to take hold in their lives] believe or can see correlation with solar activity [SA] and the position of the planets. The word is not 100% out if SA is caused by or cause to the position of the planets but assuming the first, it is possible to postulate that it may be possible that the barycenter of gravity required to make the switch to min to max and max to min could simply be missed. In that case you could have 2 max or 2 min in one cycle. Hence we have actual evidence in recent history of a medieval warm period and a little ice age.
I think looking at the latest results for the solar polar field strengths, it looks like we made the switch as also the planets Uranus and Saturn arrived exactly in time in their expected positions opposite each other.
Thanks be to the God that we cannot see but perhaps He is in the sun as He [His Spirit] is also in us….

Reply to  crosspatch
July 15, 2017 6:25 am

no monster minimum…
[my] logic based on my own results says that SC 25 will be similar in strength to SC 23….
http://www.leif.org/research/Solar-Polar-Fields-1966-now.png

ren
Reply to  henryp
July 16, 2017 2:09 am

henryp
Not necessarily. As you can see the solar dynamo can surprise us.
http://www.solen.info/solar/polarfields/polar.html

ren
Reply to  henryp
July 16, 2017 2:13 am
Reply to  ren
July 16, 2017 6:09 am

ren
my results for the speed of warming, in K/year, especially maxima and minima, show a sine wave for incoming energy with a wavelength of about 86-87 years. The last top was in 1971/1972 and the last bottom was in 2013/2014.
This year, 2014, is also when the solar polar field strengths was at its lowest….
In the graph from Leif that I showed earlier he showed the trend line as linear going down. Obviously that is not the correct fit for this situation. I think you can imagine drawing a parabola bottom to top and a hyperbole top to bottom for the solar polar field strengths that would represent the average solar polar field strengths?
This means there were dead end stops in 1971 and 2014 where the direction of the warming/cooling changes. Vuks formula is correct until 2014 or if there were no dead end stop in 2014. But there is. We did not miss the switch. Luckily. We don’t really want a little ice age!!
SC 25 will be more or less equal SC 23. You can put a mirror at 2014 in the graph and see how it fits.

Reply to  henryp
July 16, 2017 6:23 am

The decrease of the polar fields in 2017 is not real. The WSO was broken and all field values were reported about a factor two too small, see http://www.leif.org/research/WSO-Problem.pdf

Regular0ldGuy
July 15, 2017 11:35 am

The 11 year cycle, is compounded by much longer cycles and the positions of the gas giants. And it’s the clouds Svensmark

July 16, 2017 6:43 am

leif
please clarify
is this graph correct or is it not?\
http://www.leif.org/research/Solar-Polar-Fields-1966-now.png

Reply to  henryp
July 16, 2017 6:50 am

Values in 2017 are too smal, but that does not impact the graph you show.

Reply to  lsvalgaard
July 16, 2017 7:00 am

thanks!

ren
Reply to  lsvalgaard
July 16, 2017 8:41 am

In this situation, you can only believe in continuous measurement of neutrons. Is anyone afraid of panic? Continuous data correction will not help.comment image
CINDI and C/NOFS were designed to study disturbances in Earth’s ionosphere that can result in a disruption of navigation and communication signals. The ionosphere is a gaseous envelope of electrically charged particles that surrounds our planet and it is important because Radar, radio waves, and global positioning system signals can be disrupted by ionospheric disturbances.
CINDI’s first discovery was, however, that the ionosphere was not where it had been expected to be. During the first months of CINDI operations the transition between the ionosphere and space was found to be at about 260 miles (420 km) altitude during the nighttime, barely rising above 500 miles (800 km) during the day. These altitudes were extraordinarily low compared with the more typical values of 400 miles (640 km) during the nighttime and 600 miles (960 km) during the day.
The height of the ionosphere/space transition is controlled in part by the amount of extreme ultraviolet energy emitted by the Sun and a somewhat contracted ionosphere could have been expected because C/NOFS was launched during a minimum in the 11-year cycle of solar activity. However, the size of the actual contraction caught investigators by surprise. In fact, when they looked back over records of solar activity, they found that C/NOFS had been launched during the quietest solar minimum since the space age began.
https://www.nasa.gov/topics/earth/features/outer_atmosphere.html

Reply to  ren
July 16, 2017 8:56 am

In this situation, you can only believe in continuous measurement of neutrons
Not even that, as the cosmic ray measurements have their own issues with stability and corrections. Different stations report different trends over time.

ren
Reply to  lsvalgaard
July 16, 2017 8:56 am

The rotational averages are the radio emission from the Sun at a wavelength of 10.7 centimetres averaged over the Carrington Rotation. Vertical scale units are in solar flux units (1 sfu = 10-22.m-2.Hz-1), horizontal units are Carrington Rotation number. Carrington Rotation Number is the number of times the Sun has rotated since 9th November, 1853. The rotation period is roughly 27 days.
http://www.spaceweather.gc.ca/auto_generated_products/solradrot_eng.png
The 10.7cm Solar Flux is currently one of the best indices of solar activity we have. It now forms a consistent, uninterrupted database covering more than 50 years. Only sunspot number counts cover a longer period, going back to at least the 17th Century. However, these data are subject to subjective effects in observation and evaluation, and are affected by the weather.
Between 1946 and 1990, the measurements were made in the Ottawa area. In 1990, following the closure of the last good observing site in the area, the programme was relocated to the Dominion Radio Astrophysical Observatory, where it will be for the foreseeable future.

Reply to  ren
July 16, 2017 9:03 am

The 10.7cm Solar Flux is currently one of the best indices of solar activity we have. It now forms a consistent, uninterrupted database covering more than 50 years.
We can estimate the Solar Flux with good accuracy back to the 1740s.
http://www.leif.org/research/F107-since-1741.png

July 16, 2017 9:54 am

I told you people that with the current situation you cannot rely too much on anything being measured outside of an N2/O2 atmosphere. The lower the magnetic field strengths, the more of the most energetic particles are being released from the sun. It is quite simple, really. Forget about TSI. Look at the distribution of radiation coming into earth.
It is not a mystery to me.
Yet, the system devised, [obviously there is a plan] actually prevents earth from either overheating or overcooling. It has all these marvelous brakes designed into the system…..
Anyway, if this graphcomment image
is correct
[until the date indicated],
I don’t see any disaster coming up except the drought similar to the dust bowl drought of 1932
which should start in a couple of years
2017-87 = 1930
2 more years to go.
EVERYONE FIDDLING, LIKE NERO
YET NOBODY REALLY HAS A CLUE

Reply to  henryp
July 16, 2017 10:08 am

I told you people that with the current situation you cannot rely too much on anything being measured outside of an N2/O2 atmosphere.
It is the other way around. The atmosphere is distorting what we measure. To measure things the best we have to be outside of the atmosphere. Luckily we have good measurements from space.

ren
Reply to  lsvalgaard
July 16, 2017 10:48 am

Therefore, you must still be corrected?

Reply to  lsvalgaard
July 16, 2017 11:05 am

>Leif
I am an independent person relying on my own results rather than that of others.
For minima, I have reported my results here:
https://wattsupwiththat.com/2017/07/11/monster-solar-minimum-approaching/comment-page-1/#comment-2549301
For maxima, I find that the global drop for the speed of warming from 1974-2015 is best given by y=0.039ln(x) – 0.1112
where y= speed of warming/cooling [in K/annum]
and x = years in the past
The correlation coefficient for the above equation was found at 0.9964.
[4 measuring points, 54 weather stations, balanced to zero latitude]
please let me know exactly which satellite measurements correspond [at least 99% correlation] with my own results?

Reply to  henryp
July 16, 2017 11:10 am

please let me know exactly which satellite measurements correspond [at least 99% correlation] with my own results?
I would not expect any, for obvious reasons, e.g. only 4 data points.
relying on my own results rather than that of others
Sometimes [most of the time] it is valuable [and necessary] to rely on others. The easiest person to fool is oneself, as you demonstrate.

July 16, 2017 11:43 am

leif
as you well know, I stumbled on the 86.5 year Gleissberg cycle after analyzing all the data on maximum T of a weather station in Alaska.
As you can see from the link below, I do not stand alone on this, as you propose.
http://onlinelibrary.wiley.com/doi/10.1029/2002JA009390/abstract
I suspect the reason why they find 88 [instead of my 86.5] is that there were instances where a switch from min to max or vice versa was missed
[ which is why some people here feared a MONSTER minimum]
let us end the argument and leave it at that?

Reply to  henryp
July 16, 2017 11:47 am

I stumbled on the 86.5 year Gleissberg cycle
The Gleissberg ‘cycle’ has been ~104 years the last 400 years, not 86.5.
This is not an argument, but an attempt of education.

Reply to  lsvalgaard
July 16, 2017 12:05 pm

Dr Svalgaard, I see that there is a sharp drop being shown on today’s Oulo Monitor. Is that due to the CME which is currently impacting the Earth?

Reply to  lsvalgaard
July 16, 2017 12:10 pm

leif
ok
I am interested and in for a fight
where do you get your 104 years from?
here is my confirmation for the 86-87 that I found
for the past 100000 years
[the 88 was for 12000 years]
http://www.nonlin-processes-geophys.net/17/585/2010/npg-17-585-2010.html

Reply to  henryp
July 16, 2017 12:19 pm

where do you get your 104 years from?
Just looking at the data shows that clearly:
http://www.leif.org/research/No-Trend-OSF-GCR-GN.png
A more formal determination:
http://www.leif.org/EOS/Lomb-Sunspot-Cycle-Revisited.pdf
“This study has found evidence for long-term modulation of the solar cycle over periods of 28 to 450 years. At this stage there is no indication if any of the modulation periodicities are real or if they just represent a Fourier fit to a random variation. It can be noted though that a period of around 100 years, which matches the well-known Gleissberg cycle [9], does seem to be persistent in the data.”
Thus 100 yrs not 86.5, currently.

Reply to  lsvalgaard
July 16, 2017 12:54 pm

Leif
ok, not bad from your side, probably even completely correct, but you / Lomb analysed over a period of 300 years, [i.e. from 1700 AD]. This would include the LIA where we possibly lost 23 years, i.e. if I am correct in determining that here we missed a switch from min to max that would give a delay of ca. 23 years.
I analysed 54 stations from 1974
only one station from 1942
Going by all of my own investigations, I stick to my 86-87
Must say though that going by Moses [who must have learned from the Egyptians] you are not far away. He put the half GB cycle at 49 + 1 year. Perhaps he was able to get long term observations from his forefathers.
I think it all depends on the opportunity to come up with reliant data in a certain period of time.
Like I said, the periodicity of missing a switch seems to depend on the DeVries and other long term cycles.

Reply to  henryp
July 16, 2017 1:01 pm

ok, not bad from your side, probably even completely correct, but you / Lomb analysed over a period of 300 years, [i.e. from 1700 AD].
Those are the years that count for the modern behavior of then Sun, not what Moses may have seen. So, the Gleissberg cycle is currently 100 years, not 86.5.

Reply to  lsvalgaard
July 16, 2017 1:16 pm

I am happy with the 100
this is exactly what William Arnold said
http://www.cyclesresearchinstitute.org/cycles-astronomy/arnold_theory_order.pdf
if I remember correctly, you thought the report was rubbish,
[he was out by only 5 years according to my own results]

Reply to  henryp
July 16, 2017 5:34 pm

if I remember correctly, you thought the report was rubbish,
It was and still is. Any idiot can see it is 100 years [you should thus also be able to see that; even I can]. So, it is good if you can admit that the 86.5 simply doesn’t fit.

Reply to  lsvalgaard
July 17, 2017 9:31 am

Henry said
if I remember correctly, you thought the report was rubbish,
Leif says
It was and still is. Any idiot can see it is 100 years [you should thus also be able to see that; even I can]. So, it is good if you can admit that the 86.5 simply doesn’t fit.
Leif
You are contradicting yourself now. William Arnold looked at Nile flooding and correlated it with the planets’ positions and SSN. Because he looked back for almost the same period as your Lomb report he also calculated GB / weather cycle at 100 years. So? If the report concludes the same as Lomb, it cannot simply be regarded as just rubbish?
Like I said, currently it is 86.5 years because we did not have a miss [i.e. an irregularity in the sine wave]
Arnold speculated [sometime before 1985] on 1990 as a turn around point.
My results show it was in 1995.\
hence we have:
http://oi64.tinypic.com/5yxjyu.jpg

Reply to  henryp
July 17, 2017 10:14 am

If the report concludes the same as Lomb, it cannot simply be regarded as just rubbish?
Like I said, currently it is 86.5 years because we did not have a miss [i.e. an irregularity in the sine wave]

Arnold tortured his data enough to make it 100 years. If he hadn’t, everybody would immediately notice that they did not fit the obvious 100-yr period that has been there the past several centuries. Only an idiot would maintain that the period would be anything else than the 100 years so clearly visible in the data.

Reply to  lsvalgaard
July 17, 2017 11:16 am

Leif
Ehhh…
Scratch…scratch….
I think you are contradicting yourself again.
We all agree it might be 100 or close to that if we looked at it from 1700 AD.
But there was an anomaly.
I just say it is 86.5 if we look over the past 190 years.
Also if we look at 100000 years.
Go figure.

Reply to  Henryp
July 17, 2017 11:34 am

I just say it is 86.5 if we look over the past 190 years.
Nonsense. Solar activity now is like it was 100 years ago and as it was 200 years ago.
There is no 86.5 yr period the last 190 years. Any fool can see that, even Arnold.

Reply to  lsvalgaard
July 17, 2017 12:54 pm

Leif
you honestly don’t see the anomaly in your own data [three graphs] between 1800 and 1825?
https://wattsupwiththat.com/2017/07/11/monster-solar-minimum-approaching/#comment-2553156
Maunder Minimum perhaps ring a bell?
Clearly, all long term evidence > 10000 year is for 86.5 or 88 depending on which investigation you chose, as I have quoted to you.
Myself , I find it at 86.5 currently, from my own results which spans only about one half GB cycle.
It is your own loss if you do not want to look and /or respect it. I left enough clues here.

Reply to  henryp
July 17, 2017 5:12 pm

you honestly don’t see the anomaly in your own data [three graphs] between 1800 and 1825
Of course not. There is no such anomaly. Solar activity is simply low, as it was between 1900 and 1925 and now between 2000 an 2025. To see that take one of my graphs and put your 86.5 yr ‘sine wave ‘ on it and see for yourself that it doesn’t fit.

Reply to  lsvalgaard
July 18, 2017 9:46 am

leif says
https://wattsupwiththat.com/2017/07/11/monster-solar-minimum-approaching/#comment-2554172
henry says
ok.
show me your periodicity from whatever data from 1840

Reply to  henryp
July 18, 2017 9:53 am

show me your periodicity from whatever data from 1840comment image
is a good example of the 100-yr variation.
and it is not MY period, but everybody else’s.

Reply to  lsvalgaard
July 18, 2017 10:24 am

you are now showing a graph from 1600, with even more anomalous sections, either true or related to inaccurate measurement…
I asked you / whoever to re-estimate the cycling from whatever your solar data from 1840
could it perhaps be something like 86.5 – 88 years?

Reply to  henryp
July 18, 2017 10:31 am

I asked you / whoever to re-estimate the cycling from whatever your solar data from 1840
You seem even thicker than I thought possible.
Here are the 100-yr cycles again. For your benefit I have made a box around the data since 1840:
http://www.leif.org/research/100-yr-Cycles.png

July 16, 2017 12:10 pm

I suppose that this answers my question, as well. I have never noted such high across the board activity on spaceweatherlive. con before. …https://www.spaceweatherlive.com/en

Reply to  goldminor
July 16, 2017 12:25 pm

goldminor: yes, a CME does provide a short-term shield for cosmic rays [called a Forbush Decrease]
https://en.wikipedia.org/wiki/Forbush_decrease

July 16, 2017 11:23 pm

leif
like I said, the length [of the long term GB weather cycle] depends on the length of time you take to analyse.
I can easily also agree that there can be a delay for a decade or so before we see any change in weather after reaching the top or bottom of the sine wave.
I am happy with the 100 years for the last millennium. However, for the short term, I think perhaps we should rather take my measurement of 87 years.
In a cooling world there is more likely less moisture in the air, but even assuming equal amounts of water vapour available in the air, a lesser amount of clouds and precipitation will be available for spreading to higher latitudes. So, a natural consequence of global cooling is that at the higher latitudes it will become cooler and/or drier, at the lower latitudes there will be more clouds and rain. Overall, the change in T at most places in the world is of such order that nobody will really notice….
\
therefore, following my logic, the 1932 drought is only a few years away. (2017-87=1930)
http://www.ldeo.columbia.edu/res/div/ocp/drought/dust_storms.shtml
after that, count 1932-87= 1845, and notice again the drought time apparent on the great plains of northern America.
https://www.researchgate.net/publication/252814284_Drought_in_the_Western_Great_Plains_1845-56
Too much of a coincidence to toss it aside?

Reply to  henryp
July 17, 2017 1:19 am

I am happy with the 100 years for the last millennium. However, for the short term, I think perhaps we should rather take my measurement of 87 years.
It sis te other way around. For the short-term [the last few hundred years and now, it has been 100 years.

July 18, 2017 11:06 am

leif says\
For your benefit I have made a box around the data since 1840:
henry says
you are not serious? you show the same graph with a box..
like I said, my own data show a sine wave with wavelength of 87 years [43.5 years per half cycle]
it seems to correspond with SSN ….[for the past 100 years]
http://www.woodfortrees.org/plot/sidc-ssn/from:1969/to:2017/offset/trend/plot/sidc-ssn/from:1920/to:2017/plot/sidc-ssn/from:1925/to:1969/trend/plot/sidc-ssn/from:1925/to:2017/trend

Reply to  henryp
July 18, 2017 11:14 am

you are not serious? you show the same graph with a box..
I am very serious. I you only want to look at the data since 1840, look inside the box and ignore everything outside. Easy, no?
like I said, my own data show a sine wave with wavelength of 87 years [43.5 years per half cycle]
it seems to correspond with SSN ….[for the past 100 years]

No, [shall I draw yet another box?]. For the last 100 years it is clear [as the graph shows] that solar activity now is what is was 100 years ago, just like in the other centuries before. If your ‘data’ does not show that, your ‘data’ are wrong [or your interpretation of them]. This is the usual criteria in the scientific method.

Reply to  lsvalgaard
July 18, 2017 11:57 am

Here is another graph. I have fitted your ‘period’ [red curve] to the most recent cycle:
http://www.leif.org/research/Henry-p-cycle-and-reality.png
as you can see, there is no match at all outside of the fitting period. A sure sign that the fit is entirely spurious: there is no 86.5-yr period in solar activity during the last 400 years.

Reply to  lsvalgaard
July 18, 2017 12:41 pm
Reply to  henryp
July 18, 2017 12:46 pm

must be that either your or my data are wrong
It is not MY data, but the effort of hundreds of observers over centuries. And sunspot, cosmic rays, and geomagnetic data all largely agree about the data since 1610, so those data are good and correct. So, that makes it easy to choose which one to rely on. What is bothersome is that you claim that your faulty data “seems to correspond with SSN” when they patently do not [as you now admit].

Reply to  lsvalgaard
July 18, 2017 1:29 pm

ok.
good comment.
comparing my data with ssn does not seem to work.
ssn is not really a measurement? It is more like a go-no go…?,,
although one assumes that somehow there must be correlation.
Let me think about it some more.

Reply to  henryp
July 18, 2017 1:50 pm

ssn is not really a measurement?
yes it is, we measure [count] the number of spots, measure their area, and measure their magnetic field. We measure the amount of cosmic rays, and we measure the size of the geomagnetic variation. All measurements and all agreeing and all a measure of solar activity. Now, you do nothing like that, so perhaps your data has nothing to do with the sun [since they do not behave like the solar data].

July 18, 2017 1:48 pm

I think I figured it out already.
Has to do exactly what Hale and Nicholson said as per the William Arnold report quoted earlier. In two successive Schwabe cycles one must show SSN as positive while the other is negative. That is just how it is.
Indeed, if that were the case, I think my data would show a good fit, at least for the last GB cycle.

Reply to  henryp
July 18, 2017 1:57 pm

In two successive Schwabe cycles one must show SSN as positive while the other is negative
No, that is a very artificial device meant to confuse, if you take random numbers between 0 and 1 [one number per year] and reverse the sign every 11 years; that is: making 11 positive followed by 11 negative years, you manufacture a spurious 22-yr cycle that did not exist in the original random numbers. At all times, there are positive and negative magnetic fields on the sun. Now, even if you reverse the sign for every other cycle, the numbers you so construct, still show the 100-yr cycle.

Reply to  lsvalgaard
July 18, 2017 2:47 pm

As you can see here:
http://www.leif.org/research/22-yr-Cycles-GN.png
The best fit period is 108 years. With every other cycle reversed, you get TWO 108-yr fits [red and blue]

Reply to  lsvalgaard
July 19, 2017 11:42 am

OK.
Good comment.
At least we found proof of the DeVries cycle [not so?]
Now, how come then the [natural] proof of the GB cycle [86.5 – 88 years]
https://www.nonlin-processes-geophys.net/17/585/2010/npg-17-585-2010.html
and the persistence of it [as observed in natural processes]?
http://simsee.org/simsee/biblioteca/CICLO_SOLAR_PeristykhDamon03-Gleissbergin14C.pdf
are you saying they are wrong?

Reply to  henryp
July 19, 2017 11:53 am

are you saying they are wrong?
Just like the ’11-yr’ cycle has a period varying between 8 and 14 years, the GB ‘cycle’ [if real] has a length varying over time between 80 and 110 years. The past 300+ years the period has been about 100 years. Some people claim that in the distant past, the period was at times shorter, e.g. near 90 years, or 88 years, or some number like that. That is perfectly possible. ‘They’ were possibly not wrong. It is definitely wrong to maintain that the GB cycle has been anywhere near 86.5 years at any time in the last 300+ years.

Reply to  lsvalgaard
July 20, 2017 8:42 am

http://oi63.tinypic.com/2ef6xvo.jpg
I am showing your graph where clearly you can see a pattern emerging from 1971 until 2014 (43.5 years)
My own results show a drop in maxima [54 weather stations] exactly from 1971. Too much of a coincidence.
As expected, the solar magnetic forces move up from 2014 [not depicted, do you have the latest correct results?] but to such an extent that a stronger next SC is expected. Hence the 1971-2014 downward trend has been broken.
I predict that for the 43 years [from 2014] we will see 4 SC’s that will be exactly the mirror image of the previous 4 SC’s in respect of the solar polar magnetic forces,
what do you predict?

Reply to  henryp
July 20, 2017 9:06 am

I am showing your graph where clearly you can see a pattern emerging from 1971 until 2014 (43.5 years)
The Sun does not operate by ‘patterns’. If anything, solar activity has been decreasing since the 1950s [with an anomaly in cycle 20]. My graph’s starting point is determined by when we first had accurate measurements. Had we started in 1986 your ‘pattern’ would show a period of 30×2 = 60 years. Had we started in 1952 [which we actually did, but with less accurate data] you would see a 100-yr pattern as the polar fields in the mid-1950s were the strongest ever measured.
do you have the latest correct results?
Yes. SC25 will be a bit [not much] stronger than SC24.
I predict that for the 43 years [from 2014] we will see 4 SC’s that will be exactly the mirror image of the previous 4 SC’s in respect of the solar polar magnetic forces
Again, the Sun doesn’t operate like that, but if there is a ~100 yr period from the 1950s then we would expect a minimum 50 years later [now] and a new maximum 50 years later again in the 2050s.
Get into your head that the past 300+ years there has not been an 86.5 year cycle, but a ~100-yr variation.

Reply to  lsvalgaard
July 20, 2017 10:09 am

leif
I am trying to help and you and others see the light.
Many people here, including myself, including William Arnold, as reported,
have noted the correlation of solar activity with the position of the planets.
To deny the correlation exists is futile.
The periodicity noticed by me appears consistent with the Hale cycle occurring on the sun i.e, 2 successive Schwabe cycles. One Hale cycle makes up for one sine wave quadrant of the GB cycle.
Therefore, under normal circumstances, 8 Schwabe cycles makes up for one GB cycle.
The exception to this rule occurs when there is a prolonged minimum or maximum, presumably /possibly because the barycenter of the weight available is not enough to throw the switch in the sun.

Reply to  henryp
July 20, 2017 10:48 am

I am trying to help and you and others see the light.
Perhaps you think so, but, obviously you cannot see the light that real solar activity shines on you.
You are trying to defend the undefensible against the actual solar data. Whatever reasons or hypotheses you come up with falter of the hard reef of reality. And yet, you persist. Against such blindness there is no cure. I almost think that even if your god appeared and told you there is no 86.5 cycle, you would denounce her.

Reply to  lsvalgaard
July 20, 2017 11:03 am

leif
try playing the ball, not the person
Best wishes to you and all,
Henry

Reply to  henryp
July 20, 2017 11:09 am

Playing the ball seems not seem to be useful in your case, so perhaps playing the person who throws or carries the ball might help [as in Rugby and American Football].
So you slink away, steadfast in your beliefs after having wasted a lot of bandwidth and time. Good riddance, until next time.

July 20, 2017 11:28 am

Leif
I am sure we have all learned something.
At least you admitted that there is a ca. 100 year periodic [weather] cycle [during the past 300-400 years or so] which you previously thought was not probable.
I agree that it is probable that it was 100 years [instead of 87-88 years] if looked at it for this past period. However, IMHO the period looked at is not long enough.
I think this is /was a reasonable outcome / result of this whole discussion?

I do not see it as a waste of time.
FWIW, thanks for your participation.

Reply to  henryp
July 20, 2017 11:36 am

At least you admitted that there is a ca. 100 year periodic [weather] cycle
I don’t know where you dream that up. There obviously is no such climate cycle [as I have said repeatedly]. To wit: the current climate [warm] is very different from the climate 100 years ago [cold]. The use of ‘admit’ [especially since it is false] is not playing the ball, is it?
I agree that it is probable that it was 100 years [instead of 87-88 years]
Try to remember that next time you peddle your 86,5 year ‘cycle’.

Reply to  lsvalgaard
July 20, 2017 12:24 pm

to wit
seems to me the climate 100 years ago was pretty much the same as what it is now:
https://wattsupwiththat.com/2008/03/16/you-ask-i-provide-november-2nd-1922-arctic-ocean-getting-warm-seals-vanish-and-icebergs-melt/
Perhaps it is a matter of a difference in instruments between now and 100 years ago?
87 years is what other people measured in the growth data, as quoted to you, using sophisticated equipment.
I can see 87 coming from the sun, looking at the correct data, for the past 44 years, e.g. maxima, ozone, peroxide, etc. versus declining solar polar field strengths.
I suggest you try looking at it as well.

Reply to  henryp
July 20, 2017 12:33 pm

seems to me the climate 100 years ago was pretty much the same as what it is now:
Not so:
http://www.leif.org/research/US-Temps-since-1900.png
http://www.leif.org/research/Global-Temps-since-1880.jpeg

Reply to  lsvalgaard
July 20, 2017 12:56 pm

leif
100 years ago they used glass mercury thermometers, that were read a few times a day [if you were lucky] and the thermometers were never re-calibrated. We know that in time glass reacts with mercury leaving a deposit, which is why the thermometers must be re-calibrated at regular intervals. The earliest proof of re-calibration I have is from 1948…
Nowadays we use thermocouples connected to recorders that are calibrated and they measure once a second every day and they compute a max, min and average for the day.
You honestly want us to compare measurements now with 100 years ago?
globally…?
You are the one who is comparing apples with pears.

Reply to  henryp
July 20, 2017 1:03 pm

You honestly want us to compare measurements now with 100 years ago? globally…
The standard thermometer up to very recently was the glass thermometer for which “According to British Standards, correctly calibrated, used and maintained liquid-in-glass thermometers can achieve a measurement uncertainty of ±0.01 °C in the range 0 to 100 °C”

Reply to  henryp
July 20, 2017 1:30 pm

Tom Skilling is chief meteorologist at WGN-TV and says:
“Temperature readings taken from precise mercury thermometers in use by the U.S. Weather Bureau in the late 1800s were more accurate than readings provided by today’s electronic thermometers.
Once properly calibrated, a mercury-in-glass thermometer requires no additional adjustment to its readings, so long as the glass bulb that contains the mercury reservoir and its attached expansion tube are undisturbed. Temperature measurements in the late 1800s were accurate to one- or two-tenths of a degree Fahrenheit.
However, readings from those thermometers had to be obtained manually, whereas digital readouts from today’s electronic thermometers are continuously available and can be remoted. The tradeoff for this convenience is accuracy. Most electronic thermometers are considered accurate within plus or minus 2 degrees F., and require maintenance because they gradually go out of calibration.”

Reply to  lsvalgaard
July 20, 2017 1:54 pm

100 yyears ago people were not interested ii measuring accurate to 0.5 degrees never mind. Your 0.01 is nonsense.

Reply to  Henryp
July 20, 2017 2:00 pm

Scientists were very interested. The 0.01 C is not MY 0.01, but the accuracy established by the British Government Standard.

July 20, 2017 1:06 pm

Nowadays we use thermocouples connected to recorders
How many of your infamous 54 weather stations used glass thermometers and how many used thermocouples?

Reply to  lsvalgaard
July 20, 2017 1:50 pm

My sample of weather stations is carefully balanced. 27 x in nh and 27 x sh. All 54 latitudes counted together makes zero latitude. Your global sets are all biased toward nh….
More vegetation traps some heat. See las vegas.

Reply to  Henryp
July 20, 2017 1:51 pm

You evaded the question: how many used thermocouples?

Reply to  Henryp
July 20, 2017 1:58 pm

All
We changed in the 70s to automatic recording.

Reply to  Henryp
July 20, 2017 2:02 pm

First prove that ‘All’ did. How do you know for each station? And the thermocouples are BTW less accurate than the glass thermometers.

Reply to  lsvalgaard
July 20, 2017 2:24 pm

The type of recording i.e intermittent by a person or continuous by a computer is what causes the biggest error.
You cannot compare results from now to those from 100 years ago. Same as ssn. How big is spot? What magnification? Etc
Anyway
I am going to sleep now. Have a good time today.

Reply to  Henryp
July 20, 2017 2:48 pm

Your ignorance is great. Weather stations have thermometers that automatically measure the maximum and minimum temperature. And the ordinary measurements are not ‘intermittent’ but on a very fixed schedule [every three UT hours at the same time all over the world]. The measurements are very comparable to those 100 years ago. In some case even better [no airport tarmac or AC exhaust to content with]. Sunspots are also very carefully measured, e.g. by photographing the sun every day by instruments with the same magnification since 1874 and measuring their area accurately.
You claim to learn something, so take the above to heart.
And you still evade the issue: How do you know that ‘ALL’ your 54 were using the less accurate thermocouples?

Reply to  lsvalgaard
July 21, 2017 6:59 am

We are totally OT now. And we totally disagree.
The subjects we stir should be discussed, in more details, but at the correct opportunity when the subject is relevant.
\ I am suggesting we get back OnT
I am in fact still puzzled about your fanatic denial of the GB cycle [87 yrs] in the light of the overwhelming evidence that I have presented, both in the last 10000 (cycle: 88) and last 100000 (Cycle: 86.5) years
[that represents those investigations]comment image?zoom=2
Above, we are looking at the development of the magnetic field strengths of the sun from 1971.
Supposing there was no turning point at 2013/2014
[as predicted by me from my own results on maxima: at this time we were right in the middle of the GB cycle]
where would you think could we end up with solar magnetic field strengths?

Reply to  henryp
July 21, 2017 8:01 am

I am in fact still puzzled about your fanatic denial of the GB cycle [87 yrs] in the light of the overwhelming evidence that I have presented, both in the last 10000 (cycle: 88) and last 100000 (Cycle: 86.5) years
As i explained, the solar cycles vary in length. The 11-yr cycle has had lengths between 8 and 14 years. The 100-yr variation also varies in length from 50 to 100 years. The past 300+ years it has been a 100-yr cycle.
Supposing there was no turning point at 2013/2014
There is no ‘turning point’. The polar fields are a good predictor of the solar cycle. In fact, the polar fields predicts the cycle about 6 years in advance, so as the sunspots vary, so vary the polar fields. Hence, if the sunspot cycle have had a 100-yr variation, so have the polar fields. The title of my paper on prediction of the cycle reads “Sunspot cycle 24: Smallest cycle in 100 years” [http://www.leif.org/research/Cycle%2024%20Smallest%20100%20years.pdf] because that the long cycle is 100 years: activity now is low, a hundred years ago it was also low and halfway it was high and in another half century it will perhaps be high again. No 86.5 year cycle in sight.

Reply to  lsvalgaard
July 21, 2017 10:09 am

I want to answer but it seems the link to your paper does not work?

Reply to  lsvalgaard
July 21, 2017 1:38 pm

leif says
As i explained, the solar cycles vary in length. The 11-yr cycle has had lengths between 8 and 14 years. The 100-yr variation also varies in length from 50 to 100 years. The past 300+ years it has been a 100-yr cycle.
henry says
You must realize that the true SC is two successive Schwabe cycles. Seems to me Dikpati mentioned a 17-21 year periodicity.
My observation [planets’ position] is 19-23 for the past 4 Hale cycles giving me GB at ca. 88 (3 x 23 + 19)
50 seems ridiculous> cannot be.
Your paper mentions the possibility that SC 25 would be even smaller then SC 24.
i.e. “solar cycle (s)” (sic). This has not happened. Hence, there was a turning point. Around 2013-2014. Must be.
You did not see that coming?

Reply to  henryp
July 21, 2017 2:24 pm

You must realize that the true SC is two successive Schwabe cycles.
Not at all. Each cycle is actually 17 years long and two adjacent cycles overlap. The new cycle beginning several years before the old one goes away.
Seems to me Dikpati mentioned a 17-21 year periodicity.
No, she didn’t. She claimed that each single cycle is 17-21 years long, that being the time it takes for the magnetic field to make one complete cycle from inside the sun to the surface and back again.
50 seems ridiculous. cannot be.
It is more like 100 years currently.
Your paper mentions the possibility that SC 25 would be even smaller then SC 24.
Nowhere do I say that. Quote the exact words to gain some credibility.

July 22, 2017 3:17 am

Leif
Great apology to you. indeed, you did not say it.
The exact quote is:
Several other recent predictions [Schatten, 2003; Schatten and Tobiska, 2003; Badalyan et al., 2001; Duhau, 2003; Wang et al., 2002], but not all [Tsirulnik et al., 1997; Hathaway and Wilson, 2004], also seem to indicate lower solar activity for the coming cycle(s).
Seems we both agree then from each of our own results that SC 25 will be stronger than SC 24.

Reply to  henryp
July 22, 2017 3:20 am

You can be right for the wrong reason.

Reply to  lsvalgaard
July 22, 2017 3:44 am

I gather my own data and do my own investigations. I knew from my own results on maxima that 2014 was a dead end stop.
If your results confirm my own findings I am happy.
Now. The next dead end stop will be in ca. 40 years from now.
Are we both going to be around to see it happening?

Reply to  Henryp
July 22, 2017 3:48 am

Now. The next dead end stop will be in ca. 40 years from now.
More like 50 years, although it is not scientifically correct to base a forecast on cycles. cycle 20 was a good example of the folly of doing so.
Are we both going to be around to see it happening?
No

Reply to  lsvalgaard
July 22, 2017 4:06 am

Leif
I would be 100
maybe I will make it.
You keep focused on Schwabe. What about Hale?
What happens if you average SC’s 23 + 24, 22 + 21, 20 + 19 and 18 +17?
no more funny 20 perhaps?

Reply to  henryp
July 22, 2017 4:15 am

You keep focused on Schwabe. What about Hale?
The Hale ‘cycle’ is in your mind only. The Sun doesn’t know about it. Each Schwabe cycle is a singular event, created from the debris of the previous cycle. As the energy in a magnetic field goes with the square of the field, its sign is irrelevant [minus one times minus one is plus one].

Reply to  lsvalgaard
July 22, 2017 11:33 am

Just to finish off here: I think we are all agreed that there is no monster minimum approaching? The next dead end stop of the sun is 40 years from now, or perhaps even 50 years as Leif beliefs, IMHO that could only happen if there would be a prolonged maximum [40 years from now]. I cannot exclude that possibility, after all we have evidence of a period about 1000 years ago when a great part of Greenland was really green [evidence of some settlements from that period only becoming visible now. as the snow melts…]
True enough, I am still in the dark as to whether the positions of the planets, which clearly show correlation with solar activity (SA), are cause to or because of SA.
If the planets’ positions are cause to the SA, I can imagine a problem arising if something happens to one of them….
[only Jesus [God] predicts that just before the end of the world [i.e. the end of time\ ] the days will become shorter.]

Reply to  henryp
July 22, 2017 11:40 am

The next dead end stop of the sun is 40 years from now, or perhaps even 50 years as Leif beliefs, IMHO that could only happen if there would be a prolonged maximum [40 years from now].
If there are real cycles [not a given], there might be a number of large solar cycles about 50 years from now [100 years after the previous batch of large cycles and 200 years after the batch before that and 300 years after the batch before that again. The planets have nothing to do with that.