Guest essay by David Archibald
The people of Canberra are the richest in Australia so they voted in a provincial government that proved how virtuous they were by increasing the proportion of their power supply that came from wind and solar sources. As a consequence, the cost of power went up and the people of Canberra have responded by seeking out warm public buildings in the current southern winter. Respiratory disease load increases in winter and so no doubt there will be some deaths caused by the government’s virtue signalling.
Hundreds of thousands of people in first-world-country Germany have gone off grid because they can’t afford power any more. Of course heat kills too and the biggest heat-related, first-world die-off in recent years was in Europe in 2003. As Dave Rutledge wrote in 2015, “During the great European Heat Wave of 2003, 70,000 people died, most of them indoors. This is a horrible way to die. The people who were indoors could have been saved by a $140 Frigidaire window unit, but only if they could afford to pay for the electricity.”
All the energy that drives the Earth’s climate system comes from the Sun. So could there have been a solar component to the 2003 event? A number of solar parameters suggest there might have been:

Figure 1: Solar Wind Plasma Temperature 2000 – 2017

Figure 2: Solar Wind Plasma Speed 2000 – 2017
Figures 1 and 2 show a big excursion in 2003, the year of the killer European heatwave. Supporting evidence comes from the F10.7 flux plotted against sunspot area:

Figure 3: Hemispheric Sunspot Area and F10.7 Flux 1985 – 2016
The F10.7 flux closely follows sunspot area except for an excursion in 2003 during which the F10.7 flux peaks much higher. What could have caused Europe to have had its own heat wave and not affect most of the rest of the planet? Climate does respond to higher levels of solar UV as described by this paper by Haigh et.al, in 2005 which states:
The results clearly show a weakening and poleward shift of the jets when the sun is more active, again, as predicted by the model studies. The GCMs also predicted a response to higher levels of solar UV in the tropospheric mean meridional circulation. This consisted of a weakening and expansion of the Hadley cells and a poleward shift of the Ferrel cells. It is interesting to note that precisely these features, which are highly correlated with solar activity, have now been detected in NCEP–NCAR vertical velocity data (Gleisner and Thejll 2003).
Now it seems the opposite is happening with EUV dropping rapidly over the last two years as shown by the Lyman Alpha solar index:

Figure 4: Lyman Alpha Solar Index solar cycles 22, 23 and 24 aligned on minima
The Lyman-alpha line is a spectral line of hydrogn emitted when the electron fall from the n=2 orbital to the n=1 orbital, where n I s the principal quantum number. It is in the vacuum ultraviolet part of the electromagnetic spectrum and thus measurement of solar Lyman-alpha emissions are made by orbiting instruments. Sunlight in space at the top of Earth’s atmosphere is composed of about 50 percent infrared light, 40 percent visible light, and 10 percent ultraviolet light, for a total intensity of about 1,400 W/m2 in vacuum. At ground level sunlight is 44 percent visible light, 3% ultraviolet and the remainder infrared. The atmosphere blocks about 77 percent of the Sun’s UV, almost entirely in the shorter UV wavelengths.
The significance of Figure 4 is that it shows that EUV has fallen to levels of solar minima. Generally, weak solar cycles, such as Solar Cycle 24, are long cycles. If Solar Cycle 24 ends up being 12 years long, which would take it to the edge of the graph, then it has another three years to go. Therefore, it is most likely that the solar minimum is going to be long, deep and relatively spotless. The Hadley cells will contract and strengthen, according to theory. It is also possible, though unlikely, that Solar Cycle 24 will be weak and short, as predicted by Ed Fix’s solar model. Either way, we have the promise of interesting developments.
David Archibald is the author of American Gripen: The Solution to the F-35 Nightmare
This is how it appears to work:
http://joannenova.com.au/2015/01/is-the-sun-driving-ozone-and-changing-the-climate/
Wilde’s logic seems reasonable but stratosphere temps in the latter part of 20th c. were dominated by volcanic events, which also cause ozone destruction.

Note the two persistent drop after each event once the initial perturbation subsides. This is probably attributable mainly to reduced ozone. We should then be looking for the effect of the persistent increase in UV energy entering the lower climate system about four to five years after eruptions.
https://climategrog.wordpress.com/uah_tls_365d/
The late 20th c. warming which had everyone crapping their pants was probably mostly due to natural causes and models have been inappropriately “tuned” to produce a similar long term rise from CO2 and other GHGs.
If this was attributed to changes in stratospheric composition there would be not “missing heat” problem.
If half the warming was volcanic and half was GHG, the models would be running about right.
Unfortunately the current dogma only recognises volcanoes as cooling events and before that dogma changes at least one generation of climatologists will need to grow old and die. As we all know, science advances on funeral at a time.
Greg.
I considered that but it looks more like the volcanic effects were just short term interruptions in a longer trend.
The difficulty that a lot of naysayers have is that a plethora of observed system changes occurred around 2000 as the sun came down from the peak of cycle 23 whereas changes in the opposite direction occurred during the climate shift of the 1970s when the sun was recovering from lower cycle 20.I have listed those changes many times previously.
David is right that the evidence supports a solar effect.
Joanna Haigh is correct to pinpoint latitudinal climate zone shifting.
The unique component of my proposal is that it requires an opposite ozone response to solar variability above and below about 45km and also an opposite response above the poles as compared to the equator.
One needs those responses to differ in the way I have described in order to get the gradient of tropopause height between equator and poles to vary in the way actually observed.
No other proposal adequately accounts for zonal jets with poleward shifting when the sun is active plus meridional jets with equatorward shifting when the sun is quiet.
My proposal also fits observations during the Mediaeval Warm Period and the Little Ice Age.
I have been promulgating this for some time now and there have been no substantial objections thus far.
The unique component of my proposal is that it requires an opposite ozone response to solar variability above and below about 45km and also an opposite response above the poles as compared to the equator.
And what would be the cause of that required ‘opposite response’?
lsvalgaard.
Solar variations have different effects above poles and equator and above and below 45km. The effects concerned alter the balance of the ozone creation/destruction process differently in different locations.
Haigh has reported that apparently there was indeed an opposite ozone response to that expected above 45km for a period of years up to 2004 such that various assumptions would need to be reassessed.
I am awaiting updated data for the period 2004 to date but it appears not to have been released thus far.
here was indeed an opposite ozone response to that expected above 45km for a period of years
You did not respond to my inquiry. What is it in your ‘theory’ that requires this? what is the cause of this requirement?
Greg
Where was the ozone destruction recorded?
Lsvalgaard
The observation that ozone above the poles fell when the sun was active and stabilised and may be recovering now that the sun is less active.
Conventional thinking expects ozone to increase when the sun is active.
To account for observations there needs to be a fall in ozone creation relative to destruction above the poles and at higher levels when the sun is active and an increase when the sun is less active.
It was observed that ozone above 45 km increased above 45 km when the sun became less active which fits my hypothesis but not the conventional wisdom.
Without numbers all you have is hand waving. Granted that hand waving is the most commonly used argument, it still leaves [at least] me totally unconvinced, having seen so much ineffective hand waving in my time.
Repeated changes in trends are as good as numbers for diagnostic purposes.
I have repeatedly given you examples of changes in trends that would invalidate my hypothesis.
None have happened yet.
None have happened yet
You will say that, no matter what happens, as you have said in the past.
The dataset you are clinging has not been updated the last 14 years. Perhaps you should look for a newer one.
Funny that a data set with an unexpected/inconvenient finding has not been publicly updated for 14 years.. Makes you think,does it not?
However there is evidence that ozone has continued to recover despite the quiet sun so presumably ozone above 45km continues to increase and get drawn down through the polar vortices.
You”d think there would be interest in such events wouldn”t you?
Since I raised the issue with Joanna Haigh she has remained silent.
Curious.
Perhaps she is no longer supporting her earlier claims. It is rare that scientists when they are wrong actually admit it. Usually they just quietly move on…
So where is it shown that the data she used was wrong?
Thanks for explaining why you would never admit error😉
Lsvalgaard
If one of them happened I would acknowledge it. Which kdo you think has gone into reverse?
Do you even remember any of the indicators that I said would cause me difficulty?
no, because they were moving targets. And not quantifiable [no numbers or error bars].
Handwaving.
Changes in trends are clear enough for diagnostic purposes.
Stephen, how much ozone is there above 45 km? According to my information, at this altitude you are back to below tropical surface levels.
Stephen Wilde
There is no “trend”. That is a misinterpretation by those who insist on drawing straight lines through everything in climate and stems from a conscious or unconscious assumption that a steady rise in CO2 is behind everything which happens.
There are two punctual events, clearly attributable to the eruptions, which result in an initial warming of TLS and persistent step down. NO TREND.
If you read the linked article, this step nature of the changes is recognised. This may have had a knock on effect on the jet streams along the lines of what you suggest.
And the Sixties were plagued by the effects of Agung as well, however we do not have the luxury of the satellite data to see the global effects in the Stratosphere associated with Agung.
Greg, it’s mind boggling that scientifically minded people cannot see the two step changes in the reduction of stratospheric temperatures of an aggregate amount of 1 deg. Kelvin. that are clearly associated with two volcanic eruptions. And the temperature drops are clearly associated with an energy balance difference between the troposphere and stratosphere. There is no doubt that the SO2 conversion SU has caused ozone destruction but equally important are changes in Stratospheric water vapor content caused by those two eruptions that caused a net warming event. People just look at the data in a drooling catatonic state and chant “Volcanoes cause short term cooling”, it is nothing but unsubstantiated hand waiving, especially when there are so many studies that point to an unsolved anomaly in our understanding of climate.
https://phys.org/news/2010-01-stratospheric-vapor-global-wild-card.html
http://journals.ametsoc.org/doi/pdf/10.1175/1520-0442%282003%29016%3C3525%3AAGSOVE%3E2.0.CO%3B2?origin=publication_detail&
it’s mind boggling that scientifically minded people cannot see the two step changes in the reduction of stratospheric temperatures of an aggregate amount of 1 deg. Kelvin. that are clearly associated with two volcanic eruptions.
I’ll tend to agree with this.
The step changes are very unlikely to be solar related.
lsvalgaard
They are almost certainly not solar related, but how could we possibly correlate surface temperatures with any type of forcing if we cannot detangle all of the natural effects that impact radiative transfer of the various levels of the atmosphere?
It is indeed tough, but removing some of the blinkers people have might be a first step.
Well I would wonder what you folks think of this research:
The natural oscillations in stratospheric ozone observed by the
GROMOS microwave radiometer at the NDACC station Bern
http://www.atmos-chem-phys.net/16/10455/2016/acp-16-10455-2016.pdf
Platt
Thanks for that.good find.
Someone is apparently now looking in the right places and that article supports my proposition of differential ozone responses at different heights and latitudes as a result of solar variations.
In my hypothesis that has an effect on the gradient of tropopause height between equator and poles so as to alter global cloudiness as per my submission.
supports my proposition of differential ozone responses at different heights and latitudes as a result of solar variations. In my hypothesis that has an effect on the gradient of tropopause height between equator and poles so as to alter global cloudiness as per my submission.
In both cases you do not provide a reason for your submissions. How does a solar variation result in the ozone responses? what is the mechanism? How does the gradient alter global cloudiness? etc.
As I said, your ideas are so vague that anything whatsoever is supportive of your ideas, because they are so elastic that anything goes.
Nonsense.
The differential ozone responses are due to changing photochemistry at upper levels due to variations in the mix of particles and wavelengths from the sun.
Changes in the gradient of tropopause height allow
Zonalty/ meridionality changes in jet stream tracks which causes cloudiness changes.
Try reading my material again.
There is nothing vague about such changes since they have been well enough documented and readily explain a wide variety of different characteristics between the MWP and LIA.
The differential ozone responses are due to changing photochemistry at upper levels due to variations in the mix of particles and wavelengths from the sun.
This is the usual non-responsive nonsense. What particles are you talking about causing what changes in the photochemistry? The ‘mix’? what is changing over the cycle? etc.
One doesn’t need to particularise for the purpose of a mere hypothesis. Changes in the ozone creation/destruction balance are obviously occurring and that is obviously involving solar influenced photochemical reactions.
You are just being obtuse.
Research findings are going my way and you don’t like that.
No one else afaik has previously suggested the gradient of tropopause height as a significant climate indicator.
One doesn’t need to particularise for the purpose of a mere hypothesis.
If to be taken serious, you do need to be particular and to identify the process and the ingredience. Otherwise your claims are just empty.
No one else afaik has previously suggested the gradient of tropopause height as a significant climate indicator.
So there is no evidence or studies of this.
I have described the process in general.
It should be easy to check.
Indeed, that 2016 paper pretty much confirms it.
Having put forward my proposition in 2010 I am patiently waiting for the rest of you to catch up.
Many are doing so but I suspect you will be the last.
I have described the process in general.
No, you have not. And what is needed is the particulars [if you have any].
You are in denial,sadly.
Yes I deny that you have described anything in meaningful detail.
Again: what particles, what ‘wavelengths’, what mix, how does the mix change, what is the ozone response, how does the gradient change global cloud cover.
If you had any clue whatsoever, it should be easy to explain.
UV and NO are prime candidates because each varies with solar activity. Other chemical reactions will also be involved.
More meridional jets involve longer lines of air mass mixing and thus more clouds.
granted I’m not a scientist, though I have children who are – why wouldn’t any major eruption have this affect? re: Mt. St. Helen’s – 1980, VEI 5 – same VEI as El Chicion in 1982. I’d mention Mt. Hudson VEI 5+, but it was also 1991 as was Pinatubo’s VEI 6. Chile’s Mt. Puyehue-Cordon Caulle was also VEI 5 in 2011- but also doesn’t show a coinciding dip on this graph.
And not the only step changes it would seem. Some appear to happen a while later.
that article supports my proposition
The article considers that the changes are just internally excited, nothing to do with the Sun.
“Offermann et al. (2015) have proposed self-sustained oscillators in the atmosphere for the first time to support the theory that the oscillations they studied are excited internally in the atmosphere. They stated that the periods and phases observed might be interpreted as synchronisation effects that are typical of non-linear oscillators.”
They refer to changes in photochemistry at the higher levels.
If they think that is internally generated then they are wrong.
At the lower levels they consider transport mechanisms to be responsible and in relation to that they would be correct.
If they think that is internally generated then they are wrong.
and yet you claim they support your ideas…
As I said: right or wrong, everything supports your position.
They support the reversed ozone response at higher levels.
Not my fault if they don’t associate changes in photochemical behaviour in the upper atmosphere with changes in solar activity,
How do you think changes in photochemistry in the upper atmosphere could be generated internally (barring volcanic injections)?
How do you think changes in photochemistry in the upper atmosphere could be generated
And how do you think they are generated by the varying mix of particles and ‘wavelengths’? Now, no hand waving. Numbers and physics, please.
The physics is plain in that insolation especially uv radiation and solar protons affect ozone quantities.
Numbers are not yet available but correlations are being investigated as per that article and many others.
One thing is certain, you cannot have meridional/zonal changes in the sizes positions and intensities of climate zones and their associated pressure cells without changing the gradient of tropopause height between equator and poles.
Ozone in the stratosphere is a primary determinant of tropopause height.
The physics is plain in that insolation especially uv radiation and solar protons affect ozone quantities.
That is not the point. Everybody knows that. But how does the variation of those things specifically control your stuff, or do you simply say that it is not your idea and that you bring nothing new to the table?
My work covers that.
When the sun is active, ozone falls above 45km and towards the poles so that the stratosphere cools , the polar tropopause rises and the jets move poleward to become more zonal with less clouds.
At the same time, ozone rises below 45km and towards the equator so that the stratosphere warms, the equatorial tropopause falls which supplements the polar effect in pushing the jets poleward.
When the sun is less active the opposite occurs.
That is how you get the observed changes between the MWP. The LIA and the current warmth.
Are you getting it yet?
You have purportedly a whole chain of responses that must be followed from the first or primary input though several links to the final outcome. If anyone of those links are broken, the whole chain fails apart.
The standard way of addressing this is to go slow: deal with one link at the time. So, if what you say above the first link:
When the sun is active, ozone falls above 45km and towards the poles so that the stratosphere cools , the polar tropopause rises and the jets move poleward to become more zonal with less clouds.
is not true, we are done and need not look at the rest. So, if the link were true then there should be a strong solar cycle variation in 1) O3 above 45km, 2) temp of stratosphere, 3) tropopause height, 4) jet latitudes, 5) and clouds. Those are five variables to investigate and they must all show a marked solar cycle variation as you outlined. So, to gain and keep credibility, what you need to do is to show that all five of them actually do that the way you posit. That is your task at this point in time, prior to any further discussion. If you complete the task successfully, we shall go on to the next link in the chain, and so on. This is how science works, so get on with it.
Reasonable points but note that over a single solar cycle there is too much disruption from the effects of ocean cycles for the solar effect to be sufficiently pronounced to measure.
I have always contended that one needs to observe across multiple solar cycles for the solar effect to become clear.
Best of all is to look at the multicentennial periodicity such as from MWP to LIA to date.
As for the further work that you recommend I do agree that that is the way forward but it is beyond my personal resources to conduct it.
Instead, having provided the hypothesis I expect the professionals to get on with it and indeed some are working along the same track but as yet have failed to propose a similarly plausible overview.
Over the past ten years,however, the data that has come to light has been consistent with my hypothesis. In particular, the unexpected reverse sign ozone response to solar variations at higher levels.
Interesting that my hypothesis also deals with the ozone scare that led to the Montreal Protocol.
If I am right both that Protocol and the various climate treaties were unnecessary and misguided.
Reasonable points but note that over a single solar cycle there is too much disruption from the effects of ocean cycles for the solar effect to be sufficiently pronounced to measure.
We have data for many solar cycles, so get on with it.
At least you now see that my hypothesis should be easy to prove or disprove, contrary to your previous assertions.
Reasonable points but note that over a single solar cycle there is too much disruption from the effects of ocean cycles for the solar effect to be sufficiently pronounced to measure.
If it is easy, do it.
I don’t have the resources or access to the data that the professionals have but that said the evidence is already staring you in the face as per my response to your 5 points.
No, I already showed you the failure of your first step.
If the ‘evidence’ is staring us in the face, you should be able to provide a link to each of the pieces of evidence. We are waiting.
There is no failure of the first step. That paper revealed the reverse sign ozone response at higher levels where photochemistry dominates. You only referred to their comments on the lower levels where transport effects dominate.
You only referred to their comments on the lower levels where transport effects dominate.
Nice try, but the article and my comment specifically refers to the upper stratosphere [above 40km].
They say that in the upper atmosphere a rising temperature accelerates the ozone destruction process.
That happens each spring.
It would also happen at a time of increased solar activity.
Thus a fall in ozone when the sun is active and a recovery when the sun is less active.
That is what was observed in the measurements that Haigh referred to in the period up to 2004 and which have apparently not been updated.
That is contrary to the established view that a more active sun leads to more ozone.
That is contrary to the established view that a more active sun leads to more ozone.
The established view is based on decades of observation since the 1970s.
Quite so 😄
The observations since the 1970s never distinguished between the solar effect on ozone at different heights and latitudes with the consequent effect on the gradient of tropopause height between equator and poles.
The science has now advanced and I have drawn the logical conclusion and applied it to the climate conundrum.
Successfully, it appears.
The observations since the 1970s never distinguished between the solar effect on ozone at different heights
In fact they did “From 1979 until the late 1990s, all available data show a clear decline of ozone near 40 km, by 10%-15%. This decline has not continued in the last 10 years. At some sites, ozone at 40 km appears to have increased since 2000, consistent with the beginning decline of stratospheric chlorine. The phaseout of chlorofluorocarbons after the International Montreal Protocol in 1987 has been successful, and is now showing positive effects on ozone in the upper stratosphere”
There is thus evidence that the recent stop of the decline is not solar related at all, but due to man-made changes of the composition.
The fact that the cessation of the decline in ozone above 45km was associated with a shift of the jets and a cessation of the trend towards reducing cloudiness at the same time as the warming pause commenced suggests that the ozone changes were solar induced after all.
All those changes occurred when the sun became less active at the end of cycle 23.
Furthermore such changes are similar to changes between MWP, LIA and the present which further supports solar causation.
The decline in ozone above 45 km when the sun was more active was incorrectly attributed to human emissions of cfcs.
The above paper says nothing about cfcs or the Montreal Protocol in discussing the relevant ozone variations.
You are the one who has some explaining to do.
All those changes occurred when the sun became less active at the end of cycle 23.
The Sun is less active around each and every solar cycle…
One solar cycle is generally not enough due to the fact that ocean cycles sometimes offset and sometimes supplement solar effects.
It seems that at the end of cycle 23 the ocean effects were not sufficient to obscure the effect of the decline in solar activity.
The jets became more meridional, the warming pause began, global cloudiness stopped decreasing, ozone in the stratosphere started to recover.
All you can do is speculate that those changes were a result of the Montreal Protocol.
You get a grade F for that.
One solar cycle is generally not enough due to the fact that ocean cycles sometimes offset and sometimes supplement solar effects.
When it comes to the effect on ozone above 45km, the oceans have nothing to do with it. Show me a link that demonstrated that the oceans control the ozone response about 45km…
Of course the oceans do not control ozone above 45km.
However they do affect tropopause heights from below and towards the equator and so provide a separate forcing element that can oppose or supplement the top down solar effect on tropopause heights.
However, on timescales longer than ocean cycles such as from MWP to LIA to date the solar influence dominates but you need multiple solar cycles to discern the trend.
However they do affect tropopause heights from below and towards the equator and so provide a separate forcing element that can oppose or supplement the top down solar effect on tropopause heights.
So, now you are claiming that the climate of the oceans controls the climate.
Let us stick with one thing at a time: the change of the ozone response above 45km. Since it clearly is not of solar origin [the sun has not changed significantly], you are now admitting that the stop of the decline is due to climate change mediated by the oceans. That is certainly possible, although you have not shown how it could come about. Much more likely is the man-made changes of the composition, e.g. the recovery of the ozone hole.
If you think clearly you should see that my above comments are adequate.
The output of the sun clearly dominates the photochemistry above 45km and I have given reasons for doubting a significant human component such as our cfc emissions.
If you think clearly you should see that my above comments are adequate.
The output of the sun clearly dominates the photochemistry above 45km
The adequacy of your comments are not contingent on my thinking.
There is no disagreement that the Sun dominates photochemistry, but is clearly not the reason the decline in ozone that stopped or even reversed. The reason for that has to be found elsewhere.
Why is it clearly not the reason?
Read this and learn:
http://www.leif.org/EOS/Stolarski-2012-Upper-Stratosphere-Ozone-Chlorine.pdf
“[29] We have shown that the available data from the Nimbus 7, UARS, and Aura satellites confirms the predicted dependence of the ozone-temperature correlation slope on chlorine amount. This predicted dependence is a result of the temperature dependence of the ozone loss due to chlorine oxides being less than that due to either pure oxygen reactions or hydrogen oxide catalysis. We have shown that the ozone-temperature relationship in the upper stratosphere from our simulations changes with the addition of chlorine oxides that catalyze ozone destruction in a manner consistent with observed changes in the relationship.”
“[2] The addition of anthropogenic ozone-depleting substances (ODSs) to the atmosphere has led to a global
decrease in stratospheric ozone [e.g., Stolarski et al., 1992]. The Montreal Protocol, signed by all of the countries of the world, limits the production of these ODSs [Velders et al., 2007]. The result has been a peak in the stratospheric amounts of the chlorine and bromine molecules that cause ozone destruction [Newman et al., 2007]. The observed decline in ozone has slowed, and annually averaged ozone column amounts have been nearly constant for the last decade [WMO, 2011, chap. 2].”
Yet the paper we were discussing linked the temperature change in the upper stratosphere which altered the rate of ozone creation to seasonal changes in solar photochemistry and not fluorocarbons.
The truth is that the balance of ozone creation/ destruction is actually related to solar activity and is in constant flux.
It is hardly likely that just as we started measuring ozone the process suddenly became dependent on human emissions.
The truth is that the balance of ozone creation/ destruction is actually related to solar activity
Of course it is ‘related’ to solar activity and that is why the reversal of trend is not due to the sun as the Sun has not changed. The stratosphere has. “the temperature dependence of the ozone loss due to chlorine oxides” has changed because of the Montreal protocol dating just from the time of the reversal. This is not hard to understand. I’ll give you a B+ once you admit that you have reached that understanding.
Your desperation to deny any solar variability sufficient to affect climate is leading you into progressively more unlikely scenarios.
Perhaps you could skip the ad-homs for a while and stick to the science: We are still educating you on the ozone response.
deny any solar variability sufficient to affect climate
If you have been paying attention you might see how wrong you are that. I advocate a climate effect of the order of 0.1K due to the variation of TSI with the solar cycle. Answer back that you now acknowledge that you were wrong on your assertion.
You now seem to be proposing that it was cfcs that cause climate change by shifting the jet stream tracks rather than co2 altering the radiative balance.
That is a novel suggestion.
The jet stream tracks have always varied naturally so why would the laws of physics suddenly change when we started measuring fluorocarbons?
You now seem to be proposing that it was cfcs that cause climate change by
We’ll come to the jetstream in due course. For now we stick with the ozone response and solar activity, until you have understood what is going on with that.
There will be no meeting of minds between us until you accept the extent to which climate change has always arisen naturally and that such changes did not suddenly start happening when we became able to measure various minor atmospheric constituents.
You are determined to attribute climate variability to humans one way or another so there is no point continuing this discussion.
You are determined to attribute climate variability to humans
Not at all. Perhaps you could learn something from
http://www.leif.org/research/Climate-Change-My-View.pdf
Come back when you done so.
I’m familiar with all that.
You are just hedging your bets in that article whilst continuing to assert that solar effects are irrelevant to climate variability whereas there is a growing acceptance that there is some sort of amplification process in the background that makes small solar variations significant.
I have provided a plausible cloud/albedo amplification process which fits the available observations.
If you want to say that those observations are a result of our cfc emissions then you have work to do.
You are just hedging your bets in that article whilst continuing to assert that solar effects are irrelevant to climate variability
As I said: solar effects cause a ~0.1K climate variation every solar cycle.
I have provided a plausible cloud/albedo amplification process which fits the available observations.
You are drifting into D-K syndrome territory…
And you have still not grasped the science behind the ozone response above 45 km, therefore the rest of your argument falls flat as it most when the premise is false.As I said: ket us stick with that premise and sort that out first before basing anything on it. Failure or refusal to do so is not helpful and will just leave you stuck.
The confusion is on your part in accepting the proposition that cfcs trump solar variability in affecting the ozone balance in the upper stratosphere.
We cannot get past that.
We have previously agreed that the small solar effect that you do accept is not sufficient to account for observed climate variability.
Hence my albedo based hypothesis which provides the necessary amplification.
As for ad hominems, I see far more from you than from me.
The confusion is on your part in accepting the proposition that cfcs trump solar variability in affecting the ozone balance in the upper stratosphere.
We cannot get past that.
Perhaps the existence of the ozone hole caused by cfcs is an indication of what is going on. If you can’t get past that, it is your loss. As the Stolarski paper concludes:
“[32] Ozone increases in the coming decades are expected from a combination of the decrease of chlorine in the stratosphere and the cooling due to the increase of GHGs in the stratosphere [see, e.g., Li et al., 2009]. ”
Hence my albedo based hypothesis which provides the necessary amplification.
Necessary for what? Observations over the last 200 years show that the solar impact of climate is minute to the point of being undetectable.
Since the jets have changed their behaviour in the past with consequent cooling or warming and since the jets cannot change their behaviour in such a way without changing the gradient of tropopause height between equator and poles it follows that stratospheric ozone has varied significantly in the past from natural causes.
It is unlikely that humans became the primary cause at the very moment we started to measure such changes.
We are not changing the subject. We are still on the ozone response. Here you have all we know about the ozone as per the WMO:
http://www.leif.org/EOS/2014OzoneAssessment.pdf
Study its 416 pages carefully, especially section 4.
They say:
“In the upper stratosphere there is a clear recent ozone increase, which climate models suggest can be explained by comparable contributions from declining ODS abundances and upper stratospheric cooling caused by carbon dioxide increases.”
which suggests that they are relying on models that do not attribute a significant role for solar variability.
There is nothing to prove demonstrably that the cause of the ozone recovery is indeed due to the Montreal Protocol. They simply make that assumption.
The fact that the change in ozone trend in the upper stratosphere awaited the end of cycle 23 rather than happening much sooner tends to suggest solar causation.
The Protocol came into force as long ago as 1989 but no atmospheric response appears to have been observed until around 2000.
The issue of solar causation remains in play.
Have now reviewed section 4 in more detail as suggested.
Interesting to see that overall it substantiates what I have been saying for the past ten years about changes in the meridionality of jet stream tracks being a useful diagnostic indicator of ongoing climate variations.
The issues that I would raise are:
i) Changing jet stream tracks imply a change in the gradient of tropopause height between equator and poles
ii) Rather than going into such detail about individual atmospheric constituents one can simply use my solar based hypothesis which fits the observations equally as well as the proposed convoluted and speculative effects on ozone of a plethora of man made constituents whose net effect is highly speculative.
iii) Since jet stream shifts occurred from MWP to LIA to date on a purely natural basis and since there is reasonable correlation with solar activity levels (not perfect due to ocean cycles) it is far more likely that the cause is and always was solar.
That entire paper is based on the unwise assumption derived from models that, as soon as we became able to take measurements, the effects of human emissions came to be the primary driver of climate variability.
I suggest that you and all the other authors take a step back and reconsider solar variations afresh in the way I propose.
If you think clearly you should see that my above comments are adequate.
The output of the sun clearly dominates the photochemistry above 45km and I have given reasons for doubting a significant human component such as our cfc emissions.
One solar cycle is generally not enough due to the fact that ocean cycles sometimes offset and sometimes supplement solar effects.
It seems that at the end of cycle 23 the ocean effects were not sufficient to obscure the effect of the decline in solar activity.
The jets became more meridional, the warming pause began, global cloudiness stopped decreasing, ozone in the stratosphere started to recover.
All you can do is speculate that those changes were a result of the Montreal Protocol.
You get a grade F for that.
It was the failure to distinguish the different solar effects on ozone amounts at different heights and latitudes that led to the incorrect assumption that the ozone decline was caused by our CFC emissions.
The principle that correlation does not equal causation was ignored.
In the light of recent observations one would need to propose that our cfcs were also responsible for shifting the jet stream tracks and reducing global cloudiness tracks because they are linked to the distribution of ozone in the stratosphere. That is distinctly unlikely given that shifting jetstream tracks occurred during the MWP and LIA without human intervention but in correlation with solar variability after smoothing out the effect of ocean cycles.
So you are wrong. The ozone changes around 45km were noted but the possibility of solar causation via photochemistry changes was dismissed in favour of a careless assumption of human causation.
The ozone changes around 45km were noted but the possibility of solar causation via photochemistry changes was dismissed in favour of a careless assumption of human causation.
What have changed is not the Sun. Its activity goes up and down. And the ozone simply responds to that with almost no delay. What has changed is the stratosphere, and that very likely due to man-made forcing of different sorts.
That doesn’t wash. You have just thrown up your hands and vaguely declared human causation with no adequate proof whatever.
That doesn’t wash
Always show my exact words that you object to. Here are some of them again for you to savor:
Solar activity goes up and down, and so that the ozone response. Any change in that response is highly unlikely to be solar related [why did the laws of physics change just when we are looking]. What has is the composition of the stratosphere. Volcanoes and man-related activities [e.g. fluorocarbons] change the the composition.
You have already accepted that the photochemistry of the ozone creation/ destruction balance is affected by solar variability.
That paper confirms that the effects vary at different heights and latitudes.
I have told you that such differential effects will inevitably alter the gradient of tropopause height between equator and poles.
The consequence is climate variability as per my hypothesis.
You have already accepted that the photochemistry of the ozone creation/ destruction balance is affected by solar variability.
But you have not accepted the consequence of that: that the ozone response must follow the solar cycle.
And if the response changes qualitatively some other agent than the sun is at play [e.g. man-made changes].
Now is the time for you to do that.
My reply seems to have been inserted at the end of the thread.
You can easily find it for yourself.
No, I have tried. There is no evidence for your positions, so pony up with “what is staring us in the face”, if you can. If not, don’t bother.
Addressing those 5 specific links in the chain of causation:
1) Ozone above 45km has been observed to increase at a time of more active sun.
2) Temperature of stratosphere stopped cooling around 2000 as the sun became less active and ozone above 45km increased.
3) Tropopause height data is required but note that for more meridional jets to have developed it follows that the heights must have changed.
4) many have recognised that the jets have become more meridional recently.
5) Earthshine data shows that cloudiness stopped increasing around 2000
Additionally we have the temperature pause so my hypothesis is well on the way to being proved by real world events.
Whoops
Ozone above 45km has been observed to increase at a time of LESS active sun.
wildeco2014 July 5, 2017 at 8:03 pm
ozone above the poles fell when the sun was active and stabilised and may be recovering now that the sun is less active.
So you think, but the article that you say supports your position states the opposite:
“we note an increase (reduction) in ozone during the solar maxima (minima) period”
yet, you as usual claim that everything whatsoever supports your ideas. Go figure…
That refers to the lower levels dominated by transport mechanisms.
They appear to find that the upper levels dominated by photochemistry have the opposite ozone response.
Jo’s article is interesting and raises something I’ve always pondered..
Now we know how people characterize IR as ‘heat’ mainly as they know heat well even though it’s the intensity of the radiation from a fire that warms us, not the wavelength – but beyond that mostly people know IR as heat as a hangover from the times when light was termed visible, actinic or thermal..
Sure CO2 absorbs a small portion of the incoming IR, but at 0.04% that absorption can’t raise the energy state of the air in it’s entirety a heck of a lot – but what of the substantial mass of air that’s nitrogen and oxygen? We’re used to hearing that air ‘blocks’ incoming UV.. sure it does, by absorbing it – 99% of the atmosphere absorbs a portion of the incoming UV – and this means it’s energy state is raised, and from the above link suggesting solar emission UV levels vary as much as they do, I’d imagine that totally swamp any variance in CO2 levels.
The F10.7 flux closely follows sunspot area except for an excursion in 2003
It is not just 2003 but every year since about 1996 that the F10.7 flux has exceeded the level usually expected from past sunspot numbers and areas. This is well-known:
http://www.leif.org/research/Solar%20Radio%20Flux.pdf and
http://www.leif.org/research/AGU%20Fall%202009%20SH13C-03.pdf and
I have to respect a person who says “it’s well-known” then references his own work!
Seriously, I have no idea whether you are right or wrong, but I do know that most scientists are mostly wrong most of the time – of course that may take decades or even centuries to be shown, but an acknowledgement every now and then that what you think you have proven could be disproven tomorrow would be welcome.
Science should never be presented as so certain: to do leads us to any number of bad behaviours.
I have to respect a person who says “it’s well-known” then references his own work!
Good that you give credit where credit is due.
On the F10.7 well-known anomaly you might also consult:
Changing Relationships Between Sunspot Number, Total Sunspot Area and F_{10.7} in Cycles 23 and 24, by
Tapping, Ken; Morgan, Carly, Solar Physics, Volume 292, Issue 6, article id. #73, 14 pp., 2017, referencing their earlier work from 2011:
Did the Sun Change Its Behaviour During the Decline of Cycle 23 and Into Cycle 24? by
Tapping, K. F.; Valdés, J. J., Solar Physics, Volume 272, Issue 2, pp.337-350, 2011
And:
Lukyanova, R.; Mursula, K.: Changed relation between sunspot numbers, solar UV/EUV radiation and TSI during the declining phase of solar cycle 23, Journal of Atmospheric and Solar-Terrestrial Physics 73, 235-240, 2011
Mean sunshine duration in Germany 2003: 2038 h = 510 h above normal = 33%
Source
PS
Another paper concernig summer 2003
Factors contributing to the summer 2003 European heatwave – DOI: 10.1256/wea.74.04
Link correction, sorry
Factors contributing to the summer 2003 European heatwave
Talks about the fast solar wind in 2003 and then changes the subject to UV. Bizarre.
I hope people realize that you cannot link a single heat wave (summer 2003) at a single location (Europe) to a solar state and pretend that you are doing science. You need at least some sort of statistics that show that certain climatic conditions become a lot more common under certain solar conditions.
These articles don’t have much substance, but sometimes their comments section sparks some interesting debates.
(Emphasis mine.)
“Doing science” is noting a correlation between observations – then following the process to see IF there is a causal link.
David is noting a correlation, and saying there might be a causal link. Unlike those “scientists” we know all too well, he is not assuming that there is a (politically convenient) causal link here (Nor is he saying that, if there is, that it is the only one.)
David is “doing science” – real science.
David is “doing science” – real science.
Actually not. E.g. he is assuming or positing that there was a 2003 ‘event’, but there wasn’t. F10.7 is higher than the sunspot equivalent every year since about 1996. The most likely reason is that smaller sunspots have become harder to see [or even form].
“Actually not. ”
Agreed, I don;t see much science here apart from reproducing some other people’s graphs. If the proposition is that the flux spike in 2003 caused the heatwave in Europe, the first check of the hypothesis would be was there a similar event caused the even stronger spike in 1989. In fact the previousl cycle as strong or stronger for a very sustained period.
No mention was made of such a check being thought of.
Nope. Science is not what you think it is. Lots of things happened on 2003. Baseless especulation is not science.
I have to agree Javier,since the 2003 heat wave could just be a coincidence in timing. What about the the rest of the world?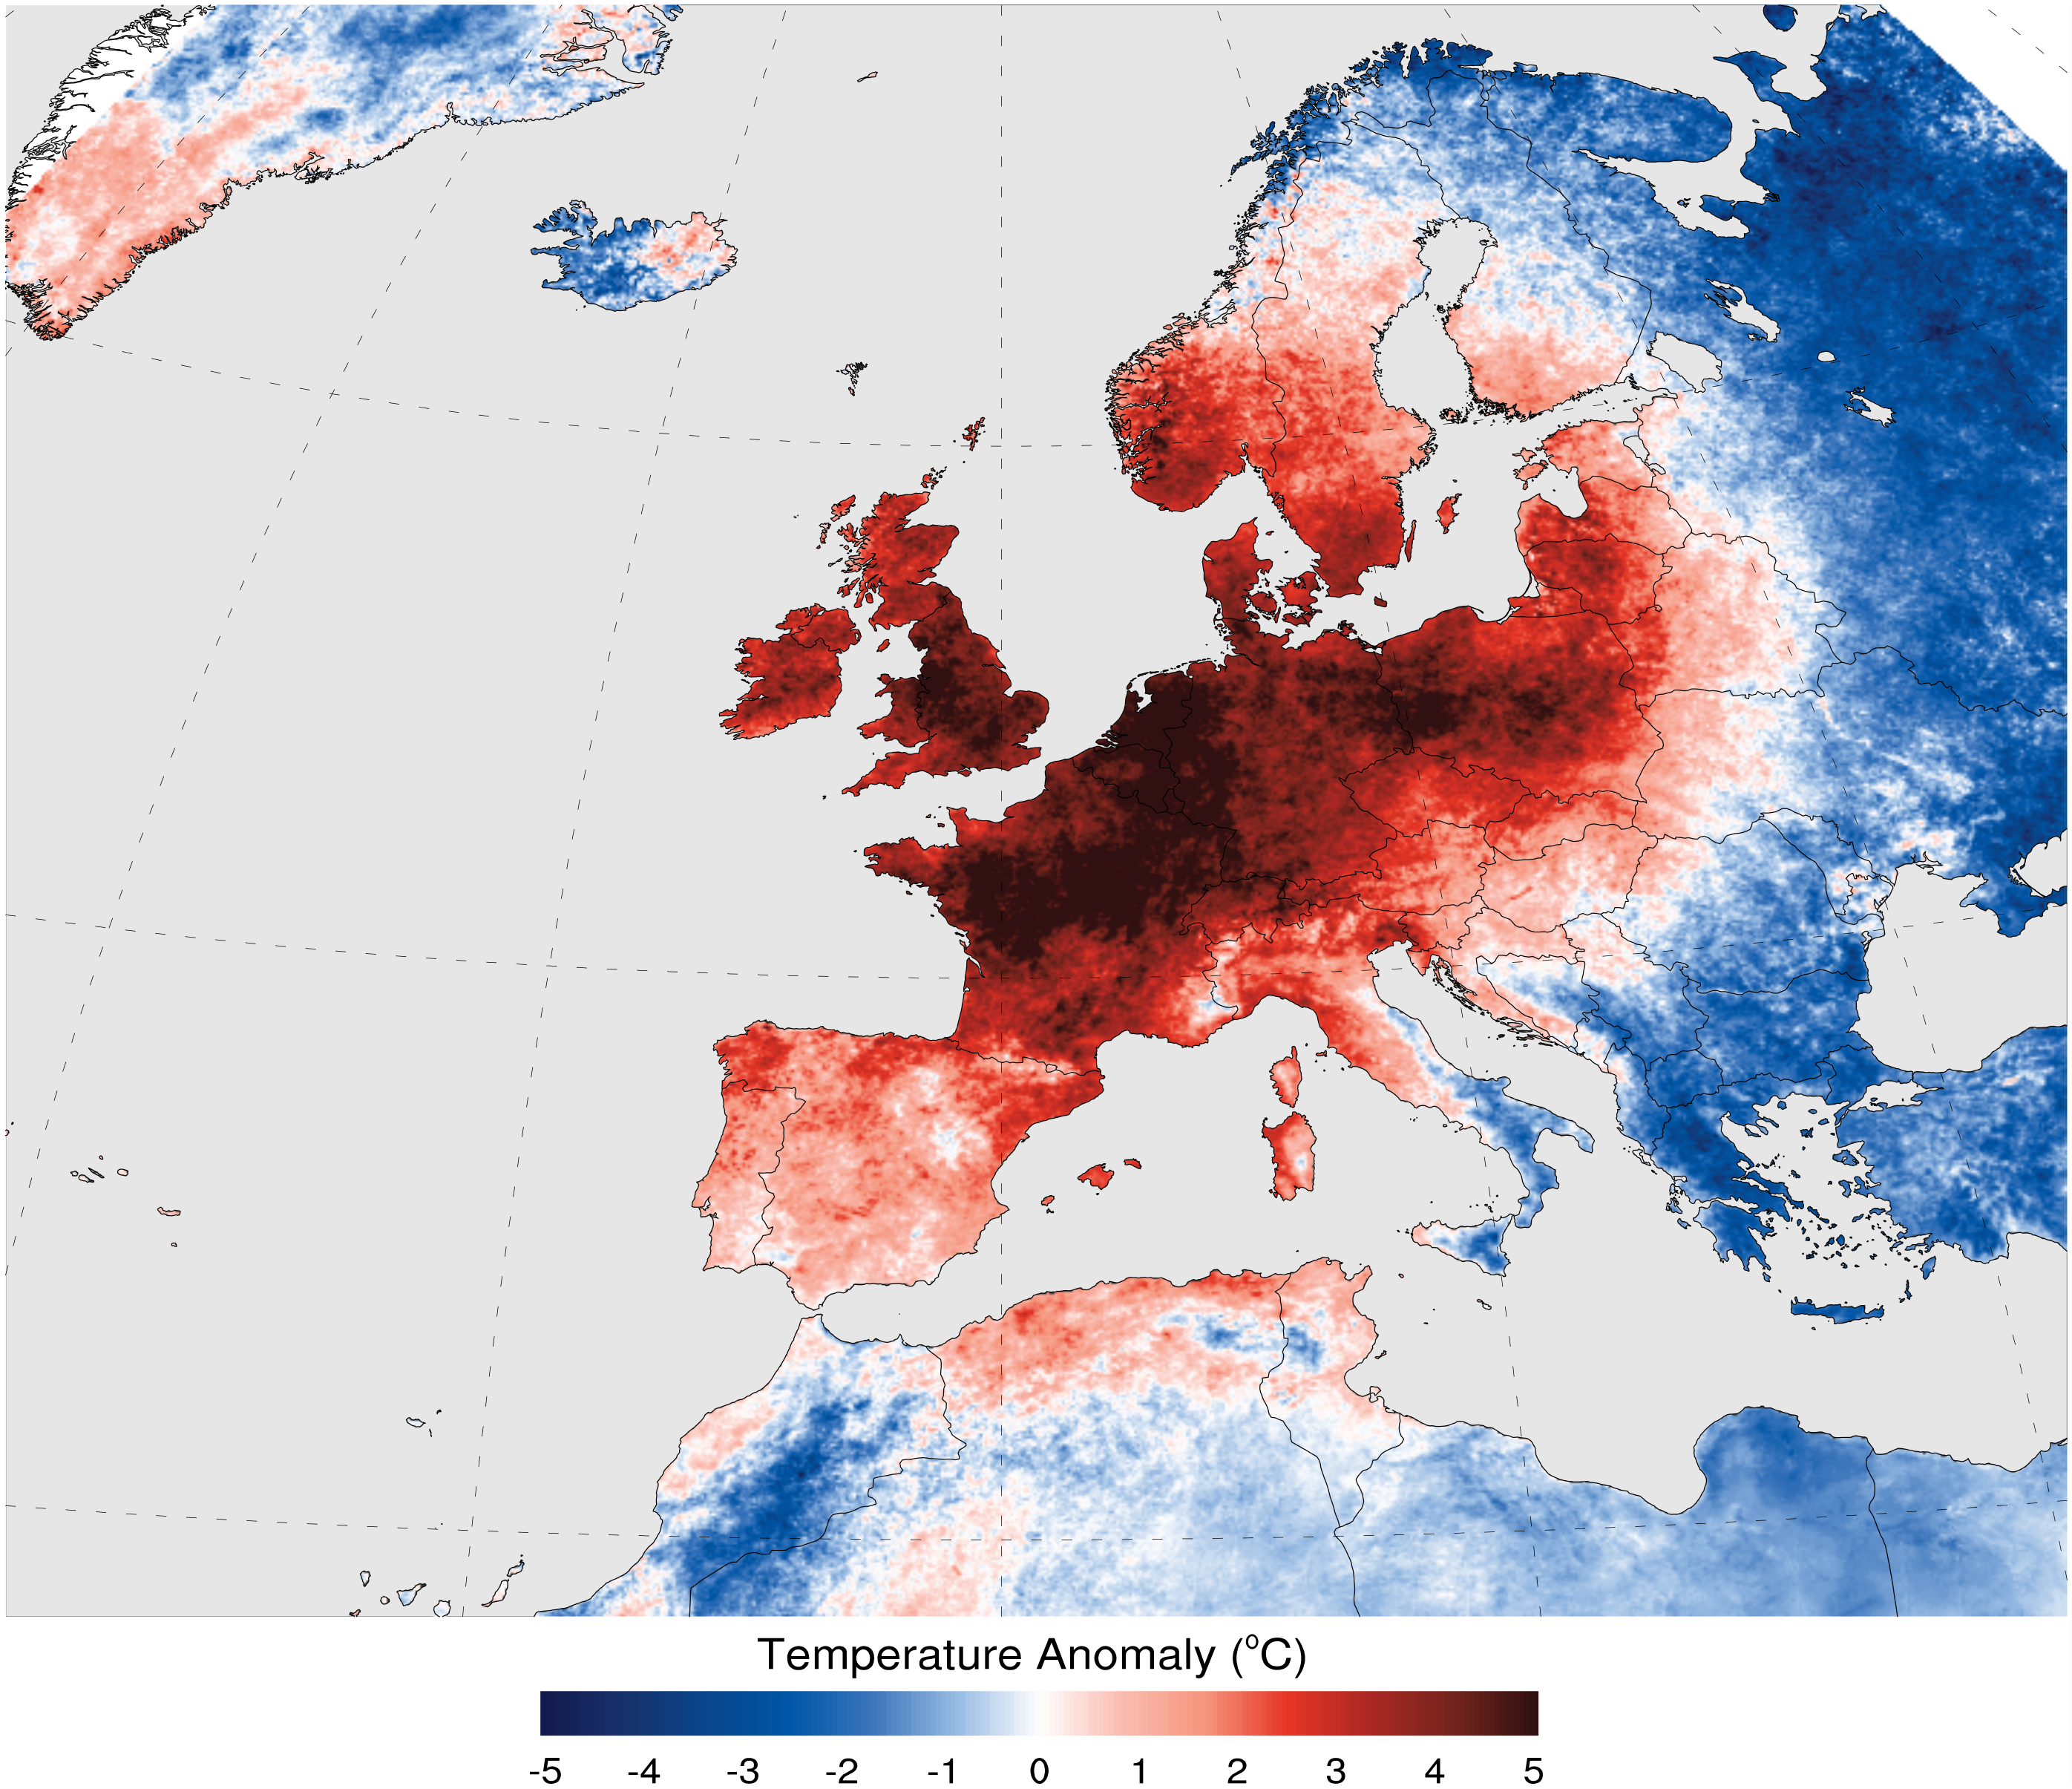
East and south of the European heat wave region,was a very cold region that occurred at the same time,as shown in this chart:
David completely ignored the Cold wave,that occurred at the same time the heat wave did.
Mis-informed opinion masquerading as “evidence”.
Is it deliberate or merely incompetent?
If a high pressure system were centered over the hottest spot on your map of Europe, then it would keep everything underneath it hot and getting hotter, while at the same time, the north to south circulation around the eastern side of the high pressure system would funnel cold air down and to the east where the much colder air is on the map.
The length of the heatwave would depend on how long that high pressure system sat in one place. That is the way one area can be super hot, while an adjacent area is much cooler.
It looks like a high pressure system is building up in the western U.S. now, and will probably be moving slowly east bringing lots of hot weather with it. This is about the time of season for high pressure systems to start dominating the weather over the U.S.
If the high pressure systems move slowly, we will get lots of heat. If the west-to-east winds keep the high pressure systems moving fairly rapidly across the country, then the heat won’t have time to build up to severe limits, and we will get some rain, too. Time will tell.
I really like this nullschool website (below). I have always been interested in the jet streams and nullschool gives a pretty good representation of all the winds in the Earth’s atmosphere. I am really interested in watching the summer weather patterns develop this year, from this angle. 🙂
https://earth.nullschool.net/#current/wind/isobaric/500hPa/orthographic=255.59,72.41,296
Sunsettommy:
The practice in France is for factories to shut down during August so that people can go on vacation.
When a high pressure area stalls over a given region, industrial pollution (primarily SO2), has time to settle out of the atmosphere, and excessive temperatures can occur because of the cleaner, more transparent air. This was the primary cause of the nearly 15,000 deaths that occurred in France in 2003.
(Examination of the monthly iGISS global temperature maps shows that France typically has increased temperature for August, with respect to July and September. Most years, the prevailing winds sweep the cleaner air away, so that down-wind areas show increased warming.)
Spikes in temperature can of course occur anywhere for the same reason, whenever a high pressure event stalls over a region.
(Food for thought)
It was simply atmospheric pressure. We imagine these Hadley cells and Ferrel cells as zonal bands around the globe like they appear in textbooks. The operative word is actually “cell”. The textbook zonal bands are just statistical constructs, like electron orbits. Where that electron or high pressure cell will be is currently anybody’s guess.
There has been a peculiar aversion on this site to adiabatic warming. This needs to change. Atmospheric pressure is a significant mode of internal variability. In the purely radiative world that has captivated modern climate science, adiabatic warming might be called an “unforced exception”.
It is entirely forced, just not by radiation.
actually what most forget with the european heat wave is the following combination: in order to have this heat in that european region it hirst had to be dry. Otherwise there is too much moist to warm up.
so first you need a below average rainfall that the surface can heat up. then and only then a record heat can be created.
the wind pattern and high pressure does then the rest. this is called weather. A lot of times these pre setups are fullfilled but just like then the blocking high pressure didn’t come…
BTW this year if this blocking high pressure will come we will see a repeat: it has been unusually dry here, so if this high pressure comes the heat will come as well…
The interplanetary magnetic field influences mid-latitude surface atmospheric pressure:
http://iopscience.iop.org/article/10.1088/1748-9326/8/4/045001
Global Climate Report – August 2003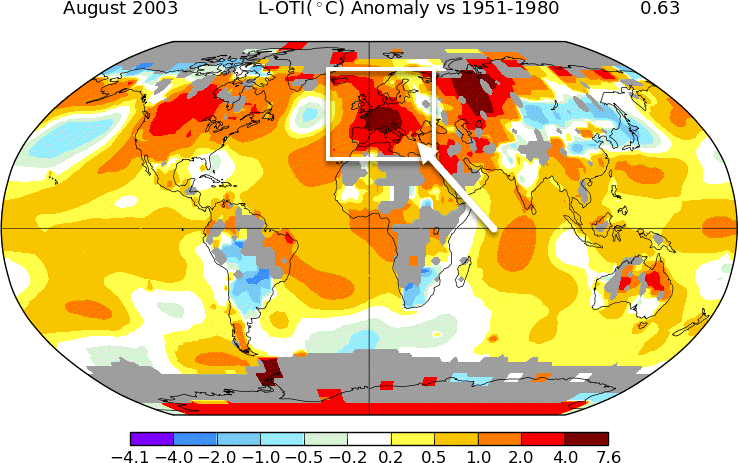
https://www.ncdc.noaa.gov/sotc/global/200308
http://2.bp.blogspot.com/-UWgui76t5TY/VZXQqgTGeNI/AAAAAAAAFdQ/lATrgCPOTEY/s1600/20150702-global-temp-anomalies.png
Got to admit, Javier, that it is REALLY nice to know that you alone truly know what science is. I wish I was so clever.
Tom, what is really easy is to know what is not science. Not much cleverness required for that.
Jet stream shifts can be caused by entirely intrinsic teleconnected processes. The author of the post fails to provide a comprehensive and up to date literature review, siting only one that supports his bias related to solar connections to ground temperatures.
There is no doubt that the regional temperatures respond to solar activity
http://www.vukcevic.talktalk.net/GSN-CET.gif
but then there also other drivers like AMO, ENSO and PDO.
There is no doubt
There is lots of doubt. For one you should not detrend the records. Nor, truncate the records. Both variables extend centuries before what you have cherry picked.
Hi doc
Kind of you to respond, degree of a doubt is an essential attribute of a good scientist.
For very good reasons your remarks are always welcomed but not necessarily implemented.
but apparently not of a pseudo-scientist…
One of the recent important work of Svalgaard et al is the major reconstruction of the historic sunspot data. Since none of its authors are considered or known to be ‘pseudo-scientists’ are we to assume that they actually doubt validity of the reconstruction?
Of course there are doubts about this too. There will certainly be more [and better] reconstructions to come. What is important is to evaluate the ‘error bars’ and uncertainties. Something completely lacking from your [and other pseudo-scientists] stuff.
You need to address the total antiphase periods around 1910-1920 and 1965-1980.
This looks like the driver may be something with a similar but slightly different period or a more likely a mix of such a driver and solar. Sometimes it reinforces the solar signal and some times it nullifies or reverses it.
Picking rough centre of those two anti-phase periods :
1970 – 1912 = 58y That would seem to represent the difference in the frequencies.
That is the way I read that graph.
1970+58= 2028. If this proposed relationship holds we should be entering a new period of anti-phase relationship any time now. Testable hypothesis.
https://judithcurry.com/2016/01/11/ace-in-the-hole/
Update: The following produces a beat pattern of about 59y that would match the periodicity found in the article. This may explain much of problem with
finding a consistent correlation to solar forcing in absence of the
recognition of a significant lunar periodicity.
p1=9.1;p2=10.8;
cos(2*pi*x/p1)+cos(2*pi*x/p2)
p1*p2/()p2-p1= 57.8
the phase is not aligned with climate but I’m sure you get the idea. T;he solar period is quite variable so it will not look as pretty but the presence of a strong lunar periodicity could produce an artificially strong correlation during some cycles and mull or anti-phase relation during others.
Yes. I have long been suggesting that ocean cycles sometimes supplement and sometimes offset the solar influence.
I see in the graph two independent processes that oscillate with their own irregular frequencies. I think it is very important not to be tricked into eye-balling correlation in such a graph as it is easy to fool oneself (I do it all the time!). A statistical treatment would be more convincing and as mentioned a longer time series representing al available data would also help.
Dr. Svalgaard further above made a point about cherry picking.
Prior to 1860s the CET data has somewhat different characteristics, it lacks periodicity which is definitely present in the data after 1860s, it also has greater min/max excursions, to reduce it the 5 instead of 3 years averaging is used, but still min-max difference is considerably greater (compare the CET right hand scaling on two graphs)
http://www.vukcevic.talktalk.net/GSN-CET2.gif
Since I don’t think there is a good reason for natural change in the CET fundamental characteristics after 1860s, I’m inclined to attribute it to greater accuracy in the CET data in the last 150 or so years.
Despite the above there is some visual coherence between to variables but in both cases correlation is statistically insignificant.
Now if Dr. Svalgaard believes otherwise (but I doubt it) that data in the 17th, 18th & early 19th centuries are more accurate than date in the late 19th and 20th centuries, he is welcome to draw his conclusions on the early and discard the later data.
UK land temp’s in phase with sunspot cycles during a warm AMO:
and the AMO anti-phase with sunspot cycles during a warm AMO:
http://www.woodfortrees.org/graph/esrl-amo/from:1880/mean:13/plot/sidc-ssn/from:1880/normalise
and both the reverse during a cold AMO.
Sigh. Both David and I apparently poked a nerve here, particularly among the “true believers” that variances in solar activity have no effect on our planet (either micro and transient – what we call “weather,” or macro and long term – what we call “climate”).
I note that in most of the responses, what David actually said is being rewritten. Turning an observation of a correlation, and a mild speculation that there might be a causal link, into an absolute, dogmatic assertion.
I also see one assertion that the correlation noted by David is not correct. That actually is “doing science” – if backed up with reliable data that contradicts his data – which I do not see.
All too much of “climate science” is in camps these days, unfortunately. Those who claim that the Sun has nothing to do with it. Those who claim that the atmospheric composition has nothing to do with it. Those who claim that massive ecological changes have nothing to do with it. Very little but knee-jerk reactions to those who suggest a synthesis.
We’ll never get anywhere at this rate – if we ever do, considering the real complexity of the subject.
Two spikes happening at about the same time is NOT a correlation. It is a temporal coincidence. He did not do any correlation analysis. Therefore suggesting or claiming one is unfounded.
Sigh. There is observational correlation – “after A, then B” – and statistical correlation – “after A, then B, 99.5% of the time.”
You are partially correct, in that performing statistical correlation on an observational correlation is a necessary part of science – if there is a good statistical correlation, there is now good reason to start investigating whether there is a causal link.
All while keeping in mind that even a statistical correlation is in no way a proof of causation – there was a period of time (I think it has diverged now, but haven’t checked) when there was a very good statistical correlation between the Dow Jones Index and the length of women’s skirts.
Additionally, in complex systems, there are always confounding factors, and they usually all work together as the actual causation. Eliminating one possible factor, as seen in an observational correlation, from the start is not science.
Sigh. There is observational correlation – “after A, then B” – and statistical correlation – “after A, then B, 99.5% of the time.”
What is lacking here is that last quantification “99.5% of the time”.
And even that does not work for rare events.
Now we have refined the actual dispute! Yay!
You are quite correct in that there is no quantification here. Only an observation.
Observation first – quantification second – analysis of quantification third – mechanism proposition fourth – proposition testing fifth.
Rinse and repeat, ad infinitum.
You are quite correct in that there is no quantification here. Only an observation
Not even that, only a claim of an observation. Plotting two series on the same graph does not constitute an ‘observation’. It only becomes an observation if it is quantified, e.g. by correlation coefficient, significance level, degree of auto-correlation, degrees of independent freedoms, etc.
sigh, learn the scientific meaning of correlation.
Two spikes happening at about the same time is NOT a correlation.
@Greg – I have learned today your meaning of correlation. Which is not scientific, only a (frequently useful) exercise in mathematics as applied to observational correlations.
Of course, if you wish to assert that Isaac Newton, Joseph Priestley, and all of their contemporaries and successors before the development of statistical analysis were not scientists – have at it. I’ll just stand here on the sidelines with my popcorn…
statistical methods simply provide an objective means of assessing the degree of correlation as a numerical coefficient. The term was like used more imprecisely before those methods were developed. However, two spikes happening at about the same time is NOT a correlation. It is a temporal coincidence. Whether you ask Newton , Einstein or Stephen Hawking. It’s not “my” definition.
I’m not a “believer” either way, I’m interested in any credible evidence of a link, it would be most interesting, should anyone produce any. I do not see that here. No beliefs required, except one in the scientific method.
The effect of solar variation on terrestrial climatic phenomena have been scientifically observed for at least 200 years.
You name it, whether temperature, precipitation, atmospheric pressure, winds, storms, ozone, all have been shown to be correlated with the solar cycle and other variations. In some cases, causation has also been demonstrated.
For example, the Indian monsoon:
http://www.sciencedirect.com/science/article/pii/S1364682614001370
Rainfall in Brazil:
http://www.geofisica.unam.mx/unid_apoyo/editorial/publicaciones/investigacion/geofisica_internacional/anteriores/2004/02/Almeida.pdf
How could solar variations possibly not have an effect?
How could solar variations possibly not have an effect?
Wrong question! Should be “How could solar variations possibly have an effect?”
During higher solar cycles, the atmosphere itself expands, putting low earth orbiting satellites at risk.
Dr. Svalgaard himself advised NASA that the needn’t worry based upon his prediction of a coming cycle strength.
the UPPER atmosphere where the density is billions of times smaller than where we live, thus needing correspondingly less variation of solar activity.
lsvalgaard July 5, 2017 at 1:54 pm
The scientific method requires that one observe the correlations, then formulate an hypothesis as to how the observed effect arises. Next, make a testable prediction based upon that hypothesis, which prediction is capable of being shown false. Then make further observations or conduct an experiment to see if the hypothesis be confirmed or shown false.
When scientists have followed those steps, they’ve discovered that, for instance, ozone production, regulated by UV flux variations, affects air temperature, and a number of other climatic parameters. The more ozone in a given parcel of air, the more heat it retains. Ozone heats the stratosphere, both by absorbing solar UV radiation and by absorbing upwelling infrared radiation from the troposphere.
The scientific method requires that one observe the correlations, then formulate an hypothesis as to how the observed effect arises.
Which is precisely what is lacking in the claims of solar effects.
To complete your attempt on being knowledgeable you need to add:
To be testable, the hypothesis must be quantified: how large in numbers and uncertainties.
lsvalgaard July 5, 2017 at 1:59 pm
The various layers of the atmosphere are connected.
It is the dog that wags the connected tail, not the tail that wags the dog.
Below is a perfect example of the “no solar” camp.
Correlations have been observed. Valid statistical correlations have been made. Various mechanisms for causation have been hypothesized (note, hypothesized – and, at the moment, neither proved nor disproved). Yet, this camp denies the very existence of even an observational correlation. NOT SCIENCE!
(Note, “proof” in real science is not an exact antonym to “disproof.” A hypothesis can be definitively disproved – show your work, though. We can only approach “proof”; there is always tomorrow’s observation or experiment…).
Yet, this camp denies the very existence of even an observational correlation
The devil is in the details. First, the correlation has to be significant at a high enough level to merit even looking at. An often used criteria is the ‘95% level’ [two ‘sigma’]. Which means that if you take 20 spurious correlations that have no causal connection, then one of them will be significant at the 95% level [but still not causal]. The more extraordinary the claim is the higher the level must be. In physics we ordinarily require a six-sigma [99.9997%] level for the acceptance of the discovery of a new particle. Second, the energetics and the physics must be plausible, e.g. the presence of visible stars in the sky is correlated [at extreme level of significance] with it being dark at the time of observation, but it is not reasonable to claim that the visibility of stars causes the darkness of the night.
Writing Observer July 5, 2017 at 2:26 pm
Scientists will say “proof” non-rigorously, but in the philosophy of science, positive results can only confirm an hypothesis, not “prove” it. Technically, proof is for math.
An hypothesis can however be shown false.
An hypothesis can however be shown false.
I hypothesize that the world was created last Tuesday, with everything in it, with light coming from stars already just about to hit my eyes, etc. This cannot be falsified.
Which is why it isn’t a scientific hypothesis.
The God hypothesis isn’t scientific, since it can’t be shown false.
This is circular and thus vacuous. And it was not a ‘God’ hypothesis. One can think of other ‘explanations’ [e.g. a la the Big Bang].
It’s not the least bit circular. To be a scientific hypothesis, it has to make predictions capable of being shown false. Popper, Einstein, Feynman, et al. Elementary philosophy of science.
Your hypothesis was the same as the God hypothesis. Incapable of being shown false. Hence, not a scientific hypothesis.
To be a scientific hypothesis, it has to make predictions capable of being shown false.
The problem with that is that we don’t know if and when [in the distant future] a given prediction will turn out to be true or false. That we don’t know today how a prediction will turn out in the distant future is not enough to dismiss a hypothesis as not being ‘scientific’. String Theory is a good example.
For an hypothesis to be scientific, it has to make testable, falsifiable predictions. Until its predictions are tested, then it is just a guess without either confirmation or falsification. But even if it is only theoretically (at the time) capable of being shown false, then it counts as scientific.
Usually though, the proponent of a scientific hypothesis will try to test it, in hopes of confirmation, as Einstein was able to do with relativity.
String theory seems to have morphed into M theory. It is (or was) hoped that the LHC could test predictions of compactified M theory. Since the field is far outside my area of expertise (or even experience), I can’t say whether its predictions have been confirmed, falsified or failed to have been tested. But it is a valid scientific theory, since hypotheses based upon it can and do make testable, falsifiable predictions.
But it is a valid scientific theory, since hypotheses based upon it can and do make testable, falsifiable predictions.
again, no. Since the ‘landscape’ of possible hypothesis is so vast [10^500 instances] we don’t know [and may never know] which are falsifiable in the distant future. To date we don’t even know of any that have made testable predictions. Falsifiability is not the sharpest criteria. The may be things that are not predictable in principle, but happen anyway [Schroedinger’s cat]. Or things that are contingent, e.g. if Evolution was allowed to be re-run staring with conditions 4 billion years ago, would we expect it will result today in someone calling her/himself Gabro and trying to defend the undefensible on WUWT? That cannot be predicted or falsified, so should we dismiss Evolution as not being a scientific theory?
I think not.
.
So, what is the present status of the hypothetical dark matter? A widely accepted scientific hypothesis, yes? Actually discussed many times more as if it is a fact. Yet though the math works I don’t believe anyone has yet to come up with a teaspoon full. But it does fit the most popular current scientific consensus.
anyone has yet to come up with a teaspoon full
Nor of the up quark, yet still it exists [very many inside of you, in fact]. We generally infer if something exists by what effect it has on things we can see or measure, e.g. Neptune as it perturbed the orbit of Uranus, or the bullet cluster https://en.wikipedia.org/wiki/Bullet_Cluster
lsvalgaard July 5, 2017 at 4:05 pm
A hypothesis qualifies as scientific if you can state what would show it false. Until confirmed or shown false, it’s still scientific, just untested, but capable of being tested.
The hypothesis that the universe was created with light already in motion so that it just looks old is not a scientific hypothesis, since it can never be shown false, even theoretically.
But an hypothesis capable of being shown false theoretically is a scientific hypothesis, although it could remain one a very long time.
The hypothesis that the universe was created with light already in motion so that it just looks old is not a scientific hypothesis, since it can never be shown false, even theoretically.
We don’t know. There could be a subtle effect that might show up in the future that would allow us to test it. Just like Mercury’s perihelion advance showed that Newton’s law were not quite right once we upped the accuracy of measurements and enough time had passed to let the deviations add up. You might try to be a bit less dogmatic.
Jim G1 July 5, 2017 at 4:36 pm
Actually some of dark matter is simply ordinary matter too dim to be detected. But some of it has been found, as for instance in rogue planets orbiting the barycenter of the galaxy rather than a star.
Dr. S. is correct that inferences count in science, since they can be tested without actually observing the inferred phenomenon. Numerous example exist of objects, processes and phenomena inferred before they were observed. His example of Neptune is good. Way back at the beginning of modern science, Copernicus inferred that the earth goes around the sun and rotates on its axis. Eventually his inference or insight was shown to be objectively true.
Actually some of dark matter is simply ordinary matter too dim to be detected.
No, it is not as we can show it is not baryonic, e.g. http://www.leif.org/EOS/CosmicSoundWaves.pdf
Later measurements have confirmed this even better.
Gabro — I would like to present the references of my work related to the two references cited by you:
1. Climatic fluctuations and homogenization of northeast Brazil using precipitation data — Pesq. agropec. bras., Brasilia, 19:529-543, 1984.
133 years Fortaleza precipitation data series [1849-1981] presented a 56-year cycle with the sub-multiples of 26, 13 & 6.5 years. They were integrated with amplitude and phase angles and compared this with observed data and projected future trend.
2. Effect of solar flares on lower tropospheric temperature & pressure — Indian Journal of Radio & Space Physics, 6:44-50.
This was presented at Symposium on Earth’s Near Space Environment, 18-21 Feb. 1975 held at the National Physical Laboratory, New Delhi. This paper was identified one of the 15 papers published in the literature upto 1976 by SCOSTEP of US Academy of Sciences — published abstracts and in the introduction the observation was made.
Dr. S. Jeevananda Reddy
sorry I made small error in the above observation — Fortaleza main cycle is not 56 but it is 52 year cycle. The same cycle I observed in northern hemisphere around the same latitude on onset of monsoon over the Kerala Coast:
Forecasting the onset of southwest monsoon over Kerala — Indian J. Meteorol. Hydrol. Geophys., 28:113-114, 1977
Dr. S. Jeevananda Reddy
We are finding more normal unseen ie dark baryonic matter all the time as our observational equipment improves. Be careful, Leif’s better “measurements” may be from computer models. Inferences are just that. Dark Matter is still hypothetical just like some of the planets, until we found them.
We are finding more normal unseen ie dark baryonic matter all the time as our observational equipment improves
That we can see farther does not imply that the density of matter changes. The acoustic peaks in the CMB shows the amount of baryonic matter, and not derived from computer models, but from simple freshman physics applied to direct measurements of the distribution over the sky of the CBM [although derived using computers to make the fits and calculations – the days of calculating by hand are long past].
https://darkmatterdarkenergy.com/2015/03/07/planck-mission-full-results-confirm-canonical-cosmology-model/
Many also interpret cosmic acoustics to indicate an infinite and probably eternal universe. So much for the “big bang” from which the acoustics are hypothesized to have originated. Must have been a smaller bang and not the origination of all of everything, but just a “local” event which would seem somewhat hamstrung in so precisely indicating the density of all matter, baryonic or otherwise. It “ain’t what people don’t know that gets them in so much trouble, it’s all the stuff they do know which just ain’t so” or in this case maybe ain’t so. You speak with way too much certainty on many issues which are at best, maybe’s.
Many also interpret cosmic acoustics to indicate an infinite and probably eternal universe.
Perhaps you could tell us who those ‘many’ are with links to their papers?
You speak with way too much certainty on many issues which are at best, maybe’s.
As do these 261 astrophysicists
https://arxiv.org/pdf/1502.01589.pdf
“Planck 2015 results. XIII. Cosmological parameters
Authors:
Planck Collaboration; Ade, P. A. R.; Aghanim, N.; Arnaud, M.; Ashdown, M.; Aumont, J.; Baccigalupi, C.; Banday, A. J.; Barreiro, R. B.; Bartlett, J. G.; Bartolo, N.; Battaner, E.; Battye, R.; Benabed, K.; Benoît, A.; Benoit-Lévy, A.; Bernard, J.-P.; Bersanelli, M.; Bielewicz, P.; Bock, J. J.; Bonaldi, A.; Bonavera, L.; Bond, J. R.; Borrill, J.; Bouchet, F. R.; Boulanger, F.; Bucher, M.; Burigana, C.; Butler, R. C.; Calabrese, E.; Cardoso, J.-F.; Catalano, A.; Challinor, A.; Chamballu, A.; Chary, R.-R.; Chiang, H. C.; Chluba, J.; Christensen, P. R.; Church, S.; Clements, D. L.; Colombi, S.; Colombo, L. P. L.; Combet, C.; Coulais, A.; Crill, B. P.; Curto, A.; Cuttaia, F.; Danese, L.; Davies, R. D.; Davis, R. J.; de Bernardis, P.; de Rosa, A.; de Zotti, G.; Delabrouille, J.; Désert, F.-X.; Di Valentino, E.; Dickinson, C.; Diego, J. M.; Dolag, K.; Dole, H.; Donzelli, S.; Doré, O.; Douspis, M.; Ducout, A.; Dunkley, J.; Dupac, X.; Efstathiou, G.; Elsner, F.; Enßlin, T. A.; Eriksen, H. K.; Farhang, M.; Fergusson, J.; Finelli, F.; Forni, O.; Frailis, M.; Fraisse, A. A.; Franceschi, E.; Frejsel, A.; Galeotta, S.; Galli, S.; Ganga, K.; Gauthier, C.; Gerbino, M.; Ghosh, T.; Giard, M.; Giraud-Héraud, Y.; Giusarma, E.; Gjerløw, E.; González-Nuevo, J.; Górski, K. M.; Gratton, S.; Gregorio, A.; Gruppuso, A.; Gudmundsson, J. E.; Hamann, J.; Hansen, F. K.; Hanson, D.; Harrison, D. L.; Helou, G.; Henrot-Versillé, S.; Hernández-Monteagudo, C.; Herranz, D.; Hildebrandt, S. R.; Hivon, E.; Hobson, M.; Holmes, W. A.; Hornstrup, A.; Hovest, W.; Huang, Z.; Huffenberger, K. M.; Hurier, G.; Jaffe, A. H.; Jaffe, T. R.; Jones, W. C.; Juvela, M.; Keihänen, E.; Keskitalo, R.; Kisner, T. S.; Kneissl, R.; Knoche, J.; Knox, L.; Kunz, M.; Kurki-Suonio, H.; Lagache, G.; Lähteenmäki, A.; Lamarre, J.-M.; Lasenby, A.; Lattanzi, M.; Lawrence, C. R.; Leahy, J. P.; Leonardi, R.; Lesgourgues, J.; Levrier, F.; Lewis, A.; Liguori, M.; Lilje, P. B.; Linden-Vørnle, M.; López-Caniego, M.; Lubin, P. M.; Macías-Pérez, J. F.; Maggio, G.; Maino, D.; Mandolesi, N.; Mangilli, A.; Marchini, A.; Maris, M.; Martin, P. G.; Martinelli, M.; Martínez-González, E.; Masi, S.; Matarrese, S.; McGehee, P.; Meinhold, P. R.; Melchiorri, A.; Melin, J.-B.; Mendes, L.; Mennella, A.; Migliaccio, M.; Millea, M.; Mitra, S.; Miville-Deschênes, M.-A.; Moneti, A.; Montier, L.; Morgante, G.; Mortlock, D.; Moss, A.; Munshi, D.; Murphy, J. A.; Naselsky, P.; Nati, F.; Natoli, P.; Netterfield, C. B.; Nørgaard-Nielsen, H. U.; Noviello, F.; Novikov, D.; Novikov, I.; Oxborrow, C. A.; Paci, F.; Pagano, L.; Pajot, F.; Paladini, R.; Paoletti, D.; Partridge, B.; Pasian, F.; Patanchon, G.; Pearson, T. J.; Perdereau, O.; Perotto, L.; Perrotta, F.; Pettorino, V.; Piacentini, F.; Piat, M.; Pierpaoli, E.; Pietrobon, D.; Plaszczynski, S.; Pointecouteau, E.; Polenta, G.; Popa, L.; Pratt, G. W.; Prézeau, G.; Prunet, S.; Puget, J.-L.; Rachen, J. P.; Reach, W. T.; Rebolo, R.; Reinecke, M.; Remazeilles, M.; Renault, C.; Renzi, A.; Ristorcelli, I.; Rocha, G.; Rosset, C.; Rossetti, M.; Roudier, G.; Rouillé d’Orfeuil, B.; Rowan-Robinson, M.; Rubiño-Martín, J. A.; Rusholme, B.; Said, N.; Salvatelli, V.; Salvati, L.; Sandri, M.; Santos, D.; Savelainen, M.; Savini, G.; Scott, D.; Seiffert, M. D.; Serra, P.; Shellard, E. P. S.; Spencer, L. D.; Spinelli, M.; Stolyarov, V.; Stompor, R.; Sudiwala, R.; Sunyaev, R.; Sutton, D.; Suur-Uski, A.-S.; Sygnet, J.-F.; Tauber, J. A.; Terenzi, L.; Toffolatti, L.; Tomasi, M.; Tristram, M.; Trombetti, T.; Tucci, M.; Tuovinen, J.; Türler, M.; Umana, G.; Valenziano, L.; Valiviita, J.; Van Tent, F.; Vielva, P.; Villa, F.; Wade, L. A.; Wandelt, B. D.; Wehus, I. K.; White, M.; White, S. D. M.; Wilkinson, A.; Yvon, D.; Zacchei, A.; Zonca, A.
Consensus science at its best. You win. Comfortable to have so many that agree with you, or with whom you agree. You are as aware of the infinite universe interpretations of the acoustics as am I.
You are still evading to show us your ‘many’.
Consensus science at its best.
These people are hard-working scientists who know what they are talking about, know what the data are, know what the limits are, in short: know their stuff. Good reasons to trust their work [after reading it carefully first, of course – you should try that, you might[?] learn something].
Now, don’t slink away without giving us a list of your ‘many’ and their work.
As I said, you are as aware of the infinite universe interpretations of the acoustics as am I, so I will slink away without making you happy and you can slink back to your comfortable consensus. I am still waiting for that teaspoon full of “dark matter” which you once told me since it could not be found in our neighborhood, “some thought it might be inside the sun” . Guess I should have asked you to list who those “some” were.
As I said, you are as aware of the infinite universe interpretations of the acoustics as am I
It is not about me. It is for the many readers that are awaiting the list with bated breath.
Usually, when someone evades something it is because there really isn’t anything…
You go first. Who were the “some” who, according to you, thought the local dark matter might be inside the sun? Conveniently unavailable for sampling.
lsvalgaard July 5, 2017 at 5:09 pm and at 5:21 PM
I’m not dogmatic about the scientific method. If proponents of the hypothesis that the universe was created with light already in motion so that it just looks old cannot come up with even a theoretical way to test this claim, then it is not a scientific hypothesis, as I said. If in future a falsifiable test be proposed, then it would become scientific. Not dogma, just the scientific method.
Einstein had an explanation for Mercury’s perihelion advance and offered a way to test his hypothesis.
Your link about the nonbaryonic nature of all dark matter is from 2008. My cousin is still working on MACHOs, so I guess his NASA team didn’t get the memo. AFAIK, which isn’t very far, it’s still possible that some dark matter is baryonic, to include the rogue planets I mentioned, plus objects such as brown dwarfs (failed stars) and supermassive black holes.
As you know, brown dwarfs, with mass less than 1/20 of the sun, are not luminous enough to be detected by most telescopes, although there has been a recent survey suggesting that they might be much more numerous than previously thought. They and other such baryonic objects are called MACHOs (MAssive Compact Halo Objects).
Your link about the nonbaryonic nature of all dark matter is from 2008
The case has become stronger since. Perhaps this is helpful [also for your friend]:
http://www.leif.org/EOS/Dark-Universe-2017.pdf
In any field you can find reactionary people who cling to their outmoded ideas long after science has moved on. There is even a Flat-Earth Society.
Dr. S. Jeevananda Reddy July 5, 2017 at 5:40 pm
Thanks for the links. I knew about the Fortaleza study.
lsvalgaard July 5, 2017 at 4:05 pm
As I keep pointing out, it’s a scientific hypothesis if it can at least theoretically be tested and shown false. Doesn’t matter how many there might be. The rule still applies.
I seem not to have explained the philosophy of science adequately. Hypothetically rerunning evolution isn’t a scientific hypothesis, since you can’t test whatever prediction you make about the result. You can do computer simulations and see to what extent they resemble what happened, but that’s not really science, either.
A scientific hypothesis is a clearcut guess, stated precisely and subject to falsification. Now, as you note, the falisification might be merely statistical rather than a binary yes or no. But the idea runs like this: Copernicus hypothesized a sun-centered system; Galileo observed the phases of Venus, which showed Ptolemy’s earth-centered system false, thus confirming Copernicus but not “proving” him correct, since in Tycho’s system (in which the moon and sun orbited earth, but the other planets circled the sun) Venus would also have phases.
You’ve already alluded to a more recent example, Sticking with astronomy, observations showed Einstein right and Newton fundamentally wrong, since space and time are not absolute, but relative, and gravity isn’t an instantaneous force, but works at the speed of light. Einstein made predictions, which, having been confirmed, falsified Newton.
As I keep pointing out, it’s a scientific hypothesis if it can at least theoretically be tested and shown false
As I keep pointing out, there are hypothesis that we don’t know if they can [or how they can] be tested at the present time. Perhaps in the distant future we’ll figure out if or how. Such hypotheses could very well be ‘scientific’, at least we cannot summarily dismiss them based on current ignorance. Now, I think you confuse a few things. There are lots of hypotheses that have been falsified [e.g. Velikovski’s, or that the Moon is made of green cheese] but that does not make them ‘scientific’.
Einstein made predictions, which, having been confirmed, falsified Newton
Newton did not make any hypothesis about gravity.
https://en.wikipedia.org/wiki/Hypotheses_non_fingo
Again, get off your dogma horse.
lsvalgaard July 6, 2017 at 3:44 pm
Well, that is from this year. Thanks.
Will have to check with my cousin to see if the MACHO program searching for massive objects in galactic halos has been cancelled. The Flat Earth Society after all isn’t funded by NASA. Flat Universe, maybe.
My replies on Newton’s hypotheses are both lost in cyberspace, perhaps never to return, as so often happens, so I’ll try just linking to the history of his hypothesis that the inverse square law explains elliptical planetary orbits:
http://www.mathpages.com/home/kmath658/kmath658.htm
Apparently MACHOs are still in the mix, according to the APS and Institute for Advanced Study, as of April. No surprise however that they can’t account for all dark matter.:
http://meetings.aps.org/Meeting/APR17/Session/U5.3
Author:
Timothy Brandt
(Institute for Advanced Study)
I show that a recently discovered star cluster near the center of the ultra-faint dwarf galaxy Eridanus II provides strong constraints on massive compact halo objects (MACHOs) of >5 M⊙ as the main component of dark matter. MACHO dark matter will dynamically heat the cluster, driving it to larger sizes and higher velocity dispersions until it dissolves into its host galaxy. The stars in compact ultra-faint dwarf galaxies themselves will be subject to the same dynamical heating; the survival of at least ten such galaxies places independent limits on MACHO dark matter of masses >10 M⊙. Both Eri II’s cluster and the compact ultra-faint dwarfs are characterized by stellar masses of just a few thousand M⊙ and half-light radii of 13 pc (for the cluster) and ∼30 pc (for the ultra-faint dwarfs). These systems close the ∼20−100 M⊙ window of allowed MACHO dark matter and combine with existing constraints from microlensing, wide binaries, and disk kinematics to rule out dark matter composed entirely of MACHOs from ∼10−7 M⊙ up to arbitrarily high masses.
http://www.astronomy.com/news/2016/08/machos-may-be-out-of-the-running-as-a-dark-matter-candidate
“it seems unlikely that MACHOs make up the bulk of dark matter in other mass ranges, so the future looks dim for MACHOs“.
“Candidates in the MACHO category such as white dwarf or brown dwarf stars have been ruled out by observational constraints.”
Regardless, the amplitude of the acoustic baryon peak limits the baryonic dark matter to a small amount compared to the non-baryonic amaout.
Thank you David. I always enjoy your updates.
A small correction to the text. Canberra’s citizens are not the richest in Australia at all. They have, marginally, the highest net income, but the real wealth is in Sydney and Melbourne.
After the events happen, we can then evaluate them.
This is the scientific method.
Prediction is not part of the scientific method!
Don’t we wish that science could predict?
Small correction: “Solar Harbinger” should read Solar Red-herring. You don’t actually beleive this bs?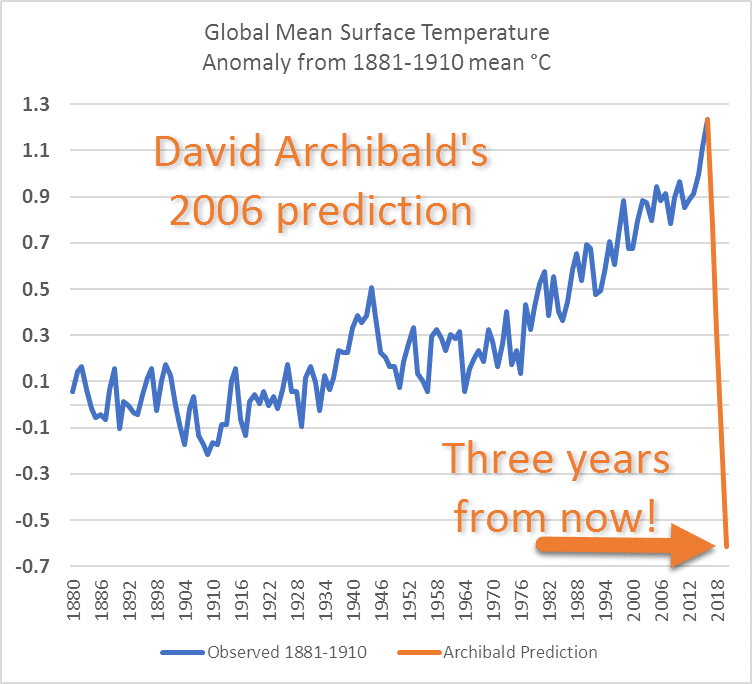
Just doing your small bit for the doubt/smokescreen manufacturers? Well done David, well done wuwt.
I suppose as long as your nonsense is confined to an intellectual cul de sac it can’t be doing much harm.
(somethin’ tells me yer using giss here)…
Sure does look like a GISS Hockey Stick.
Now add in the most recent surface data. Looks like we are already half way to that prediction.
If the green line was now down at -0.4, and from there took another astonishing plunge downward off the scale, then yes you’d be pretty close and David would look like a genius.
10 years later he is still sprouting this ‘it’s about to cool’ nonsense. In fact the opposite has happened and is highly likely to continue.
How about just coming out and admitting the obvious: that he is not even close.
Sorry Tony, but the opposite has not happened unless you think El Nino is climate. There’s been no warming over the past decade.
Now, don’t get me wrong. I don’t think David’s prediction is going to materialize due to the fact we are still under the influence of the +AMO. We probably won’t start cooling until the AMO goes negative and that is still many years away.
Anyone know the link to find current global sea surface temperature map?
Thanks.
Most recent maps here and of course the solar influence on them is gigantic.
Solar change of 0.1% leads to about 0.26c, but recent solar minimums needs to be about 5.1 times longer to show it.
http://weather.unisys.com/archive/sst/sst-170702.gif
http://weather.unisys.com/archive/sst/sst_anom-170702.gif
Solar change of 0.1% leads to about 0.26c
It would be nice if it did, unfortunately it doesn’t [would do wonders for my funding]. Your value is about four times too large.
I agree that is what you have found, but my point being the minimum is too short in the normal cycles to show it and needs to be five times longer to confirm it. I am basing this hypothesis on the CET and LIA, plus the overall energy contribution of the sun. The idea being the CET never reached equilibrium before the solar cycle minimum ended. The CET is the oldest instrumental temperature data set on the planet, so have little choice in using anything else.
Baldersdash, do you have a link to the TLI numbers? Total Lunar Indoctrination; that’s seems to be having a significant effect.
“All the energy that drives the Earth’s climate system comes from the Sun”.
Wrong. Radioactivity drives plate tectonics, which drives volcanoes, which drives climate change on geological time scales.
Continental configuration and mountain building also factors in long term climate change, ocean currents, and so on.
All geothermal energy comes from energy sources not derived from the sun.
In 2003, the monthly average mortality was approx 70,000 in Germany and 50,000 in France and 2003 was not a high year for either country. It’s difficult to see any heat wave deaths here.
My hypothesis above has gathered more evidence.
While Leif is absolutely correct in being skeptic and demanding the highest scientific standards, he is incorrect in applying that to us, as we are not solar-climate scientists, nor are we publishing in a scientific journal. We lack the knowledge and access to equipment and information to deliver. What we can do is read the published work of others and assume, in absence of contrary evidence, that the journals have done their job at requiring those standards.
It is very often the case that scientists pondering over the same evidence will reach different conclusions and develop different hypotheses. Eventually only one of them would be proven right. Leif’s interpretation of the evidence is not the only one, and his claims of being the correct one amount to nothing. As we gather more evidence the solar variability-climate hypothesis far from becoming weaker is gaining support.
The main problem is that modern science hasn’t had the chance to examine a decent long solar minimum over several Schwabe cycles. Hopefully what we are having over SC24 and perhaps SC25 will suffice. SC24-25 won’t have the effect of the 1900 Eddy minimum but we have got much better at detecting smaller effects.
Javier July 6, 2017 at 3:46 am
“While Leif is absolutely correct in being skeptic and demanding the highest scientific standards, he is incorrect in applying that to us, as we are not solar-climate scientists, nor are we publishing in a scientific journal. We lack the knowledge and access to equipment and information to deliver.”
Are you serious? At least you now acknowledge that you do not know what you are talking about.
I’ve never said otherwise. I know what others talk about in their scientific articles and about the evidence they present. It is all second-hand knowledge. Leif is not a climate scientist either, so he doesn’t know either many of the things he talks about. He has read them the same I have done.
You would be surprised how many scientists are not even doing that, and are not reading published research relevant to their work.
Leif is not a climate scientist either, so he doesn’t know either many of the things he talks about. He has read them the same I have done.
I don’t know what it takes to be a ‘climate scientist’. I have published several papers on sun-weather-climate and helped revive the field back in the 1970s. The 8th most cited of my papers has 142 citations to date:
Solar magnetic sector structure: Relation to circulation of the earth’s atmosphere
JM Wilcox, PH Scherrer, L Svalgaard, WO Roberts, RH Olson
Science 180 (4082), 185-186
Obviously to be specialized in the climate of the earth. You are an expert on a different solar system body.
I was once regarded [by my peers and meteorologists] as an expert on Sun-Weather-Climate. See e.g.
http://www.leif.org/EOS/1976NASA-1973-Sun-Weather.pdf [search for Svalgaard]. of interest may also be the report from a similar workshop about 40 years later: http://www.leif.org/EOS/NASA-Workshop-Sun-Climate-2011.pdf
According to you there is nothing on Sun-Weather-Climate, so you must have been an expert on nothing.
It will do you good to actually read the literature I referred you to.
What happened was that the hopes we all had back in 1973 that the field was progressing did not pan out. The data collected since have dashed all such hopes.
It never hurts to read, unless the Necronomicon.
Then do it.
To prove that you even looked [let alone read] tell us how many times my name appears in the book.
32 times. And with prophetic sentences:
“I really am full of faith in the ultimate possibilities of the modeling approach, and, in fact, that is where the payoff is going to be.”
Prescient.
Very good! A model is a quantitative encoding of our knowledge. Without a model we just have [depending on the issue] millions of data points and no conceptual summary of them. So, models are absolutely of essence.
Now am I a climate scientist? or do I still don’t know what I’m talking about?
Let’s see:
Research, Solar Energy, Data Analysis, LaTeX, Scientific Computing, Physics, Data Mining, Programming, Science Matlab Market Research, Business Strategy, Simulations, Fortran, Statistics, Image Processing, Spectroscopy, Image Analysis, IDL, Plasma Physics, Astrophysics, Numerical Analysis, Software Development, Mathematica, Mathematical Modeling, SQL, Algorithms, Experimentation, Signal Processing, Sensors, R&D, Astronomy, Monte Carlo Simulation, Optics, Scientific Writing, Computational Physics, Experimental Physics, Theory, Parallel Computing, Particle Physics, Modeling, Remote Sensing, High Performance Computing, R, Theoretical Physics, Numerical Simulation, Science Communication, Applied Mathematics.
https://www.linkedin.com/in/leif-svalgaard-0151459
Nope. You not only are not a climate scientist. You don’t even think you are one.
Climate and Weather are not Skills, but application of skills [which you so nicely retrieved]. One could wish that some people who call themselves ‘Climate Scientists’ had just a fraction of those skills.
How can you possibly be a “climate scientist” when you don’t even know what an equilibrium state temperature is?
Well, it might be a good idea for you to learn a bit about thermodynamics. If a system is in contact with a reservoir at constant temperature and pressure then the stable equilibrium state is such that the Gibbs free energy is at a minimum. This does not apply to our atmosphere.
And know that the skills you listed are what other people have endorsed, not what I have claimed.
The ocean has an equilibrium state temperature, and that certainly has implications for our climate…
The ocean has an equilibrium state temperature
No, those are just empty words, that do not cover the standard scientific definition [that I gave in a previous comment] of ‘equilibrium state temperature’. Perhaps you could try your hand on providing a precise definition and check how well it corresponds to standard usage.
Svalgaard, the ocean has a temperature at which is no longer warming and no longer cooling. THAT would be it’s equilibrium state temperature. (why is it so darn difficult for you to grasp this?)
Because ‘equilibrium state temperature’ already has a very different meaning in physics. You just shouldn’t hijack existing concepts and give them different, homegrown meaning. To see where you become confused ask “in equilibrium with what?”
Now, the oceans are always warming [during the day] and cooling [at night]. If you increase the solar radiation, the oceans will warm a bit more during the day, and cool a bit more at night [because a warmer ocean radiates more to space]. At all times, there is a balance between input and output, at a level essentially set by the input.
“…which is…” should read “…which it is…”
What you seem to be saying here is that the oceans never can be warmed at all. What is given during the day, will be returned to space at night. Is that what you’re claiming?
If you increase solar radiation, the oceans would eventually radiate away everything that was coming in [input = output], but at a higher temperature. There is no special magic temperature where this does not hold.
O.K., what you seem to be saying is that there would actually be a higher temperature as a result. (correct?) That new higher temperature would then cause the ocean on the whole to warm for hundreds of years until a new eqilibrium is reached. (assuming here that the ocean is at an equilibrium to begin with)…
As long as the atmosphere is open to a variable sun, the atmosphere is never in equilibrium [and with what?]. The temperature wil always adjust itself such as the radiate away precisely what is coming in. There is no ‘equilibrium state’ that the atmosphere is seeking, and hence no equilibrium state temperature.
We’re talking about the ocean here… Either the ocean is undergoing thermal expansion (/contraction) OR it is not, in which case it is at an equilibrium state. If it should become out of equilibrium by warmer (/cooler) surface temps, then the ocean will warm (/cool) until a new equilibrium is reached. (and ultimately this would have ramifications for atmospheric temps through feedbacks)…
One could also apply the concept to ice melt, too… The ipcc attributes over half of sea level rise to ice melt and over a third due to thermal expansion. You can see that the period from 1940-1970, which saw flat global temps, continued to see ice melt and thermal expansion, surface temps being above equilibrium state:
Dr. Svalgaard, i’m under some time constraint here. Do post a comment, it’ll give me food for thought. Can’t say when (or even if) i’ll get back. Thanks much, it’s always a pleasure…
Either the ocean is undergoing thermal expansion (/contraction) OR it is not, in which case it is at an equilibrium state.
No, the oceans do not jump discontinuously from one ‘equilibrium state’ [and temperature]. They change their temperature and expansion continuously as response to the external variable that is the Sun’s output. In addition there are also internal variability and even ‘pauses’ from time to time as conditions warrant, but it is a mistake to think that the Sun staggers like a drunk from one well-defined equilibrium to another and that they ‘know’ what the equilibrium of the day is that they should be seeking. It is all in flux.
the fonz is back (at least for a little while)… You lost me here svalgaard. Let’s start with a mercury filled thermometer. It’s in an airconditioned room and it reads a constant 70F. You might say that the mercury in the thermometer is at a thermal equilibrium. We take the thermometer outside where it is 90F. The mercury in the thermometer is no longer at an equilibrium as it expands until it reaches a new equilibrium. At that point the thermometer reads 90F. The ocean is the exact same way. If we raise the surface temp of the ocean so that it is no longer at an equilibrium state, then the ocean will begin thermal expansion until finally, after perhaps hundreds of years, it reaches a new equilibrium state…
If we raise the surface temp of the ocean so that it is no longer at an equilibrium state, then the ocean will begin thermal expansion until finally, after perhaps hundreds of years, it reaches a new equilibrium state…
The raising of the surface temperature is not instantaneous but proceeds gradually and the temperature as we go along adjusts to what external forcing is acting on the oceans. In a sense every minute, a new ‘equilibrium state’ [in your sense] is reached to be replace a minute later by yet another ‘equilibrium state’. In such a continuous process it quickly becomes meaningless to use the concept of an ‘equilibrium state’. There is only an always changing ‘current state’.
http://www.realclimate.org/images//sea_level_rise_vs_temperature.png
(here’s a better graph than the one above… You can see that the rate of change correlates well with temperature—the rate looks kind of like the old data sets before the “adjustocene”. Granted, this includes attribution from thermal expansion as well as ice melt, but it gives us an idea as to what is going on here. One would think that a sustained rise of .1C would contribute to more warming as time goes on with feedbacks from a warming ocean and ice melt)…
That can’t be right, Svalgaard… Say if we could raise sea surface temps instantaneously 1C. It would take centuries for the ocean on the whole to equilibriate. And if we were to raise sea surface temps over the course of a century, it would STILL take the whole ocean centuries to equilibriate. In fact the latter is what we have going on now. The ipcc tells us that 1.1 mm/year of the current rise in sea levels is due to thermal expansion. If we were to maintain pause SSTs indefinitely, that number would gradually decrease over centuries until a new equilibrium has been reached. It’s easy for nature to change sea surface temps relatively quickly. Much more difficult to warm the ocean on the whole…
Say if we could raise sea surface temps instantaneously 1C.
Since we can’t, the proposition is meaningless.
It would take centuries for the ocean on the whole to equilibriate.
There is no equilibrium state for the real, actual ocean. The real temperature changes are gradual and the state adjusts itself as needed.
Say if we could raise sea surface temps instantaneously 1C. It would take centuries for the ocean on the whole to equilibriate.
If you instantaneously changed the SST by 1C, the colder ocean would soon erase that change.
You are not quite precise enough. ‘Equilibriate’? meaning reach the same temperature throughout? No, that can’t be what you mean. Stop changing, perhaps? The oceans would always change in response to external forcing. There is no ‘equilibrium state’ that the oceans are seeking regardless of external forcing. More forcing than now, the temps go up. Less forcing than now, the temps go down.
If SSTs are raised, say, 1C (and maintained at 1C), then a new thermal gradient is established from top to bottom. Once the new thermal gradient is established, a new equilibrium state has been reached, thermal expansion ceases. As it is now, according to our beloved ipcc, thermal expansion is responsible for 1.1mm/year of sea level rise. Just like our thermometer, the ocean is going from one state of temperature equilibrium to the next. Let me ask you, are you suggesting that the oceans have not been warming during the recent pause in surface temps?
Dr Svalgaard, we’re “nesting” here (as it’s called). i’m going to put another comment way down at the bottom of the page. We can continue there…
If SSTs are raised, say, 1C (and maintained at 1C)
Except that it never is. The external forcing [the sun] goes up and down on time scales less that a century and the SST just follows suit and the rest of the oceans as well.
One of the questions I have is all of these solar metrics, solar wind speed, TSI etc… all seem to be converted to 1 AU distance. But that is not what the Earth is actually receiving at the top of the atmosphere since Earths orbit fluctuates by 1 million miles. In attempting to find a correlation with climate metrics, wouldn’t it be more accurate to use the actual values instead of removing earths orbital eccentricity?
It depends a bit on what the purpose is. For climate response the actual observations should be used [some people don’t]. For studying the Sun, the adjusted to 1 AU should be used.
A consequence of lower UV is that the atmosphere will shrink and satellites will last longer in orbit. the effect this time looks like being bigger than for the last minimum.
It was a blocking high that would have led to a freeze in Winter and are large-scale patterns in the atmospheric pressure field that are nearly stationary. Hence, the reason why the heat persisted longer than usual. For any evidence to become acceptable there would have to be a good link between solar flux and solar wind, with blocking highs during any time of the year. One heat-wave in 2003 unfortunately doesn’t mean anything other than a blocking high weather event.
http://www.wetterzentrale.de/maps/archive/2003/noaa/NOAA_1_2003080612_1.png
During Summer a blocking high causes cooler air to circulate around, but in Winter causes milder air to circulate around it.
Problem being the weakening and pole ward shift of the jets is normal for summer and therefore the big test is during Winter when the jet stream is strong.
Unfortunately results show a weakening and pole ward shift with especially a meridional jet in Winter during especially long periods of no sun spots. Just one recent example the freeze in Europe during end November and December 2010. During the LIA there were frequent examples of these shown in the CET.
Should read below.
“Unfortunately…a weakening and mid-latitude shift…long periods of no sun spots.”
Yesterday I had a lengthy discussion with Leif Svalgaard where he attempted to smear my TSI modeling work again; my last response summarizes my position. I am better at TSI modeling than Leif and he doesn’t want anyone to know it or believe it.
I will address the 2003 event tonight and make the right connections to solar activity.
Yesterday I had a lengthy discussion with Leif Svalgaard where he attempted to smear my TSI modeling work again
It is always good to busy oneself with such trivia. Curve fitting is easy. Understanding is hard.
Here is the relationship between F10.7 and TSI for solar cycle 24:
http://www.leif.org/research/TSI-Model-F107.png
On the left is the non-linear relationship based on yearly values. The scatter around the regression line is an indication of the uncrtainty of the relationship. If you use a shorter averaging window [e.g. 90 days or even 1 day] the scatter gets much larger. On the right is the observed [red] and modeled [blue] values for solar cycle 24. The ‘error’ [actually the r.m.s. value of the differences between observed and modeled data points] is 0.0054%.
It would be very good for you to make the same two graphs using what you think it should be.
Then a meaningful comparison can be done. This is not difficult to do. I did mine this morning. It took all of 20 minutes.
Hi doc
You objected to my ‘cherry picking’ (using only the last 150 years of data) and not the whole lot of 350 years. The reasons and the associated effect (with additional graph) for the early period are outlined here
https://wattsupwiththat.com/2017/07/05/the-solar-harbinger/#comment-2543571
It is a standard trick to blame the data if they don’t agree with one’s pet ideas. A main objection is that if it is necessary to detrend [i.e. remove the largest part of the variation] to ‘see’ a weak signal, the signal is likely spurious unless you have physical mechanism for removing the major part of the variation. An example is the removal of the change of the GCR proxy due to the change of the Earth’s magnetic field.
In the case of the CET none of your objections apply.
Rising trend of 0.02C /decade has no effect whatsoever either on the decadal periodicity or the extent of the min/max differences moving in a range of up to 2C or more (i.e. rising trend accounts for about 1% or less of the amplitude variability). I did not associate rising trend with the solar activity, only the data’s ‘internal’ decadal variability.
It is simply case that the accuracy of the monthly data from the various parts of Central England used to construct the CET, was not as good 200 or 300 years ago as it was during the 20th century, anyone claiming that it was as good is grossly deluded.
Rising trend of 0.02C /decade has no effect whatsoever either on the decadal periodicity or the extent of the min/max differences moving in a range of up to 2C or more (i.e. rising trend accounts for about 1%
But that is precisely the problem. If solar activity has any influence it should show itself mainly in the trend as that is much larger than the deviations. Unless you have a physical mechanism that numerically explains why not.
The over-compensation of SORCE TSI was derived from TSI RMIB, but we can also [and perhaps better] try to see which correction yields the best agreement with F10.7. I find that -0.01875 W/m2/yr instead of -0.0325 W/m2/yr gives a better fit with F10.7 (especially for the values in 2016 and 2017):
http://www.leif.org/research/TSI-Model-F107.png
Rats! WordPress is playing its tricks again [you can’t update a plot, but have to use a different name]:
http://www.leif.org/research/TSI-Model-F107x.png
if you aren’t certain that WP has not ‘cached’ it, just add note “click on to see the updated version”
Today’s F10.7cm–SORCE TSI model report for July 6:
90-day F10.7average from 4/1 to 6/29 was 76.5 sfu, down from 76.7 yesterday.
90-day TSI average from 4/1 to 6/29 was 1360.7979.
90-day Model TSI = (1+12%)*(0.0127*90-day F10.7)+1359.7 = 1360.7878.
Difference = -0.0101 W/m^2, range error = 0.63%, actual error = 0.000742%
0.007%/0.000748% = 9.4X better today than his claimed model accuracy.
How ironic that yesterday I reported a very conservative 1% ‘range error’, which was jumped on, not the much smaller ‘actual error’ because I thought that would be considered too low, yet it was better!
The critical issue how you get to the 12% in (1+12%), which, BTW, be better witten 1.12.
Explain how?
Rather than trying to keep the rise in surface temperatures below two degrees centigrade I suggest we should attempt to remove the tilt of the earth relative to its orbit round the sun. A room temperature of eighteen degrees centigrade is nice but a room temperature eighteen degrees centigrade minus twelve degrees centigrade and a room temperature of eighteen degrees centigrade plus twelve degrees centigrade is not nice, it would be spring all year where I live in the UK , let the geographic poles freeze along with the higher altitude land areas but it does not mean that the mid latitudes would experience an ice age does it we might have just have frosts at night. I do not like being frozen in winter and roasted in summer.
Aren’t harbingers served with a side of harpies?
David – I think your name (link) at the bottom of the article has been hacked.
High solar activity.at the top of the modern maximum drove the 2003 European killer heat wave.
The modern maximum in solar activity is defined as the most recent highest sunspot number average over the longest time period:
2003-4 were the last years of the 70-year modern maximum that had produced a magnificent temperature rise worldwide, partly evidenced by the high temps of the AMO in 2003, which sourced the western European seasonal lag from the maritime influence of the Atlantic warm waters part from the wiki quote.
 ?dl=0
?dl=0
http://www.cgd.ucar.edu/cas/catalog/climind/AMO_fig123.gif
There were two solid TSI spikes in 2002 that built ocean heat up just before the summer sun of 2003 to build on, which still had enough strength for significant warming, delivering many ‘solar TSI blasts’ above my SORCE warming line, providing the energy for the combination with hot continental air and strong southerly winds during July and August:
The fact that this was the deadliest heat wave in almost 500 years since the Medieval Warm Period, is testimony to the strength and duration of solar activity in the 20th century, to the incredible power of TSI.
The modern maximum in solar activity occurred during the 70 years from 1935 to 2004, when the annual average v2 sunspot number was 108.5, 65% higher than during the previous 70 years, when the annual average was 65.8, from 1865-1934.
This is what you can get when you carefully cherry pick the length and the start and end times of sections of a variation with a ~100 year period. If you widen your horizon a bit and try to be a little less biased and look at the averages over the long ‘cycle’, then we can look at the Group numbers for the 18th, 19th, and 20th centuries:
18: 4.31 2% above mean [for 1700-1999: 4.23]
19: 3.83 9% below mean
20: 4.55 8 % above mean
Then the numbers are a lot more reasonable [none exceeding 10%], as you can also see by eye just by looking:
http://www.leif.org/research/GN-SN-since-1700.png
There are little difference between centuries, and 2003 is not special in any way, perhaps with the exception of the very deep minimum in TSI associated with the Halloween storm.
The influence of TSI is certainly there, to the tune of 0.1K [in yearly means] over the solar cycle.