Reposted from Roy Spencer’s Blog. Original here.
July 6th, 2017 by Roy W. Spencer, Ph. D.
It was inevitable that the new RSS mid-tropospheric (MT) temperature dataset, which showed more warming than the previous version, would be followed with a new lower-tropospheric (LT) dataset. (Carl Mears has posted a useful FAQ on the new dataset, how it differs from the old, and why they made adjustments).
Before I go into the details, let’s keep all of this in perspective. Our globally-averaged trend is now about +0.12 C/decade, while the new RSS trend has increased to about +0.17 C/decade.
Note these trends are still well below the average climate model trend for LT, which is +0.27 C/decade.
These are the important numbers; the original Carbon Brief article headline (“Major correction to satellite data shows 140% faster warming since 1998”) is seriously misleading, because the warming in the RSS LT data post-1998 was near-zero anyway (140% more than a very small number is still a very small number).
Since RSS’s new MT dataset showed more warming that the old, it made sense that the new LT dataset would show more warming, too. Both depend on the same instrument channel (MSU channel 2 and AMSU channel 5), and to the extent that the new diurnal drift corrections RSS came up with caused more warming in MT, the adjustments should be even larger in LT, since the diurnal cycle becomes stronger as you approach the surface (at least over land).
Background on Diurnal Drift Adjustments
All of the satellites carrying the MSU and AMSU instruments (except Aqua, Metop-A and Metop-B) do not have onboard propulsion, and so their orbits decay over the years due to very weak atmospheric drag. The satellites slowly fall, and their orbits are then no longer sun-synchronous (same local observation time every day) as intended. Some of the NOAA satellites were purposely injected into orbits that would drift one way in local observation time before orbit decay took over and made them drift in the other direction; this provided several years with essentially no net drift in the local observation time.
Since there is a day-night temperature cycle (even in the deep-troposphere the satellite measures) the drift of the satellite local observation time causes a spurious drift in observed temperature over the years (the diurnal cycle becomes “aliased” into the long-term temperature trends). The spurious temperature drift varies seasonally, latitudinally, and regionally (depending upon terrain altitude, available surface moisture, and vegetation).
Because climate models are known to not represent the diurnal cycle to the accuracy needed for satellite adjustments, we decided long ago to measure the drift empirically, by comparing drifting satellites with concurrently operating non-drifting (or nearly non-drifting) satellites. Our Version 6 paper discusses the details.
RSS instead decided to use climate model estimates of the diurnal cycle, and in RSS Version 4 are now making empirical corrections to those model-based diurnal cycles. (Generally speaking, we think it is useful for different groups to use different methods.)
Diurnal Drift Effects in the RSS Dataset
We have long known that there were differences in the resulting diurnal drift adjustments in the RSS versus our UAH dataset. We believed that the corrections in the older RSS Version 3.3 datasets were “overdone”, generating more warming than UAH prior to 2002 but less than UAH after 2002 (some satellites drift one way in the diurnal cycle, other satellites drift in the opposite direction). This is why the skeptical community liked to follow the RSS dataset more than ours, since UAH showed at least some warming post-1997, while RSS showed essentially no warming (the “pause”).
The new RSS V4 adjustment alters the V3.3 adjustment, and now warms the post-2002 period, but does not diminish the extra warming in the pre-2002 period. Hence the entire V4 time series shows more warming than before.
Examination of a geographic distribution of their trends shows some elevation effects, e.g. around the Andes in S. America (You have to click on the image to see V4 compared to V3.3…the static view below might be V3.3 if you don’t click it).

Gridpoint lower tropospheric temperature trends, 1979-2016, in the V3.3 versus V4 RSS datasets.
We also discovered this and, as discussed in our V6 paper, attributed it to errors in the oxygen absorption theory used to match the MSU channel 2 weighting function with the AMSU channel 5 weighting function, which are at somewhat different altitudes when viewing at the same Earth incidence angle (AMSU5 has more surface influence than MSU2). Using existing radiative transfer theory alone to adjust AMSU5 to match MSU2 (as RSS does) leads to AMSU5 still being too close to the surface. This affects the diurnal drift adjustment, and especially the transition between MSU and AMSU in the 1999-2004 period. The mis-match also can cause dry areas to have too much warming in the AMSU era, and in general will cause land areas to warm spuriously faster than ocean areas.
Here are our UAH LT gridpoint trends (sorry for the different map projection):

In general, it is difficult for us to follow the chain of diurnal corrections in the new RSS paper. Using a climate model to make the diurnal drift adjustments, but then adjusting those adjustments with empirical satellite data feels somewhat convoluted to us.
Final Comments
Besides the differences in diurnal drift adjustments, the other major difference affecting trends is the treatment off the NOAA-14 MSU, last in the MSU series. There is clear drift in the difference between the new NOAA-15 AMSU and the old NOAA-14 MSU, with NOAA-14 warming relative to NOAA-15. We assume that NOAA-14 is to blame, and remove its trend difference with NOAA-15 (we only use it through 2001) and also adjust NOAA-14 to match NOAA-12 (early in the NOAA-14 record). RSS does not assume one satellite is better than the other, and uses NOAA-14 all the way through 2004, by which point it shows a large trend difference with NOAA-15 AMSU. We believe this is a large component of the overall trend difference between UAH and RSS, but we aren’t sure just how much compared to the diurnal drift adjustment differences.
It should be kept in mind that the new UAH V6 dataset for LT uses three channels, while RSS still uses multiple view angles from one channel (a technique we originally developed, and RSS followed). As a result, our new LT weighting function is a little higher in the atmosphere, with considerably more weight in the upper troposphere and slightly more weight in the lower stratosphere. Based upon radiosonde temperature trend profiles, we found the net effect on the difference between the two LT weighting functions on temperature trends to be very small, probably 0.01 C/decade or less.
We have a paper in peer review with extensive satellite dataset comparisons to many balloon datasets and reanalyses. These show that RSS diverges from these and from UAH, showing more warming than the other datasets between 1990 and 2002 – a key period with two older MSU sensors both of which showed signs of spurious warming not yet addressed by RSS. I suspect the next chapter in this saga is that the remaining radiosonde datasets that still do not show substantial warming will be the next to be “adjusted” upward.
The bottom line is that we still trust our methodology. But no satellite dataset is perfect, there are uncertainties in all of the adjustments, as well as legitimate differences of opinion regarding how they should be handled.
Also, as mentioned at the outset, both RSS and UAH lower tropospheric trends are considerably below the average trends from the climate models.
And that is the most important point to be made.
RSS using climate models to correct for orbital decay seems a weird choice. Radiosondes give real temperatures, if only for one place for a very limited time.
TH, what Christy and Spencer did with radiosondes is very clever. They used a series of sonde sites marching up the Pacific Coast from Mexico to Alaska to set their latitude aperture calibration curves to match specifically timed observations. It isn’t just the overall sonde global data versus UAH global as in Christy’s 29 March 2017 congressional testimony. UAH algorithms are ground truthed to the greatest extent possible. Solid science. Mears at RSS, apparently less so.
Above my pay grade but why are coastal sites to be considered representative? I see this all the time and it seems nonsensical to me. The AGW camp continually throws out temperature readings from the West Antarctic peninsula as indicative of Antarctic temperatures when that is obviously deep and disturbed nonsense. Coastal conditions are more prone to the vagaries of wind and weather than anywhere else! They are neither fish nor foul. On top of this obvious flaw, the coasts are where the highest population densities are, making them most likely the most corrupted by UHI!
I’m actually pretty sure the AGW contortionists know this very well. The West Antarctic peninsula is absolutely used to decieve in this way!
One way I feel sure that AGW is baloney is the persistent lies it’s proponents spew! If the theory was true, why would so many feel the need to lie and deliberately decieve? Michael Mann!
John Harmsworth
You are getting on the right track.
If you want to take a representative sample of surface stations:
1) take at least 50
2) no. of stations NH = no. stations SH
3) all latitudes of the surface stations counted together must come to zero
4) since we have earth 70% water and 30 % land, sample your stations 70% in or at sea and 30% in-land [for each HS]
5) to eliminate the need to bring in longitude as a variable, you look at the derivative of the T anomaly, i.e. the average change from the average over the period, in K per year.
6) you need 4 points to define a function, so you have to do at least 4 linear regressions for each weather station.
If you do it right [it is not so difficult] you should get the same results as what I am getting.
https://wattsupwiththat.com/2017/07/07/comments-on-the-new-rss-lower-tropospheric-temperature-dataset/#comment-2545190
let me know how you fare.
Both RSS and UAH show lower warming than the radiosondes.
From moyhu: “it means that radiosondes are showing more warming that satellites. With UAHV6.0 it is a lot more; with RSS TLT V4 it is closer, but sondes still show more warming. As the FAQ says:
“Note that all satellite data warm relative to radiosondes before about 2000, and then cool after about 2000. We don’t know if this overall pattern is due to problems with the radiosonde data, with the satellite data or (most likely) both.” ”
https://moyhu.blogspot.com
The problem is this.
Satellites MATCH the surface BOTH LAND and OCEAN from 1979 -1998.
in 1998 a new sensor was introduced AMSU.
post AMSU
Satellites Match the Ocean Temps,
But
They do not match the Land temps.
In particular
They do not match the land temps at Higher latitudes in areas where snow cover is present.
Sondes are a dogs breakfast that has more data changes instrument changes, and changes in observation practices than ANY OTHER DATASET
This was at your pal Nick’s site…saying your 1979-1998 claims were baloney. In fact, they showed better matching post-AMSU, at least until 2008ish…
http://www.moyhu.org.s3.amazonaws.com/2016/1/GISS_sat_trend.png
Mosh,
The “land temps” are what comes out the other end of a dog. And the high lat “temps” are particularly wet, sticky, stinking canine CACA. They’re not just “adjusted” beyond recognition, but flat out made up.
“but flat out made up”
As is MOST of the SH ocean “data”., African “data”, South American “data”, Russia “data” etc etc etc
nb “data” in quotes.. because it isn’t really data.
FABRICTION alley !!
Just what are you feeding that mutt, Mosh?!
What is your reference for this?
http://www.woodfortrees.org/plot/rss-land/from:1998/plot/crutem4vgl/from:1998/plot/uah6-land/from:1998/plot/uah6-land/from:1998/trend/plot/crutem4vgl/from:1998/trend/plot/rss-land/from:1998/trend
The coverage of land from surface data sets are awful, so how can you judge which is correct?
The land coverage is mostly North America and Europe while generally made up elsewhere with very limited stations.
Again, with reference to what?
Surface data sets has increasingly removed these type of locations out.
Thanks for reposting. Read this morning and thought it a quite level headed discusssion similar to Dr. Spencer’s post on UAH V6, a year before the paper on V6 finally published. The real,takeaway is that UAH converges with radiosondes and RSS doesn’t, suggesting the new UAH V6 is better.
Actually not.
Dont bother to point to anything you are Roy claim. Neither of you produce data and actual code.
your work cannot be checked.
just like Mann’s
steven mosher ,your thread awaits https://realclimatescience.com/2017/07/the-steven-mosher-challenge/
It is important to note that UAH and HadSST3 are moving in the same direction: cooling.
https://rclutz.wordpress.com/2017/07/07/ocean-cools-and-air-temps-follow/
Ooh, Mikey is not gonna be happy about this.
Woosp…this should have been one comment up in response to S.M.
‘The bottom line is that we still trust our methodology. But no satellite dataset is perfect, there are uncertainties in all of the adjustments, as well as legitimate differences of opinion regarding how they should be handled.

Also, as mentioned at the outset, both RSS and UAH lower tropospheric trends are considerably below the average trends from the climate models.’
The bottom line is that they are still wrong [to me] as my results show differing results….
Concerned to show that man made warming (AGW ) is correct and indeed happening, I thought that here [in Pretoria, South Africa} I could easily prove that. Namely the logic following from AGW theory is that more CO2 would trap heat on earth, hence we should find minimum temperature (T) rising pushing up the mean T. Here, in the winter months, we hardly have any rain but we have many people burning fossil fuels to keep warm at night. On any particular cold winter’s day that results in the town area being covered with a greyish layer of air, viewable on a high hill outside town in the early morning.
I figured that as the population increased over the past 40 years, the results of my analysis of the data [of a Pretoria weather station] must show minimum T rising, particularly in the winter months. Much to my surprise I found that the opposite was happening: minimum T here was falling, any month….I first thought that somebody must have made a mistake: the extra CO2 was cooling the atmosphere, ‘not warming it. As a chemist, that made sense to me as I knew that whilst there were absorptions of CO2 in the area of the spectrum where earth emits, there are also the areas of absorption in the 1-2 um and the 4-5 um range where the sun emits. Not convinced either way by my deliberations and discussions as on a number of websites, I first looked at a number of weather stations around me, to give me an indication of what was happening:
The results puzzled me even more. Somebody [God/Nature] was throwing a ball at me…..The speed of cooling followed a certain pattern, best described by a quadratic function.
I carefully looked at my earth globe and decided on a particular sampling procedure to find out what, if any, the global result would be. Here is my final result on that:
Hence, looking at my final Rsquare on that, I figured out that there is no AGW, at least not measurable.
Arguing with me that 99% of all scientists disagree with me is useless. You cannot have an “election” about science.
Henry..and you would be right…min T has been falling all over…..check Tony’s blog, he’s been posting about it a lot
……flies in the face of global warming theory
link?
Tony Heller aka Stephen Goddard, Deplorable Real Climate Science blog. His stuff has improved markedly the past few years.
Twitter > https://twitter.com/SteveSGoddard
Blog > https://realclimatescience.com/
He’s been pumping out the videos lately. Youtube channel > https://t.co/jNSTAz2NOa
The temperature plots below show that Summertime T max for the USA mainland are on the decline over various time frames. I don’t know if this is typical for other regions; but , I assumed (maybe in error) that Summertime T min might have increased for the USA Mainland might have increased due to less night time cool-down possibly associated with UHI. Is that incorrect? ?w=720
Please stay where you are, Henry. The IPCC thought police are extremely busy at present with an outbreak of independent thinking. They’ll be around as soon as they can but it is spreading! Please stay indoors and don’t talk to anyone!
Roy: Why not use autocorrect to expand “LT” to “lower troposphere”? That way when a passage of yours is quoted, it will be self-explanatory.
It already should be self-explanatory.
But to the more casual reader it is not self-explanatory. It is mumbo-jumbo until one goes back to the very beginning of the post and finds the definition of LT as “lower tropospheric data set.” I once reviewed the emergency plan for a nuclear power plant that was filled with local abbreviations. I could not understand it. I finally had them send me the .doc file so I could make the substitutions of the translations into the text. Then it made sense. Write for yourself if you wish, but then translate it for the reader.
John A
“I suspect the next chapter in this saga is that the remaining radiosonde datasets that still do not show substantial warming will be the next to be “adjusted” upward.”
…not funny…would not put it past them at all
Schmidt, Karl, Mears….IPCC AR4 WG1 dissed the radiosonde humidity sensors to establish the myth of constant RtH in AR4 WG1 black box 8.2. See the long climate chapter of The Arts of Truth for details. For a less detailed update, see essay Humidity is still Wet in Blowing Smoke. Radiosonde temperature sensors do not need the same cross instrument calibrations as cold biased humidity sensors. But warmunists will probably come up with something now that Mears overcooked diurnal drift. For the origins of all this, see the details in the humidity section of the climate chapter in TAoT. Is a warmunist tradition with a history going back at least to 2006 and my critique of the paper in footnote 57.
I think Roy has already suggested that will most likely happen.
Thanks for posting this. I took a break and was in the process of visiting Dr. Spencer’s site to look for it as referenced in comments in earlier post.
Balloons/radiosondes are direct observations and adjusting that dataset (balloons) upward to match a climate model used to adjust a satellite dataset would seem to be an outright fraud. As Dr. Spencer wrote, that may become the next saga in the adjustment game. I hope not.
“Balloons/radiosondes are direct observations and adjusting that dataset (balloons) upward to match a climate model used to adjust a satellite dataset would seem to be an outright fraud.”
Well said Eyes. Exactly right.
“I suspect the next chapter in this saga is that the remaining radiosonde datasets that still do not show substantial warming will be the next to be “adjusted” upward.”
…
“And that is the most important point to be made.”
=====================
Climate science 101.
Who “OWNS” the radiosonde datasets?
In most industries or endeavors, adjusting any historical data will get you a trial and a sentence for fr@ud.
It is not like there is no money involved here, or if there are no laws against malfeasance.
Where do we find the explanations for the changes in the surface temperature charts?
At least with satellite adjustments we are given reasons for why they were made.
The real problem is that they have not yet got a clue as to what is currently spewed by the Sun that is actually causing the inaccuracies….
You are kidding. “Karlization” is based on a paper; read it.
Karlization is a very specific recent adjustment.
It is separate from the adjustments made to the surface time series charts that has been occurring for many years.
The original charts bear little resemblance to the same charts today.
My understanding is that many adjustments are being made with no disclosure at all.
The numbers just change…if not for people keeping records of what was published in past years, or using the wayback machine, or finding the old records stashed away some where…we would have no clue.
Local Oil Dealers have reams of degree days files in their archives that they use to schedule their input and output deliveries. This is available all over the country and why can’t we resurrect this data. Same should apply for propane suppliers. Degree days should be useful but how far back?
Imagine if conservatives went back and “adjusted” records of unemployment, income, etc, and used the revised charts of such to prove some economic theory was a fact?
And every adjustment just happened to make the old records fall into line with that theory?
And that therefore all future policy on taxation and such should be altered given what was “known” about how the economy responded to changes in tax policies in the past?
Who would accept this?
These are test shots for a future assault on democracy. Very reminiscent of old style Communist regime tactics. Further indication that it’s all a pack of lies.
“..RSS instead decided to use climate model estimates of the diurnal cycle…”
Mosh loves to reference this issue whenever RSS is mentioned at WUWT. Wonder if he’ll still side with RSS over UAH…
why do you feed this crap last time i post hereTony heller was right all along
I will never forget AW post at lucias saying that tony heller was untrustworthy my god he was so so wrong
Eliza, peace. On the narrow specific, Heller was wrong and Watts right. On the broader issue involved, AW already apologized for overreacting in a past post here. And Tony Heller has also improved his analysis. All his historical comparisons the past few years (2-3) are spot on and unassailable in my somewhat educated view. We all make mistakes. Most learn from them. Both Tony and Anthony appear to have learned. Highest regards from a devout skeptic with now parts of two and one full published ebooks on the topic.
https://tonyhellerakastevengoddard.com/
“devout skeptic”
???
Heller is wrong and misleading in every single chart he produces.
Further he never produces work that can be reproduced.
He FAILS the Mcintyre test.
as does you work.
Mosh is a PAID parrot of WORST. a pseudo-science outfit paid for by socialist totalitarian globalists.
AGENDA, anyone !!!!
Mosher, the sum total of all refutaiions of Heller’s work is warmistas such as yourself rolling your eyes and badmouthing him in ways that ignore the subject material 100%.
As was the case last night.
Steven Mosher appears to have gone off scale with his desperate fraudulent claims. All of my graphs are easily reproducible. I make my source code available.
Mosher is the guy from BEST?
Steven Mosher,
Your sweeping comment sounds fairly desperate to me but more specifically, can you explain what you mean by “as does you work“?
Steven Mosher July 7, 2017 at 4:05 pm wrote: “Heller is wrong and misleading in every single chart he produces. Further he never produces work that can be reproduced. He FAILS the Mcintyre test.
as does you work.”
I guess Tony heard about your trashing him and is calling you out, Steven Mosher. Why don’t you go to his website and take him up on his challenge. You say he is wrong and misleading in every chart, so prove it.
Heller had some of his work presented to President Trump before Trump decided on the Paris Accord. Did you give any climate change presentations to the Trump administration, Steven?
Mosher, gets excited, then go silent when Tony Heller, he had slimed with his sweeping unsupported statement.
Mosher foot in the mouth comment,
“Heller is wrong and misleading in every single chart he produces.
Further he never produces work that can be reproduced.
He FAILS the Mcintyre test.
as does you work.”
Tony Hellers challenge,
https://realclimatescience.com/2017/07/the-steven-mosher-challenge/#comments
=============================================================
No response so far……….
Where are you Mr. Mosher?
The Steven Mosher challenge
https://realclimatescience.com/2017/07/the-steven-mosher-challenge/
From what I gather, Mr. Mosher majored in English in college. His command, or at least usage of English as evidenced by what he wrote, shows poor skill. Nevertheless, whatever formal training he had in science (probably some course for non-science majors) failed in imparting the basics of the scientific method, which is based on hypothesis testing.
His statement about you is incredibly ludicrous and absurd. Just one example of your graphs being reproducible would disprove Mr. Mosher’s unintelligent comment. But alas, you are honest enough to admit that you make a mistake from time to time.
Mr. Mosher’s command of the scientific method is likely certainly worse than his command of the English language, which we have already seen by his comment to be sloppy.
I am guessing that they tried several approaches and chose the one that gave the ‘best’ results.
From Roy Spencer on UAH V6:
” For example, years ago we could use certain AMSU-carrying satellites which minimized the effect of diurnal drift, which we did not explicitly correct for. That is no longer possible, and an explicit correction for diurnal drift is now necessary. The correction for diurnal drift is difficult to do well, and we have been committed to it being empirically–based, partly to provide an alternative to the RSS satellite dataset which uses a climate model for the diurnal drift adjustment.”
Mods,
All my comments seem to go into moderation now.
Reply: Yes, I’ve been digging them out as soon as I see them. I’ll check with Anthony if this is intentional or not. It could take days for him to get back to me. But I will pursue it.~ctm
A while back Janice observed that a bunch of her comments seemed to end up in moderation. IIRC, she tried a few things including breaking up long comments into smaller parts to see if that made them more likely to get through.
I’ve also experienced comments that seemed to hide in the bit bucket for a long time. I really can’t see a pattern. Maybe it’s how you hold your mouth. 🙂
Putting all your comments into moderation creates more work. FWIW, YMMV
Nick, there’s really no provenance to a calculation or adjustment that depends on a hypothetical model, I believe that might be Dr. Spencer’s point?
We use empirical data to validate models. We don’t ever validate models using models. Have I missed something?
Nick
You are a glutton for punishment. You didn’t use to be a gladiator at the colosseum in a past
Life did you? 🙂
Always good to read your informed comments even if I do not generally agree with you although I did support your stance over the non peer reviewed article yesterday.
Tonyb
If I remember right, I thought that I had read in the last rule change where one way in which comment/s can get placed in moderation is when one poster makes x amount of comments on a post.
“We don’t ever validate models using models. Have I missed something?”
This isn’t validating models. It is the necessary diurnal correction. With satellites you only get two readings per day, and so you have to figure out how they are representative of the day. You need an expected pattern of diurnal variation, and that depends on altitude, latitude, whether over land or sea, etc. Any way of working that out is going to look pretty much like a model.
ps Thanks, ctm
Bartleby
Let us not confuse having a particular skill set with intelligence, or even with education in general.
Having arcane knowledge of a narrow subject that few are well versed in is not the same thing as being smart.
Menicholas, you are 100% spot on!!!!!
…
Assume you had an accident and ripped a lot of your skin off of your left arm.
…
Would you want a 1st year intern at the ER sew you up, or would you consider a 20 year veteran seamstress stitch up your wound?
…
?
“With satellites you only get two readings per day”
I am astounded at this. I would have expected that the satellites would provide an entire day’s measurements. Even if they only downloaded them once or twice a day.
Mosh and Stokes – the tweedledum and tweedledee of shills.
Don K – (I’m assuming there was a quotation difficulty 🙂
I was reading this in the general context of “validation”, which may include things that lack empirical evidence. Validation based on empirical evidence is expected.
It this example, if your analysis is correct, the adjustment isn’t based on physical theory and relies on a “best guess” based on observation. If I could see the paper to find out how that “best guess” was arrived at I could come to a different understanding. I don’t believe I would call that process “validation” though, instead I think it’s called “calibration”.
Hivemind July 7, 2017 at 8:45 pm
“With satellites you only get two readings per day”
I am astounded at this. I would have expected that the satellites would provide an entire day’s measurements. Even if they only downloaded them once or twice a day.
The satellites measure twice a day over any given point on the planet.
Actually the Published a study looking at SENSITIVITIES of all their adjustments.
This allows you to estimate structural uncertainty.
Roy doesnt do this.
What you will find is that if you explore ALL the adjustments and ALL the possible rational adjustments
that the structural uncertainty in satellite “data” is very large.
Another way to look at it is this.
When you choose to do and adjustment ( or chose not to) you have uncertainty. Uncertainty in your method.
The differences between methods shows you the structural uncertainty in a dataset.
compared to various surface products the uncertainty between various satellite products is high
Only a TRUE BELIEVER would insist that One satellite product gets it right. The disagreement between RSS and UAH indicates that they both still have uncertainty in their methods.
With surface datasets you have multiple different datasets and no less than 4 different methods.
The difference between the series is slight and the adjustments are likewise minor.
They cool the planet
NASA says the satellites are more accurate than the surface temperature record.
What do you say TA?
Basically ANYTHING has to be more accurate than the GISS et al surface data. !!
So satellites suck and the surface data set adjustments are minor. Can’t believe in 2017 people are still pushing this blatant lie.
talking about adjustments, did zeke ever get to the bottom of the sawtooth pattern issue as a result of crs darkening over time then refurbishment introducing a sharp drop in temperature ? i can’t seem to find the outcome of that . https://judithcurry.com/2016/02/09/assessing-u-s-temperature-adjustments-using-the-climate-reference-network/
I have a simple question. Should the satellite data match the measured balloon data? Yes or no would suffice.
The short answer is “no.” The long answer is you cannot compare a measure of microwave brightness (from a satellite) to the measure of a platinum resistance thermometer in a radiosonde. It’s apples and oranges.
Finally the longest answer is…..you can use the radiosonde data to calibrate the model that estimates the atmospheric temp from the microwave brightness. You can then “adjust” the output of the model to be comparable to radiosonde data
Luis,
If I had given such an answer as you offered when I was in my 10th grade science class I would still be in the 10th grade. You fail in reading comprehension.
Of course. If you purport to be measuring temperature, then the temperature values you produce should agree with temperature values obtained by other methods. If my mercury thermometer disagrees with my thermistor, something is wrong.
Apparently eyesonu, you must have dropped out from the 10th grade.
Seriously eyesonu, a satelittel MSU/AMSU will give you a voltage reading. A PRT gives you a current measurement. So, since you are so adept and knowledgeable about such things, can you campare a voltage reading (satellite data) to a current reading (ballon data) ? Do you know the difference between voltage an current?
commieBob, you can place your mercury thermometer and your thermistor into the same water bath. You can’t put the MSU/AMSU and the radiosond side by side.
They both produce temperature values by means of proxies. If they don’t agree, then you’ve done something wrong.
The tricky bit is that the satellite is measuring the temperature of a broad vertical layer of the atmosphere. The balloon is measuring the temperature at whatever exact altitude it is at. You have to produce a temperature profile from the balloon data, figure out a single temperature value to describe the whole layer and then calibrate the satellite based on that.
The simple version is that the satellites and balloons have to agree. How you actually make that happen is the hard part.
commieBob: “The tricky bit is that the satellite is measuring the temperature of a broad vertical layer of the atmosphere.”
..
Nope, satellites don’t measure temperature, they measure microwave emissions.
…
Comparing microwave emissions with the reading from a platinum resistance thermometer, is the same as comparing apples to oranges.
Read my comment again … a few times if you have to.
If you don’t trust the wiki article, here’s an article from another source.
One more time … the satellites have to agree with the balloons. Quit making stuff up based on the way you think it should be and take the time to find out how things actually work.
commieBob, satellites do not measure temperature. They measure microwave brightness. If you disagree please tell me how the measure temperature.
“commieBob, you can place your mercury thermometer and your thermistor into the same water bath. You can’t put the MSU/AMSU and the radiosond side by side.”
If you cannot imagine a way to use one to calibrate the other, the problem is with your ability to design a procedure that can do so.
Basically you are saying you do not know how to do it, have never imagined a way to do it, and so it is not possible.
Milliken figured out how to measure the size of molecules using a drop of oil and a vessel full of water.
Mendeleev figured out how to predict the existence of elements that were as yet undiscovered, and how to accurately estimate many of the properties of these as yet undiscovered elements.
Gregor Mendel figured out principles of genetic inheritance before anyone had any idea of how cells even reproduced, and did it using some pea plants and a lot of patience and observation.
Examples abound, and if it was not the end of a very long day in the very how sun I might think of some that were very closely analogous to what is needed here.
Much of the advancements in science were made by people who figured out how to do complicated things or reveal hidden principles, using simples means and cleverly designed experiments.
For all the money spent of climate studies, and the impact on policies that effect every human being on Earth, I think it should be readily achievable to use a well designed series of radiosonde releases to properly and accurately calibrate the devices on the satellites to the actual temperature of the atmosphere.
“it should be readily achievable to use a well designed series of radiosonde releases to properly and accurately calibrate the devices on the satellites to the actual temperature of the atmosphere.”
…
You are correct, except for the fact that the satellites cannot measure temperature.
Luis, this is a tired argument…and well discussed here and elsewhere many time.
Mercury thermometers measure the expansion of a liquid.
Thermistors measure the variance of electrical conductivity in a material as it changes temperature.
Thermocouples do the same thing using changes in the electrical conductivity of two materials as the temperature varies.
Bimetal thermometers use the differing rates of expansion of different metals to produce a mechanical displacement and this is used to infer the temperature of the strip.
Once calibrated, all such devices measure the same physical property yet do so by means of different properties of the materials that comprise them.
So I am wondering…do you assert that satellites and the way they infer the temperature of the atmosphere are unfit for purpose?
That the measurements they give differs in some fundamental way from other ways of assessing the heat content or temperature of an object or medium, and that calibration with other means of doing so is impossible or a fools errand?
Just what are you saying?
Menicholas…..
…
You can get a large container of water.
..
You can then put a mercury thermometer, a thermistor, a thermocouple, and a bimetallic thermometer into that container ALL AT THE SAME TIME and compare the results.
..
You can’t do a comparable matching with a satellite and a radiosone.
…
Satellites and radiosones measure different things.
Luis, you are being purposefully dense. Ever heard of calibration? Measurement of temperature is done by a multiplicity of methods, which are equivalent in the proper range. A bloody mercury in glass thermometer is useless beyond the freezing point of mercury, or the boiling point of mercury.
Luis A all temperature measurements are relative and all instruments need calibration. The trouble is that the vast majority of scientists do not know how instruments work, how to calibrate them and do not have the mathematical ability to work out errors of measurement.
cementafriend, what data are you basing your assertion on? How do you know what ” the vast majority of scientists” know or don’t know? Are you a professional scientist measurement specialist?
Oh thank you Tom Halla, thank you very much!!!!
..
Ever heard of calibration?
..
Yes I have.
..
Tell me, how do you calibrate “microwave brightness” with “temperature?”
Give me a fleet of weather balloons, access to satellite data including path and positional information, a budget to hire a team of experts and technicians, and I will design a procedure for making such a calibration, and bet money that the results thusly obtained will be verified by any other means.
Menicholas: “Give me a fleet of weather balloons, access to satellite data including path and positional information, a budget to hire a team of experts and technicians”
…
Good luck.
…
With the current political climate, I don’t think they will allocate a single penny to fund your request.
…
However, calibrating satellite data with radiosone data would be a step forward. even though Mears, Spencer and Christy have already tried to do it.
Yes, and it looks like Spencer and Christy succeeded.
Good grief. Has no one here ever done any engineering? A lot of instruments come with “corrections”. Take several micrometers and measure the same “standard” thing. There will usually be differences and often no calibration can be done. A chart of adjustments is supplied with some instruments. Everything has measurement error. The question is how much and does it matter?
The simple “yes or no” response requested is totally inappropriate.
How may Firkens in a Hogshead? Depends how you pour … or the current size of a barrel. Nothing is as it first seems.
Luis, you said: “Tell me, how do you calibrate “microwave brightness” with “temperature?””
You’ve gotta be kidding me. You do understand that microwave emissions are a direct function of -temperature-, right? Ever heard of the Stefan–Boltzmann law? Observing microwave “brightness” allows one to directly measure of temperature via that law, same for observing IR and using that to measure temperature. And same for observing visible wavelengths and using those to determine temperature as your stove starts to glow as the temperature rises. That’s why your stove starts to glow in the first place, and why fire glows; the earth is much cooler and instead its glow is in the microwave to IR range as affected by the emissitivity values of the material doing the glowing, which is molecular oxygen in the case of the microwave emissions the satellites observe–read more here: http://onlinelibrary.wiley.com/doi/10.1029/RS023i005p00721/full .
It is simple to calibrate instruments to measure these, thanks to the Stefan–Boltzmann law. You can do it at home in your kitchen if you have a thermometer and a millimeter wavelength (microwave) camera.
Please educate yourself on basics of emmissive physics, and radiative cooling (cooling by radiating electromagnetic waves like microwaves, which when observed tell you exactly what temperature the source of the radiation was at).
The question was:
The short answer is still yes. Balloon data is used to confirm the accuracy of the satellite data.
You talk about micrometers. They are usually sufficient for the shop floor. If more accuracy is required, maybe you need a metrology lab. What you need depends entirely on what you’re trying to do.
It seems a bit odd that any diurnal drift in the past would have caused a cooling bias.
A quick question, the climate model that Mears is using for the adjustments do have CO2 as one of many input parameters (I have checked). Does anywone know if any increasing “warming” calculated by these models from CO2 is a part of Mears diurnal adjustments?
I have some knowledge from writing about this carefully. See essay Humidity is still Wet in ebook Blowing Smoke for a detailed diurnal drift discussion including details for each satellite. Mears used to use climate model output to detect diurnal drift (disagreement in temp results). Obviously problematic because drags in model error. See my very recent guest post here ‘Why Climate Models run Hot’ for details.
Now he is correcting that model correction with observations. As Roy Spencer so politely put it in the main post here, “method seems convoluted” and ” we cannot trace all the corrections”. Nuff said.
The corrections have the odor of hacking about them.
“We have a paper in peer review with extensive satellite dataset comparisons to many balloon datasets and reanalyses. These show that RSS diverges from these and from UAH”
It seems this finding would be compulsive evidence? We have two data sets in minor disagreement, shouldn’t we explore this further before making any adjustments? Is there a third party that might break this “tie”? If UAH and radiosonde data agree, where is the question?
“Is there a third party that might break this “tie”? If UAH and radiosonde data agree, where is the question?”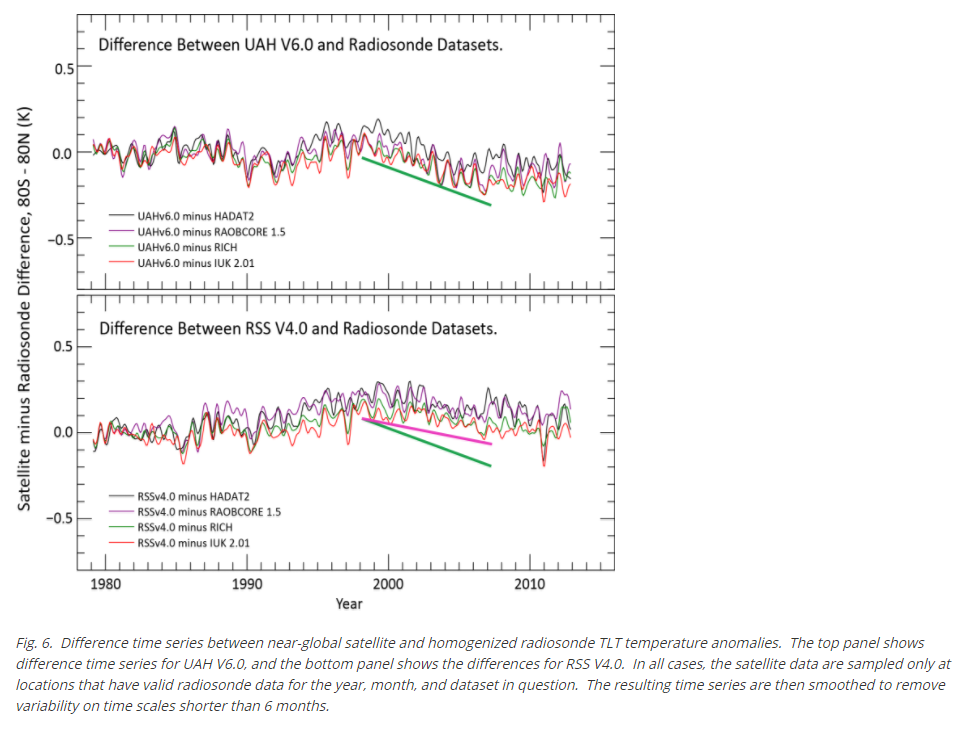
RSS has a FAQ here, and they give a comparison with radiosondes. They conclude that sondes are showing more warming than either RSS TLT or UAH, but RSS is closer:
Radiosonde global data sets are worthless. There simply isn’t enough data or coverage.
“Radiosonde global data sets are worthless. There simply isn’t enough data or coverage.”
One could say the same thing regarding the surface data, whether land or ocean.
In fact many do…often!
And that is true before the very many cryptic so called “adjustments” to the data sets.
I’m sorry Nick, but again I don’t understand.
You write: “but RSS is closer”
Looking that graphs that seems backwards? It seems to show that the RSS data varies (in a trend) more than it does with the UHA data?
BTW, I do believe this represents an empirical validation of the satellite models since the radiosondes are an independent source based on a different technology. I agree the radiosondes lack coverage, but complete coverage isn’t required for validation.
Nice try Nick.
From the FAQ; “In the top panel, I drew a green line (by hand, not a fit) that represents the difference trend between UAH and the various radiosonde datasets for 1998-2007. In the bottom panel, I drew a pink line that represents the difference trend between RSS V4.0 and the radiosonde.”
A “hand drawn line” in a scientific paper? Of course, how better to exaggerate the difference in the data.
Other interesting points include:
“The biggest effect of the adjusted diurnal cycles is to reduce the amount of adjustment made to NOAA-15 as its equatorial crossing time drifted from about 7:30 in 1998 to about 4:00 in 2010. For both the PM and AM passes of the satellite, the adjusted diurnal cycle shows less change during these times. We should note that the largest change is in the morning. Because of this, in the old version, we were overcorrecting early morning cooling for NOAA-15. Of course, changing the diurnal correction also changes the results for all the other satellites, but the largest effect was for the time period when NOAA-15 was drifting rapidly (1999-2007), both because of the time of day that is was operating, and because of the lack of other co-observing AMSU satellites (prior to the launch of AQUA).”
Why would they choose the satellite with the most rapidly changing diurnal crossing times, NOAH-15, and then adjust all of the satellites to “correct” the NOAH-15 readings.
“We also found that NOAA-15 and AQUA appeared to undergo calibration drifts late in their respective lifetimes that were unrelated to the diurnal adjustment. Part of the data near the end of these satellites’ missions is no longer used. (See the paper for more details.) We also found anomalous behavior for NOAA-18 at the beginning of its mission. The periods excluded in V4.0 are:
NOAA-15 : Excluded after Dec 2011.
AQUA: Excluded after Dec 2009.
NOAA-18: Excluded before Jan 2009.
Huh? So, the NOAH-18 data was “anomalous” for the first four years of it’s mission but suddenly, in 2009, the data corrected itself?
I suspect that most of the changes are of the same variety as the “hand drawn” trend line, unscientific manipulation of the data to achieve a desired result; warming the data.
Going y the charts yo’ve published above, the RSS data isn’t “closer” than the sondes, which in the end is the issue.
I’m familiar with Dr. Mears’ work and also with the RSS party line. In my opinion the sondes are the “gold standard”, that Mears disagrees with this is laughable. The sondes are calibrated against thermometers (you knw, those things with the fluid in them). That’s the instrument reference, like it or not. That Mears would suggest the sondes are out of cal because they don’t agree with the MRSs on RSS is truly humorous.
There is a third Satellite dataset STAR
Yep and UAH matches it very well.
No Andy, STAR v3 is the old faulty dataset. Try v4 instead..
TMT trends in C/decade:
UAH v6, 0.09
RSS v4, 0.14
STAR v4, 0.14
I suggest an “Odd man out” practice…
“I suggest an “Odd man out” practice…”
Indeed so. Here are UAH V6 TMT, NOAA STAR V4 and RSS TMT V4 plotted together, anomaly base 1981-2010. UAH is the odd one out.
Nick
none of them are any good
as the solar activity declines,
http://oi63.tinypic.com/2ef6xvo.jpg
more of the most energetic are able to escape which seriously affect whatever probe material you are using to measure.
On earth we are lucky, as the extra energetic particles from the sun simply get translated into more ozone, peroxides and N oxides, formed TOA.
The satellites do not have this protection.
I am afraid it is back to surface stations if you want to see what is really going on. But you have to take a balanced sample. None of the current surface sample stations data sets are properly balanced. They all give a skewed picture [of warming] because the measurements are all concentrated in the NH.
My data set shows it is globally cooling. T Minimum is falling by about -0.01K/annum since 2000.
Take the advice that I gave John Harmworth. Let me know what results you get.
Nick writes: “UAH is the odd one out.”
But this appears to disagree with the charts you use to compare UAH and RSS agreement with the radiosondes?
If we’re to pick three, I suppose we should decide which three?
“But this appears to disagree with the charts you use to compare UAH and RSS “
Remember those are charts of differences. But also of TLT; the plot above is MT (mid-trop). STAR does not have a TLT product.
Love the way you USE the El Ninos to create a trend.
Shows that CO2 is not involved at all.
Well done , Nick, maybe there is hope for you yet.:-)
Climate science is officially a disaster.
They cannot even measure the surface temperature or any temperature of anything.
Every month, they adjust last month’s temperature because they obviously screwed it up last time.
If we can’t measure anything, why are we wasting all this money on this just made it up by algorithm nothing burger.
The balloon data shows the retained and entrained energy. Retained supports the atmospheric volume via temperature and the entrained is that on its way to space. It is the most meaningful of all datasets and should be time stamped and published at regular intervals.
Data Quality 101. The more version you have of the past, the lower the data quality. Every time you adjust the past you are lowering data quality, to the point where eventually no one will trust the result.
And why limit historical adjustments to temperature? If we adjust everyone’s wealth upwards in the past, because it doesn’t fit the economic forecast models, we can then reassess their taxes and pay off the national debt.
If fact, carried to its logical conclusion, we really don’t need to do anything to fix any problem. All we need do is adjust the past and make the present look either better or worse, depending on whatever it is we are trying to achieve. And voila, problem solved/created.
Oh what a tangled web we weave …
“Data Quality 101. The more version you have of the past, the lower the data quality. Every time you adjust the past you are lowering data quality, to the point where eventually no one will trust the result.”
wrong.
NO, NOT wrong
When it comes to undermining ones own credibility with a very few words, some have an uncanny knack for such.
Amazing.
Mosh might have something there!I think Michael Mann was able to look at a couple of tree rings and determine that the LIA never happened! It’s efficiency I guess. Or else writing the conclusion first.
“Wrong”
By all means keep posting and defending but, given the events pre and post ‘Paris’, nobody believes this cr£p anymore.
What did we get? A ‘paper’ proving that there was no hiatus just in time for Paris followed by a move to discredit the satellite record. Now we have the satellite people caving in an ‘adjusting’ their data to match requirements.
Give it a rest. Data that can be matched to political requirements is not scientific data.
to the point where eventually no one will trust the result….we’re there
My understanding is that science seeks to get the models to agree with the data. What we are seeing here, I have no idea what to call it without starting a religious war.
when models conflict with data ( They always do )
there are three LOGICAL possibilities
A) the model needs correcting
B) the data are wrong
C) both.
D) the assumption is wrong
SM,
And there are three probabilities:
A) The model most probably needs correcting.
B) The data may be wrong, but probably are not.
C) The probability that both are wrong is about the product of the probability of A and B.
Yes, we KNOW the models are wrong. Mosh
Your point is ???
Sounds like his point is the modelers need more money…lots more money!
D) The comparison is unfair (not apples to apples)
Wrong.
Mosh
Polish up on Feynman: when the data doesn’t support the hypothesis / model, the hypothesis / model is wrong. Period.
Radiosonde data, the UAH data and even the newly revised RSS data, all show that the 120+ climate models in the IPCC spaghetti graph are dead wrong – GIGO, too hot by several degrees.
Try as you may, can’t hand wave that away.
In most areas under investigation one would presume that the model was wrong and seek a better understanding.
The climate science way is to alter the reference data.
I am wondering why USCRN is not used more, it seems to be ignored by both sides. I realize it is for the USA over a shorter time frame but it is supposed to be pristine, free of adjustments.
Anyone have a link to the recent plot?
We use it. CRN matches the other stations.
Now ask what happens if you compare CRN with UAH
CRN and UAH and RSSV3.3 match very closely
CRN has greater just at both warmer and cooler, so the recent El Nino has separated the trends ever so slightly.
typo…. just = jumps
Another interesting plot which indicates warming primarily in the Arctic which is not expressed in warmist claims.
More CO 2 over Arctic? Sarc off
No. Magnetic norrh pole has been moving north east. Quite a bit actually in the past 50 years.
Sorry left out plot
http://fs5.directupload.net/images/170304/2x7bkgok.jpg
Catcracking
The warming in the Arctic is in fact the only real “man-made” warming around: the temp numbers are extrapolations from stations [quality unknown] often hundreds or even thousands of miles away.
Mosh and BEST would tell you their extrapolations are reliable. Mother Nature says otherwise, because if it really was as warm in the Arctic as those number claim, there would indeed be far less ice than there actually is. Instead we get steady reports about multi-year ice.
At the September 2016 annual ice minimum, US, Canadian, Russian, Norwegian, Danish and Japanese data showed that there was 4.5 – 5 million sq. km of ice in the Arctic Basin- enough to cover 50% 0f Canada or 75% of Australia.
As always, data beats models / projections.
I suggest you contact Mark Albright at the University of Washington who is analyzing the USCRN trends, anomalies and comparisons with other surface observing sites.
I just looked at it after your comment. I looked at the Maximum and Minimum temperature anomalies using the “Previous 12 months” option.
Since its inception:
Average Maximum Temp anomaly: +0.97
Average Minimum Temp anomaly: +0.63
Average Average Temp anomaly: +0.77
An overheating planet!
Of course, you also need to take into account the starting point for each of those measurements.
Starting Maximum Temp anomaly: +0.74
Starting Minimum Temp anomaly: +2.75
Starting Average Temp anomaly: +1.75
Now to detect the trend of the entirety of the USCRN data, we just need to take the difference.
USCRN Maximum Temp trend (2005 – 2017): +0.23
USCRN Minimum Temp trend (2005 – 2017): -2.12
USCRN Average Temp trend (2005 – 2017): -0.98
Gee, I wonder why they started the “Reference” Climate dataset at positive anomalies instead of ZERO???
Just to be clear, selecting the Previous 12 months option outputs a list of 150 datapoints for every month going back through Jan 2005. The Average anomaly at the top is the average of all 150 monthly values. The starting anomaly is the value of the first month (non-zero, as I pointed out). The Trend is what the actual average of those 150 monthly values would have been if the anomaly would have started at 0, as any “reference” dataset should have done.
Nice observation KTM!
You guys ( especially Rud ) are too funny
Sondes?
https://climateaudit.org/2008/05/27/leopold-in-the-sky-with-diamonds/
“Radiosonde adjusters take adjustment to extremes not contemplated in the surface record – ultimately even changing the sign of the trend. Sort of like Hansen on steroids.
The underlying difficulty for present-day scientists trying to extract information from the historical radiosonde data is that the problems with quality control and meta data in the radiosonde network appear far more severe than surface station record, which is disappointing, given that the radiosonde data was not collected by USHCN volunteers, but by trained climate professionals and that much of the data was collected during the IPCC era. Here’s a statement by Sherwood at realclimate in 2005 summarizing the compromising of the radiosonde record. Many other issues are identified in the specialist literature, problems being already identified in the early 1990s.”
sonde data is a mess. its no gold standard. not even close.
The satellites are based on a model that is based on recapitulating the radiosondes. So what are they supposed to calibrate to?
SM
Are you saying that sonde data is not as recorded raw but due to the IPCC era of the 90’s and “trained climate professionals” of that era can’t be trusted to even record the raw data? I can believe that.
India Meteorological Society [IMS] of Ahmadabad Chapter – I am a life member and served as Hyderabad Chapter committee member for four two year terms — is planned to organize INTROMET-2017 during Nov. 7-10, 2017 on International Tropical Meteorology Symposium on “Advancements in space-based Earth Observations and Services for weather and climate”. On the International Advisory Committee they included Prof. Jagdish Shukla, GMU, USA – in early 70s I was in IMD, Pune and he was in IITM, Pune.
Dr. S. Jeevananda Reddy
Surface data is also a mess.. especially the stuff from WORST.
A monumental FARCE of fabrication and mal-adjustment.
I cannot believe the extent to which you are critical of satellites and radiosonde measurements, while at the same time talk about the surface dataset adjustments as if they aren’t entirely fraudulent.
Is Koch money really worth living a life of delusion?
Pretty obvious all the data is crap! But hey, let’s wing it and throw a few trillion at a problem that probably doesn’t exist! As far as I can tell the weather is no different than the 70’s. A b s o l u t e l y- n o-d i f f e r e n t!
Looking back at some of the truly epic and horrendous flooding events, hurricanes, droughts, blizzards, heats waves, and all manner of weather disasters large and small…it seems that the early to mid-twentieth century alone had occurrences that make more recent weather seem downright tranquil.
Imagine if the super outbreak had occurred in this era of climate catastrophism?
Or the series’ of hurricanes in the 1920-1930s or 1950-1960s?
If the dustbowl occurred now instead of then, it is impossible to imagine the reaction, let alone the response.
The charlatans could take whatever they wanted from a gullible populace in return for nonsensical nonsolutions.
Mosher,
I checked your claims about mess and large adjustments in radiosonde data.
They seem greatly exaggerated. Its 2017 now, and not 2008, so the databases and metadata may have improved since..
There are no large differences between raw and adjusted RICH/RAOBCORE data, or Ratpac A (The latter has fewer stations, but a more elaborate global averaging)
https://drive.google.com/open?id=0B_dL1shkWewaUkFvTEI5VVBMZUE
“[I[n RSS Version 4 are now making empirical corrections to those model-based diurnal cycles.”
Which means, to that extent, comparison of model projections with RSS temperatures is circular.
Models are used to correct the RSS temperature measurements which are used to validate model temperature projections.
And so it goes in the acutely scientific field of consensus climatology.
So, Frank, since you are the expert on all of these satellite issues, tell us how you would correct for the fact that orbital decay of the instrument causes the time of observation to slip in it’s polar orbit?
Pat Frank,
The AMSU era = the “pause” era
UAH v5.6 TLT has the highest trend in the AMSU era, higher than RSS v4 TLT
And guess what, UAH 5.6 doesn’t adjust AMSU data for diurnal drift, but relies on non-drifting AMSU satellites. One can say that UAH 5.6 is a AMSU reference network.
RSS v4 is the dataset that agree best with UAH 5.6 in the AMSU-era. Hence it must have the best diurnal drift correction, proven by the satellites themselves..
“All of the satellites carrying the MSU and AMSU instruments (except Aqua, Metop-A and Metop-B) do not have onboard propulsion, and so their orbits decay over the years due to very weak atmospheric drag. The satellites slowly fall, and their orbits are then no longer sun-synchronous (same local observation time every day) as intended. Some of the NOAA satellites were purposely injected into orbits that would drift one way in local observation time before orbit decay took over and made them drift in the other direction; this provided several years with essentially no net drift in the local observation time.” — All this means, there is some period of years-months when there have been no orbit decay. Why not select such period and compare with good met stations data not manipulated by scientists spreading over the globe and calibrate the satellite data? This will thus provide reliable data sets from satellites and thus one can integrate RSS & UAH data in to one set of data series.
I remember on rainfall — radar data validation process [FAO supplied data]. I found the radars provided very close relation with ground data at lower range of rainfall but at higher range of rainfall the radar data presented underestimation. Through non-linear function this was corrected to get near to ground data.
Dr. S. Jeevananda Reddy
If the science of climatology was being done honestly and in an unbiased fashion, with the goal of arriving at precise and accurate measurements objective reality, such a method as you describe could be discussed and analyzed on it’s merits alone and implemented.
Sadly, that is not the world we are living in today, is it?
Taken as a whole, the comments here (and many points not mentioned, like the problematic and controversial discontinuity that occurred when surface observations using liquid in glass were replaced with electronic sensors) make one thing very clear…measuring the temperature of air is not so straightforward as many might suppose, and measuring the temperature of an entire planetary surface, or of an entire atmosphere, greatly compounds the inaccuracies inherent in any system of such measurements.
So, one might wonder, how justifiable can it be to report such measurements with the precision with which it is done today?
And to create graphs that combine information gather in many ways over many years and that purport to inform us of tiny changes over many decades?
The obvious answer is that it is not justifiable.
And to create public policy that has far reaching and very impactful effects on our entire society, based on highly biased interpretation of such measurements? Based on cryptic and biased adjustments to past measurements?
We are far from what is scientifically and objectively verifiable, let alone justifiable.
Polite request for info from any who really know.
Is land much more heterogenous than sea for rate of surface temperature change?
I can imagine errors from drift of sampled areas/volumes over sea being less than over land.
Is this difference real? If so, can it be used to help refine the error analysis?
(It might already be. I simply do not know.)
It it correct that the total temperature stays immune from these areas, but only the distribution of values is changed by the error?
Geoff
My experience is that Tmax minus Tmin is much higher when you measure inland compared to when you measure in or at sea i.e. in a coastal town.
Whatever your sample is, I think you must make sure that your sample represents a fair distribution 70/ 30 at sea/ inland.
Again, looking at the maps in the OP, this all supports the fact that “Global Warming” is a non-existent entity. Most all of the warming is driven by only one region, the North above 60N. Everything else looks pretty normal and well within normal ranges, even cooling in may places. …. ie., there is no “Global Climate Change” ….. and as I noted earlier … warming temps in the arctic circle have no impact on the pine trees in Georgia, or the jungles in the tropics, outside of a bit more rain, which I’m sure the trees won’t object.
OH … and the added CO2 appears to be a nice lagniappe as well ….. the trees aren’t objecting.
lagniappe…My new word for the day!
Thanks!
Dr Dean..,
The plots below confirm your comment, most of the warming is in the Arctic where it is difficult to measure.
It’s Arctic warming, not global warming and the rate has decreased.
http://fs5.directupload.net/images/170304/2x7bkgok.jpg
Another interesting data plot showing how warming is mostly in the North Latitudes.

So, the warmistas were correct after all…we are going to experience the horrifying catastrophe of a vast polar wasteland that is becoming slightly less frigidly frozen to quickly fatal temperatures!
Catcracking
See my comment above. The Arctic temp numbers are extrapolations – generated from station data hundreds or even thousands of miles from the purported data point. These extrapolations run hot – just like all climate models. GIGO at work.
Instead, satellite, aerial surveillance and “boots on the ground” reports [e.g. icebreakers] confirm several years of multi-year ice. That type of ice cannot build up unless temps remain low enough for first and second year ice not to melt.
What happened to Dr John Gates claims?
https://wattsupwiththat.com/2017/02/04/bombshell-noaa-whistleblower-says-karl-et-al-pausebuster-paper-was-hyped-broke-procedures/
It’s a crying shame NOAA won’t release the -1M temperature data that’s been collected for the past 30 years… Six marginally distributed sensors placed 1 meter below the surface gives the rate of change and direction over lengthy periods (such as decadal). Peak sea surface temperatures, hence land temperatures peaked in 2001 and are trending downward… Any discussion of this being the everlasting inter-glacial period, are quite bizarre.