Guest Post by Willis Eschenbach [see Update at the end]
I thought I might write about how I research a subject. Over at Dr. Judith’s excellent website, she periodically puts out a list of interesting papers that she has come across. This time it was “Week In Review: Water Edition”. She gave a link to an article from a Tampa Bay news station headlined Study: Sea level rise may severely impact Tampa by 2040.
Why did I pick this article? To me it’s obviously bogus. Sea level is rising around the world at something like 8-12 inches (200 – 300 mm) per century. It’s only twenty-four years until 2040, call it a quarter century. So by then Tampa will likely see on the order of 2 – 3 inches of sea level rise. That will not have a “severe impact” anywhere. So I went off to read the article.
Reading the article, I said “Well, there’s yer problem”, viz:
The study was based on sea level rise predictions from the National Oceanic and Atmospheric Administration and the findings of the Tampa Bay Climate Science Advisory Board.
The advisory board concluded that the region could experience sea level rise between a half-foot to 2.5 feet of sea level rise by 2050.
Two and a half feet of sea level rise over the next thirty-four years, a third of a century?? That doesn’t pass the laugh test. Consider that to do that we’d have to AVERAGE a sea level rise of seven and a half feet per century. So I set off to unearth the “findings of the Tampa Bay Climate Science Advisory Board”.
From there the trail got murkier. But after several false starts, I came across a Tampa Bay City Council Agenda that referred in passing to the report by the Advisory Board. With that I was able to track it down. It is called “Recommended Projection of Sea Level Rise in the Tampa Bay Region“.
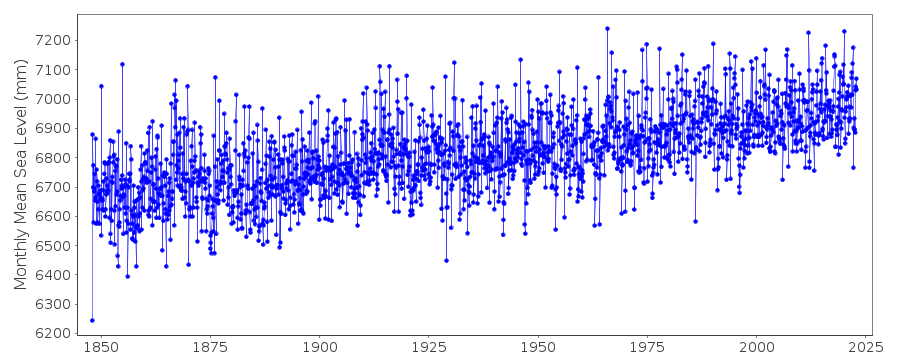
The report starts out reasonably, showing the longest local historical sea level record, from the adjacent city of St. Petersburg.

Regarding this chart they say:
Data measured at the St. Petersburg tide station shows that water levels in Tampa Bay have increased approximately 6.6 inches or approximately 1 inch/decade (see Figure 2).
That’s all quite reasonable, and at ten inches (250 mm) per century the rise is right in the general world range I gave above. So I continue reading and find this:
The final parameter, projections of how much sea level will change globally over the next 100 years, is derived from experts engaged in climate science.
Uh-oh, sez I. We are now in the hands of “experts engaged in climate science”, so hide the good silver and watch your wallets … I continue reading …
The 2012 National Oceanic and Atmospheric Administration (NOAA) Technical Report, Global Sea Level Rise Scenarios for the United States National Climate Assessment, was produced as a coordinated, interagency effort to identify nationally agreed upon estimates for global SLR. The report synthesized the scientific literature on global SLR, included input from national experts in climate science, physical coastal processes and coastal management, and produced a set of four plausible SLR scenarios that can easily be adjusted for regional conditions throughout the United States.
Plausible? Er … um … I continue reading …
Future SLR estimates can be calculated for the Tampa Bay region, integrating data from the local St. Petersburg tide gauge, using a flexible, well-supported tool developed by the United States Army Corps of Engineers (USACE). The tool takes the three parameters discussed above (datum, rate of change, projection) and produces the plots or tables that describe how sea level will change in the future, such as those included as Figure 3 and Table 1.
Here is their Figure 3, in all its glory:

Now, this is good, because it starts in 1992. This means we are already almost a quarter century into this graph, so we can see how well the various projections are doing in 2016. Now, the “NOAA Low” estimate (bottom line, dotted blue) is simply an extension of the historical rate.
To look at the others, I took their Table 1 showing their projections, hand-typed it into Excel (because it’s a graphic and not text and numbers, bad scientists, no cookies), and used the Excel Solver tool to determine the equations of those lines. This lets me calculate the annual sea level rise for each of the four scenarios. Remember, the lowest one called “NOAA Low” is the observed rate extended out to 2100. In the figure below we can see the observed rate of sea level rise (2.6 mm/year) compared to the three NOAA projections for the year 2016.

How are they doing? Let’s start from the “NOAA High” projection. NOAA was definitely high for this one. It’s more than four times the current rate. I’d throw that model in the trash. After a quarter century it’s rising at more than four times the observed rate. Sorry, not valid.
Same thing for the “NOAA Int High”. After a quarter century that sucker is almost three times actual observations. Into the trash with that one as well.
Finally, the NOAA Int Low … well, it is about fifty percent higher than observed. I suppose that is in a feasible range … or so it would seem until we look at where the rates of sea level rise are projected to be by the year 2100.

The fastest sea level rise in the paleo record is from about 16000 to 8000 years before present, at the end of the last ice age glacial period. The rapid rise was from the melting of the ice that was a mile thick where Chicago sits today. As that incredible mass of ice in the temperate zones melted, sea level rose about 110 metres. That is a sustained rate of rise of about 14 mm/year. That rate has not been seen for the last 8000 years, and for a good reason—there is no mile of ice over Chicago to melt. Despite that, NOAA predicts that we may well see twice that rate of rise by the end of the century?? Like I said … that doesn’t pass the laugh test. Even their lowest estimate (NOAA Int Low) is more than half the historical record post-glacial rate … not believable.
Finally, look at the St. Petersburg sea level dataset, or any Florida sea level dataset. None of them show any significant acceleration, despite covering the period of recent warming. Warming but no acceleration of sea level rise … oops.
These alarmist claims of accelerating sea level rise have been being made since about 1988, when Jim Hansen conned the US Senate into buying into his hysteria. Despite the claims, there is no sign of said acceleration in the Florida sea level data.
Now, could it happen? Could sea level rise start to accelerate?
Sure, it’s possible … but until you see it, it is just a James Hansen fantasy.
These NOAA claims of wildly accelerating rates of sea level rise are not science in any form. They are government sponsored hysteria, and whoever did this at NOAA should resign.
Unfortunately, the costs of this rampant alarmism will be huge, as coastal communities will struggle to comply with a meaninglessly exaggerated risk.
The only good news is that sea level pays no attention to what NOAA and the rest of the activist-ridden government and non-government organizations say … and sooner or later, this will become too evident for even the most ardent climate activist to ignore.
My best wishes to everyone,
w.
PS—If you are commenting please QUOTE THE EXACT WORDS YOU ARE REFERRING TO, so that everyone can understand your subject.
UPDATE: As usual, commenters provide pure gold.
Larry Hamlin January 15, 2017 at 11:18 am says:
The Tampa Bay study is question relies upon a “tool” developed by the USACE as noted in the quote in the subject article provided below.
“Future SLR estimates can be calculated for the Tampa Bay region, integrating data from the local St. Petersburg tide gauge, using a flexible, well-supported tool developed by the United States Army Corps of Engineers (USACE). The tool takes the three parameters discussed above (datum, rate of change, projection) and produces the plots or tables that describe how sea level will change in the future, such as those included as Figure 3 and Table 1.”
The USACE model methodology can be found at: http://www.corpsclimate.us/ccaceslcurves.cfm.
This USACE tool is in fact a semi-emprical methodology model of the type whose significant shortcomings was addressed in the UN IPCC AR5 report which specifically noted:
“Many semi-empirical model projections of global mean sea level rise are higher than process-based model projections (up to about twice as large), but there is no consensus in the scientific community about their reliability and there is thus low confidence in their projections. {13.5}”
“Despite the successful calibration and evaluation of semi-empirical models against the observed 20th century sea level record, there is no consensus in the scientific community about their reliability, and consequently low confidence in projections based on them. {13.5.2, 13.5.3, Figure 13.12}”
“Because of the limited or medium evidence supporting SEMs, and the low agreement about their reliability, we have low confidence in their projections.” (Section 13.5.3)
Thus the Tampa Bay study addressed in this post relies upon highly speculative methodology which was specifically cautioned against in the UN IPCC AR5 report as providing results which the IPCC have “low confidence in their projections.”
The only areas that need to be concerned about rising sea levels are those where the silly local council allowed residential homes be built on land already a sea level 30 yrs ago…..I thought one of those was actuallyTampa, Florida.
Spot on, Willis – and you didn’t even mention that if you had chosen to “cherry-pick” from your first graph (St. Petersburg 1947 – 2015) you could have pointed out several decades with no change in sea-levels, e.g. (circa) 1947-57. 1957-67, 1985-97. Fact is : our projection (or prediction) about the weather over the next decade or decades is pure guesswork. I reckon it will be at least 100 years before we have gathered enough observations to present even educated guesses about that.
“Unfortunately, the costs of this rampant alarmism will be huge, as coastal communities will struggle to comply with a meaninglessly exaggerated risk.”
Back in 1990, I was the lead designer for a major USACE flood control project – The Chehalis River at South Aberdeen and Cosmopolis. The PM and I arrived at the conclusion that the tide gage records for the region had more veracity than Al Gore’s premonitions about sea level rise. The project features were designed to protect the community from the 200 year flood plus one foot for a century worth of sea level rise.
The project was constructed in 1995-6 and has successfully protected the cities without adding height to the levees and flood walls.
(Thus began my demise as a Civil Coastal Engineer/global warming denier… I was then transferred to Construction Division working at McChord AFB where my heresy would be irrelevant.)
The Aberdeen project was completed for less than half of the congressionally authorized cost of $28.2 million. If designers reject the fraud that is global warming and sea level rise, coastal communities need not “struggle to comply with a meaninglessly exaggerated risk”.
I am not aware of any major coastal engineering construction project that will accomodate sea level rise exceeding the historic observed trend. In fact, in my home town of Seattle, they are currently rebuilding the seawall and it is the same height as the original 1930-era seawall.
The emperor has no clothes!
The ice over Buffalo, Chicago, Seattle, and many other low elevation and low latitude places has already been melted. Warm rain does a good deal of erosion of ice. Let’s call that the easy ice to melt. While the “easy ice” was melting the ocean rose rapidly.
When only not-so-easy ice was left the rate of sea level rise slowed.
Expect this sort of thing to continue. Sea level rise should slow.
Until a miracle happens!
While looking for that “Post-Glacial Sea Level Rise” chart, I came to this site:
Holy Cow!
The first chart therein is the one I was looking for.
However, scroll down to the map: “Cities Below Future Seas”
There is a set of years under the heading “Lock-in Year”
Put the pointer over 2012 and look at the bar on the right side, near FL & GA. This is the “cannot avoid” or “committed” sea level rise based on “climate pollution” now in progress.
For 2012 that unavoidable rise is 4 ft. 3 in. – but it doesn’t say when.
Note the States shaded on the map and, also, the Threatened Cities sliding bar.
Move the pointer over the years and watch the changes.
Why an entire state changes colors baffles me. Holy Cow!
Has anyone determined with any accuracy how much sea beds have sunk since the ice sheets melted? Much of the weight that depressed the continental crust is now bearing on the oceanic crust. It’s distributed over a much larger area, but that area has a much thinner crust.
And how exactly could the entire oceanic crust of the Earth be depressed?
Either the entire planet would have to compress, or the continents would have to rise.
Let’s have a look at what the sea level is doing out in the middle of the largest plate of oceanic crust on Earth, the Pacific plate, eh?
In the center of the plate are lots of seamounts, and on top of these are lots of coral atolls. If the crust was sinking into the mantle, these seamounts would all be sinking along with it.
Looking at these places would also seem to remove a lot of the uncertainty of continent based tide gages which may be affected by subsidence from ground water extraction and other causes mentioned above, no?
So it may be that the central Pacific is where we might look to see what the world ocean is really doing.
Kiribati:
https://tidesandcurrents.noaa.gov/sltrends/sltrends_global_station.htm?stnid=750-012
Thanks for the reply.
It isn’t necessary for the entire oceanic crust to depress in order to accept more water volume. The deeper the water and thinner the crust, the more compression. Obviously, where volcanoes rise in the mid-Pacific is where mantle is being pushed out. There are estimates of crustal thickness over land, but I can’t find any under oceans. Surely plate malleability is not uniform.*
It does not follow that entire continents would have to rise. Continental crust east of the Cascadia subduction zone and the Aleutian Trench is rising (sea level change at Skagway -17.59mm/yr).
Does the mid-Atlantic ridge expand faster when sea level is high?
Consider also that as volcanic activity adds mass to the edge of continental plates surrounding oceanic subduction zones, that mass applies more downward pressure on the plate that is subducting,
As Spielgel Online reported in 2012**, some South Pacific Islands are sinking. But it is due to subduction, NOT to rising sea level as claimed by the UN when they declared islanders “climate refugees.”
* http://news.rice.edu/2014/08/27/pacific-plate-shrinking-as-it-cools/
** http://www.spiegel.de/international/world/south-pacific-islands-threatened-by-more-than-just-rising-sea-levels-a-838675.html
The mechanical incompressibility of rock is notable, even if the rock is in a semi-molten state.
I do not think a few hundred feet of water can decrease the diameter of the earth. And if the diameter is not decreased, then any downward movement in one place must be matched by an upward movement somewhere else of equal volume. So the net change from the weight of the water would have to be zero, absent an actual increase in the density of the material below.
BTW, the thickness of oceanic crust is generally considered to be about 10km on average.
The Wikipedia entry on ocean crust may be a place to get some valid general info, as this is a noncontroversial subject.
It seems that there is no place where the ocean crust has been drilled through to get a complete cross sectional analysis.
https://books.google.com/books?id=WA9ST5S_2v0C&pg=PA44#v=onepage&q&f=false
A 6 inch to 2.5 feet sea level rise in that time frame should be called what it is, A Bald Faced LIE.
Philip January 14, 2017 at 11:07 pm
Philip, I beg to disagree. A lie implies an intent to deceive. We don’t know what is going on in the minds of the NOAA scientists.
The Paul Simon song says:
I suspect that some combination of that kind of deafness plus what is called “noble cause corruption” is more likely than deliberate lies. Noble cause corruption is insidious. It starts by just shading things a little, which is justified as being OK because they’re saving the world. And there is no more noble cause than saving the world.
From there noble cause corruption is joined by confirmation bias, which is when someone does not test or question things that fit with their beliefs. And in short order, there people are, blithely predicting a huge, never seen rate of sea level rise, and convinced that they are doing noble, even holy work.
But that’s just my guess, and it’s no better than your guess that it is a deliberate lie. My own rule is, I try to avoid ascribing motives to other people’s actions. I do this for a simple reason—I’m often not aware of my own motives until after the fact, sometimes years after, and some motives I’m sure I’ll never be aware of.
So how well would I do figuring someone else’s motives?
In addition, I do my best to avoid calling someone a liar unless I have hard and demonstrable information that they knew what they were saying was untrue. Not always successful, I’ve been known to intemperately wax wroth (to my own cost), but that is indeed my aim.
Best to you,
w.
Willis E, I wholeheartedly agree with you. The rhetoric in the climate wars has been ratcheted up to an alarming degree. Calling someone a liar, in the old days, would land you in a duel. Now it’s commonplace and certainly shouldn’t be.
Willis: “We don’t know what is going on in the minds of the NOAA scientists.”


I tried to replicate the thoughts. I downloaded the data http://www.psmsl.org/data/obtaining/stations/520.php and calculated a 22a Loess smooth:
Then I calculted the annual deltas ( The change of Sealevel) of the smoothed data:
and extrapolated the rise of the last 10 years (red).
After integration the SLH looks like this:
and voila: 1m SLR to 2100!
best
That is a fantastic analysis! Fun with statistics and graphs! And, of course, the “researcher” sees nothing wrong with torturing the data until he gets the answer he wants.
rxc: That’s just what they have done essentially. They extrapolated a SLR and integrated it for the forecast. More or less meaningless, anyway: they got it reviewed! This is the real problem IMO!
In the early 18 hundreds the British navy was tasked with world wide exploration and scientific studies.
Around the coast line of Australia from the bottom to the top they found protruding rocks at low tide and carved a low tide line on them and the date. Those rocks still show the same level at low tide, the navy called them dry rocks. Seems that Australia has had very little in the way of ocean rise, must be only the northern oceans that are getting deeper.
There is photographic evidence from lots of sources and lots of places that show little if any noticeable sea level rise in the past hundred years.
I suspect that the tide gage data has been adjusted.
I have a collection of photos from locations all around South Florida, like Lummus Park in South Beach, Brickell Key, Fort Lauderdale, and Key Biscayne, to Cape May in New Jersey, to La Jolla in California, in which it is impossible to see any difference at all in the location of the ocean in pics from 100 years ago to the same place today.
Distinctive landmarks, rock formations, streets, homes…all are in the same place in relation to the ocean as they were many decades ago.
Brickell Key, for example, was a pile of sand in Biscayne Bay that was deposited as a spoils pile when Henry Flagler dredged the Miami river in 1896. It is still right where it was, but in the past few decades it has been the site of some very expensive development now that sand pile holds billions in newly built real estate.
Brickell Key, then (1928) and now:
http://miami-history.com/wp-content/uploads/2013/01/1928_Aerial_Miami_Downtown-300×240.jpg
http://ralphmagin.piggybackblogs.com/files/2013/07/BK3.jpg
Lummus Park:
http://the305.com/blog/wp-content/uploads/2013/12/normal_lummus_park.jpg
http://i.ebayimg.com/images/i/360610288257-0-1/s-l1000.jpg
http://www.playle.com/KDL/56475.jpg
http://oliom.com/blog/wp-content/uploads/2014/11/Lummus-Park-Miami-Beach.png
BTW, look at the cars.
I suspect the only difference in the next hundred years will be that the cars will be Jetsonmobiles by then.
Closer to the location of this article…the Don Cesar hotel, built on St. Pete Beach in the 1920s and still about as far from the Gulf as it was then…in fact, it looks further away and higher now!
Special place for me…I spent a week there just before I started my first classes at USF back in 1982.
Check it out:
http://loewsmagazine.com/wp-content/uploads/2014/04/pr08361-edit.jpg
http://i2.cdn.turner.com/cnnnext/dam/assets/151006122340-loews-don-cesar-super-169.jpg
Menicholas: Beaches are not permanent features of the coast. Have you ever heard of beach sand replenishment? The width of beaches in rich communities is mostly under the control of man, not sea level rise. Elsewhere, the width and location of beaches is constantly changing with local currents and weather. Unfortunately, these pictures are meaningless.
The critical feature is how far the ground floor of the pink hotel is above mean high tide. They can add as much sand as they want to the beach (10 feet if necessary), but no higher than the ground floor. The hotel could end up totally surrounded by water and still have a beach this wide.
http://www.miamidade.gov/environment/beach-renourishment.asp
http://www.pinellascounty.org/environment/coastalMngmt/nourishment.htm
Of course, beaches can be flat or steep.
But it can be seen from these photos that back in the 1920s the beach was not steep.
The ground floor of the hotel was not very high above the sea.
And tides on the Gulf in this area are slight, less than two feet ordinarily.
They may be meaningless to you, but they show what they show.
Maybe we are supposed to think that the oceans will sneak up on us, just like the roasting hot temperatures that will cook us…it will seem like nothing is happening, but then, suddenly, it will be like Sir Lancelot storming the castle in PMatHG:
https://youtu.be/GJoM7V54T-c?t=42s
Evidence of adjustments to sea level trends?
Steve Case is on the case, Menicholas.
The individual tide gauge measurement records are very linear, and average at most about +1.5 mm/yr sea-level rise. But the satellite altimetry is another matter entirely, and some of the composite “averages” are badly muddled up with adjustments, fudge factors & the use of gauges with inappropriately short measurement records. Here’s a quote from what is probably the most famous sea-level paper of all:
But I think the situation with temperatures is much worse. Dr. Kevin Cowtan made a video arguing that the adjustments were insignificant, but in that video he briefly showed a graph which I screen-cap’d and digitized. It showed that adjustments in NASA GISS numbers increased the global terrestrial warming trend by 35%.
Thank you for the reply, Dave.
I don’t think “task” was a verb in the 1800’s. But as somebody said, nowadays, any noun can be verbed.
+1’d!
Thanks Willis. More horseshit exposed. Good work.
One among the oldest tide gauges in the world is that of the Brest harbour in France of which records began by 1845 continuously (except when it was destroyed during WWII) until now.
http://www.sonel.org/spip.php?page=maregraphe&idStation=1736.php
The level rise was 25cm in 162 years, about 1,6mm/yr. No accelerating trend is perceptible.
Regarding the remote Pacific Islands like the Solomons or the Kiribati where the Greens are focusing the media’s attention about the situation of the so called “climatic refugees”, the site of the Bureau of Meteorology of Australia has a lot of good records since 1992 but one cannot notice any dramatic rise, and the trend is flat elsewhere.
The New Zealand denied the Kiribati inhabitants the status of climatic refugees since the sea level rise has been proven it was due to downwards tectonic moves.
Am I right in thinking that, in the US, it is the Army engineers who are responsible for building sea defences? If so, is this prediction partly based on USACE looking for increased funding?
All parts of the National Government (and most States, also) have been directed to plan for global warming (or climate change). Because all must do this it doesn’t seem to me there is much advantage to any of them.
“Sea defenses” are not common projects in the US. River levies and related structures for flood control have been, and continue to be problematic. See the wiki entry for Atchafalaya River, and therein see ; Old River Control Structure.
One major sea defense was the Galveston Seawall — wiki has an entry on that.
Great piece of work Menicholas – they say a picture is worth a thousand words which is often not true but in this case makes a god point. As photography goes back to the 1840s it would be interesting to compile an archive of “non-adjusted” sea level photography. Before green activists dig out as much evidence of minimal rise as possible. (And yes we all know assessing sea levels is very very complicated).
Tampa Bay is not the only part of Florida that is blighted by bogus prophesies of accelerating sea level rise. Last year the Miami-Dade Climate Change Advisory Task Force published their report, using similar projections. Their sea level graph is below. ?w=900
I did some quick calculations to show the impact of the acceleration in the rate of sea level rise that these projections imply.
The “Miami-Dade Climate Change Advisory Task Force” used figures for Key West Florida. Given that it is not too far from St. Petersburg, the rate of sea level rise is about the same, along with a lack of acceleration in the rate of rise. ?w=900
The NOAA US sea level charts is easily accessed at the link below, along with the supporting data.
https://tidesandcurrents.noaa.gov/sltrends/sltrends_us.htm
It does appear that the increases have been more stepped than linear, if this data can be trusted at all.
Notice the peak reached in the late 1940s, was briefly topped only for a few years in the early 1970s, and then not until the late 1980s.
Even after that, it was not until after the year 2000 that the trend line crossed this 1940s peak, and there have been several years in the past decade that were under the 1049s peak.
That is one slow trend, with the year to year variability as great as nearly a century of the overall trend.
If the numbers can even be trusted.
Considering the shenanigans we know are being perpetrated by NOAA with regard to other data, and taking into account graphs that were published in the 1980s showing no such smooth and steady trend, I think it is prudent to be skeptical of anything they offer.
Acceleration of sea level rise, acceleration of global temperature increase, acceleration of glacier mass loss … all these and more result from spurious “positive feedbacks,” and unknown or willfully ignored damping mechanisms.
Small deceleration of sea level rise was reported in 2011-
HOUSTON, J.R. and DEAN, R.G., 2011. Sea-level acceleration based on U.S. tide gauges and extensions of previous global-gauge analyses. Journal of Coastal Research, 27(3), 409–417. West Palm Beach (Florida), ISSN 0749-0208.
From the abstract-
“To determine this acceleration, we analyze monthly-averaged records for 57 U.S. tide gauges in the Permanent Service for Mean Sea Level (PSMSL) data base that have lengths of 60–156 years. Least-squares quadratic analysis of each of the 57 records are performed to quantify accelerations, and 25 gauge records having data spanning from 1930 to 2010 are analyzed. In both cases we obtain small average sea-level decelerations. To compare these results with worldwide data, we extend the analysis of Douglas (1992) by an additional 25 years and analyze revised data of Church and White (2006) from 1930 to 2007 and also obtain small sea-level decelerations similar to those we obtain from U.S. gauge records.”
As usual, Willis, a great read.
As someone without advanced education in the field and who can only make inferences based on what little common sense I may possess, wouldn’t a rise in sea level require either a source of water (volume) or a rise in the sea floor? Whence either?
How much could sea levels rise if the polar ice were all to melt? How much heat would be required to melt them? At what rate is it plausible for such heat to be applied?
How much would the oceans have to warm to cause a detectible increase in sea levels through expansion? Again, where would the heat originate?
How fast is it possible for the depth of the oceans to decrease? Is a rise in the sea floor somewhere necessarily offset by a sinking of the sea floor elsewhere? Why would the sea floors rise and not the continents? Would that be the same as the continents sinking? Is there any evidence this is happening now?
I haven’t the knowledge in physics or geology to be able to even know if these are the right questions to ask in evaluating whether a sudden increase in sea level rise is possible — I would be humbly grateful if someone on this site who is smarter than I am (which doesn’t necessarily narrow the field much) would spend a few minutes enlightening me and perhaps one or two others.
Thanks!
Ron,
There is a search box on the right side and down just a little from the top.
Put ‘sea level rise’ in the box, hit Enter and there are lots of things to read.
Many people reading here at WUWT have looked at many (most) of these over the last 8 years and are not likely to review them, for 3 reasons.
There is new stuff to read.
We don’t consider that rising ocean levels will be a problem — that being the point of this Willis post.
You are quite capable of doing the reading.
Thanks, John!
There is something called the closure problem. To a first order approximation, SLR should equal the sum of thermosteric rise plus ice mass loss from Greenland and Antarctica. (Remainingnuncertainties include flobal GIA ~0.3, groundwater extraction nypothesis (I think silly on then whole, see essay PseudoPrecision, and siltation of the seafloor (e.g. Rain of calcareous algal exoskeletons eventually forming limestone and chalk,) We know the former from ARGO from ~2005 on; prior estimates are problematic. We know the latter from GRACE and Icesat. It turns out the pre 2013 Antarctic ice mass loss estimates were biased high because of a faulty modeled GIA. When diff GPS actual measurements were plugged in 2013, GRACE says a small annual loss while IceSat (Zwally 2015) says essentially zero. There should be some loss due to ocean contact basal melting.. Net about 0.6mm/yr, which leaves ~Greenland at about 1,0mm/yr (Hansen 2012, but Geeenland varies by decade). . ARGO thermosteric rise is ~0.6-0.7 (papers very, this is their ‘average’, range 0.5-0.9). Ice sheet mass loss sums ~1.6. Papers vary more, but all the pre 2013 Antarctica stuff has to be reworked. Sum 2.2-2.3 foots nicely with Moerner’s diff Gps corrected long record PSMSL estimate from 2015 showing no acceleration. Might be high, but foots.
And shows the sat alt estimates are biased high by about 1mm/yr. They in no way close. Three papers highlighted in essay PseudoPrecision that ‘close’ by cherry picking time frames and estimates. They are mutually inconsistent, so not credible. Acceleration is manufactured (e.g. By CSIRO) by slicing too high sat alt onto tide gauges starting 1981.
I recall reading a report regarding the draining of the Aral sea and it’s effect on sea level, so there may also be surface water drawdowns contributing to any sea level rise. There may be other surface bodies of water that have diminished significantly, although there may also be increases in others. In fact, if one considers rivers which have been dammed to created reservoirs, that is one place where water has been sequestered over the past hundred years or so, although that may be a tiny amount compared to the oceans.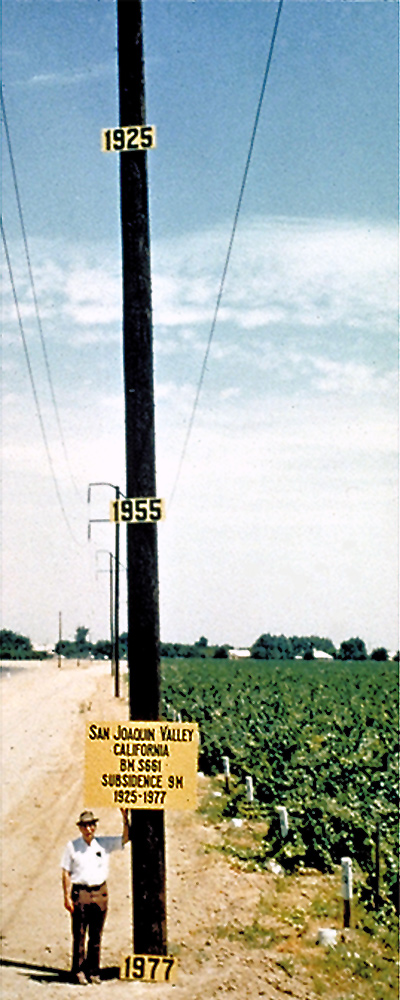
But certainly ground water removal, and not just near coastal zones, has been quite significant in lowering the ground levels on a widespread basis. Central California valley comes to mind.
Some dramatic photographic evidence exists:
http://3.bp.blogspot.com/-yzJ7ouoWWII/T41byHEPOeI/AAAAAAAAADo/EfK1AP3q6Qo/s1600/Aral+Sea.png
I realize that looking at photos may not be considered very scientific, but they can quickly give anyone who looks at them a quick idea of whether or not anything particularly dramatic is occurring. Regarding encroachment of oceans, it seems not, but regarding land subsidence and surface water changes,, it is undeniably occurring at dramatic scales in some places.
“There should be some loss due to ocean contact basal melting.”
That doesn’t affect sea level, of course, so the GRACE data will presumably (if correct) overstate the contribution of Antarctica ice loss to SLR, albeit maybe only slightly.
Did not the most recent studies show Antarctica gaining ice, rather than losing it”
https://wattsupwiththat.com/2015/11/05/yet-another-study-shows-antarctica-gaining-ice-mass-accumulation-highest-we-have-seen-in-the-last-300-years/
Yeah well we’re a really old weathered continent and we aint going anywhere in a hurry-
“One of the oldest tide gauge benchmarks in the world is at Port Arthur in south-east Tasmania. When combined with historical tide gauge data (found in the London and Australian archives) and recent sea level observations, it shows that relative sea level has risen by 13.5 cm from 1841 to 2000.”
OK so some of you might be sinking a wee bit like Venice-
“We have used a combination of historical tide-gauge data and satellite-altimeter data to estimate global averaged sea level change from 1880 to 2014. During this period, global-averaged sea level rose about 23 cm, with an average rate of rise of about 1.6 mm/yr over the 20th Century. The sea level record indicates a statistically significant increase in the rate of rise from 1880 to 2014.”
http://www.cmar.csiro.au/sealevel/sl_hist_few_hundred.html
Statistically significant doesn’t mean you start making things up, particularly when the old rocks around here show a sea level rise of 130M from 15000 years ago to around 6 or 7000 years ago and that can mean an average sea level rise of 16.25mm/yr for EIGHT THOUSAND YEARS but what’s a few mm between years.
Ummm…. you don’t think in that time there might have been the odd century when it was only 1.6mm a year and then another century when it was quite a bit more than 16.25mm a year do you?
Just an afterthought but perhaps Griff and Nick, et al could help a struggling layman out a bit here and consult their tree rings for some useful insights into that last puzzle for me?
There was indeed a period called Meltwater Pulse 1A where it did rise much more quickly than average, and then around 14 thousand ybp it levelled off for a while:
Thanks for that. I had a hunch that when you’re looking at some geological facts and figures with an average sea level rise of 16.25mm/yr over 8000 years or so, some decades it might have been only 16mm or so. No doubt the tree rings could sort this really technical stuff out.
I suspect that the Tampa Bay City Council is involved because of how low and close to the water things have been built along the Channelside district. It is a major destination area and a group of investors headed by Tampa Bay Lightning owner Jeff Vinik are putting up over $1 billion dollars in developing that area further. It would be in their best interests to have some kind of “science” to show SLR in order to grab some mitigation money to help along the way.
Every dang subject concerning ‘climate change’ shows evidence of climategate like manipulation.
The manipulation is required to create CAGW. Ocean level was rising at no more than 1.0 mm/yr and is now falling.
P.S. May the bells rings and the banners fly, global warming is over. I am now waiting with bated breath for the cult to notice and the start of the media/public/scientific paradigm change. There is now record snowfall and cold temperatures on the Greenland ice sheet which is evidence (Highest in RECORDED history!!!) of the start of the change in climate.
http://beta.dmi.dk/en/groenland/maalinger/greenland-ice-sheet-surface-mass-budget/
As has been known for more than a decade, the sum of the analyzed inputs that affect ocean level are less than what is required to justify even an ocean level rise of 1.2 mm/yr. The magical solution to this problem has a single paper by an IPCC lead author (What are the qualifications required to be selected to be a IPCC lead author?). The climategate study of course has paid for by European Research Council project Seachange blah, blah, blah, and so on.
This is a review paper that has published prior to magical EU financed paper that outlines the problem/paradox that the inputs that affect ocean level are not sufficient to justify a rise of even 1.0 mm/yr problem.
http://www.nature.com/nature/journal/v428/n6981/abs/nature02309.html
Ocean ‘Level’ from Satellite Data Before ‘Adjustments’ Cult of CAGW emergency, ocean level is falling!!!

Ocean ‘Level’ from Satellite Data After ‘Adjustments’ Cult of CAGW problem ‘SOLVED’ with innovative ‘adjustments’
http://scienceandpublicpolicy.org/images/stories/papers/reprint/sea_level_not_rising.pdf
William, thanks for the comment. I was with you until you got to this:
You can’t title a piece “Sea level is not rising” and start by saying “At most, global average sea level IS rising at a rate …”. Those two can’t both be true.
Next, with all respect to Professor Mörner, he is the only scientist I know of who claims that sea level “probably” is not rising at all. Nor does that claim accord with my own researches into the subject. Tide gauges from all over the planet show generally increasing sea levels. There’s an example here, one among plenty.
Next, the best GPS-corrected records show sea-level increases. In the nineties the Aussies put an entire series of them called “Seaframe” across the Pacific with co-located GPS. All of them show some degree of sea level rise over the last quarter century.
Finally, if you don’t think that sea level is rising at all, go talk to the Dutch. You won’t find Dutch scientists trying to push that kind of nonsense. Here’s the tidal record at Rotterdam:
My best to you,
w.
I have posted this before, but these cliff undercuts in the Mediterranean are at least 500 years old. And they are still on the current sea level (no tides in the Med).
http://s14.postimg.org/jci3z4z5t/undercut_med_cl.jpg
See the entry on wiki for ‘Cliffed coast’
The diagram there shows a “Wave-cut notch”
There is another drawing here: Formation of a Wave-cut Platform
A search using the “Images tab” using these terms will show many photos from around the world.
And as far as the satellite data goes, there was a thread on WUWT a while ago that pointed out that the Earth is a geoid, not a spheroid. And so the sea around Britain is 100 meters higher than the sea around Florida. So with a 100 meter variation is global sea surface levels, plus 6 meter tides, and 2 meter waves, can you really measure sea levels to the nearest millimeter? Tricky….
http://www.asu.cas.cz/~bezdek/vyzkum/rotating_3d_globe/rotating_3d_globe/private/fig06/rotating_3d_globe_preview_Geoid_height_EGM2008_nmax500_-20_-5_px0650.png
Click on this and watch it spin…
http://www.asu.cas.cz/~bezdek/vyzkum/rotating_3d_globe/figures/rotating_3d_globe_Geoid_height_EGM2008_nmax500_px0650_angle360_fps1_BlueWhiteOrangeRed.gif
And then there is this interesting and informative little video, worth a few minutes of anyone’s time:
https://youtu.be/q65O3qA0-n4
The NOAA high for 2016 is 4.3 inches per decade. You might think someone would notice that.
Excellent article Willis.
The UN IPCC AR5 WG1 report claims that:
“It is very likely that the mean rate of global averaged sea level rise was 1.7 [1.5 to 1.9] mm yr–1 between 1901 and 2010, 2.0 [1.7 to 2.3] mm yr–1 between 1971 and 2010, and 3.2 [2.8 to 3.6] mm yr–1 between 1993 and 2010. Tide-gauge and satellite altimeter data are consistent regarding the higher rate of the latter period. It is likely that similarly high rates occurred between 1920 and 1950.” (3)
As your discussion demonstrates the latest coastal sea level rise NOAA tide gauge data updated through 2015 for St. Petersburg simply does not support IPCC assertions that mean sea level rise trends are increasing since 1971.
Thus we have 45 years of NOAA coastal tide gauge data available to test the IPCC AR5 claims of increasing global sea level rise since 1971.
The actual NOAA measured coastal sea level rise data at St. Petersburg and elsewhere around the world says that the IPCC claim of increasing global sea level rise is flawed,
The studies discussed in this article regarding supposed future coastal sea level rise acceleration are nothing but speculation and conjecture derived from unvalidated and unproven models.
Isostasy/isostatic rebound…learned about this in Geology 101 my first semester in University–1966 at the University of Minnesota-Minneapolis. We were riding the rebound!
We really need to get the people who make these projections on the witness stand testifying under oath, under penalty of perjury.
They should certainly be concerned about the new leadership finding time to do this, which I suspect they probably will.