
Guest essay by Eric Worrall
Think Progress is crowing that “even deniers” confirm an average satellite measured temperature rise of 0.12c / decade. My response is – so what?
Sorry Deniers, Even Satellites Confirm Record Global Warming
The planet just had its hottest 12 months on record.
The people who deny the facts of climate science for a living have had a really tough time recently.
For years they had been dining off the “there’s been no warming since 1998” talking point. But that one was mortally wounded when 2014 became the hottest year on record — and then it died entirely when 2015 blew away the 2014 record. And now a stake is being driven through the heart of this vampire again and again as every month of 2016 has been totally crushing both the record for hottest month and the record for hottest 12 months on record.
…
You will no doubt be shocked, shocked to learn that the satellite data has, in fact, confirmed global warming for a long time. Indeed Dr. Roy Spencer and Dr. John Christy of the University of Alabama at Huntsville (UAH) reported earlier this year that the satellite data shows a “Global climate trend since Nov. 16, 1978 [of] +0.12 C [0.22F] per decade.” And Spencer and Christy are both leading deniers themselves!
…
And now that dataset has once again confirmed what multiple data streams have been reporting for a long time: there is a long-term warming trend, and it has been getting worse.
In truth, none of this is funny. The lies of the professional deniers get repeated by the politicians and right-wing media who oppose action — and all that helps slow our response to the greatest preventable threat to our health and well-being. That is a tragedy we must all fight against.
Read more: https://thinkprogress.org/satellites-confirm-global-warming-ce6d636c469f
What kind of catastrophe awaits this century, if the calamitous 0.12c / decade (0.21F / decade) rise continues? The answer is none whatsoever. 0.12c / decade is well within the range of natural variation.
During the Holocene Optimum, 9000 to 5000 years ago, global temperature was warmer than today. The Eemian, the previous interglacial, was warmer still – up to 8C (14F) warmer in arctic regions.
What is absent from historical records of the warmer past is evidence of “tipping points” or abrupt harmful changes driven by mild global warming. Even when Earth’s CO2 levels were four times higher than today, the climate was stable, and only 7F higher than today’s temperature.
Even if CO2 is contributing measurably to global warming, it is not driving change at a rate which will cause harm to the biosphere.
It is a measure of the desperation of climate advocates that they feel such a compulsion to leap on every slight temperature wobble, in the vain hope that ordinary people will listen to their doom laden rants.
yep, sorry. This just won’t do. The appeal to CoE constraints as somehow invalidating greenhouse theory is 100% wrong. Only if you accept the wrong premise is it worth going beyond the first para. Nick S has a handle on why.
And this is a skeptic talking.
Yes, in my opinion wrong assumptions about feedbacks are where it all falls down ( and the basic 1deg +/-0,2 deg due to CO2 greenhouse alone won’t frighten anybody at all, despite the pointless verbiage from evcricket and others at the top of the thread ) but this piece adds nothing to our understanding.
Sorry – somehow posted on the wrong thread. How did I do that?
Well, at least you got the “pointless verbiage from evcricket” part right. 🙂
More than once I’ve thought of a comment that I would like to make, after leaving an article. I then quickly click back in and post. Only to discover that in my haste I clicked into the wrong article.
“Sorry – somehow posted on the wrong thread. How did I do that?”
Well, if you are like me, you probably had more than one browser window open and picked the wrong window to use. 🙂
Addendum to last:
The “pause” was not used as evidence that warming had stopped forever. It was evidence that the models which showed continuous warming were inaccurate. If the pause ended after more than ten years it does not make the models accurate again.
Global average temperature peaks are caused by El Ninos. Where the El Nino rise and fall fits into a calendar year affects how warm that year will be compared relative to other El Ninos. So to find that the recent El Nino caused a higher global average temperature than say 1998 is not clear from the anomoly graphs. Who has the actual temperature graphs and data to show how El Ninos were phased within the calendar years? Until i see that it’s not clear to me.
February 2016 was one-tenth of a degree hotter than the hottest month in 1998. One-tenth. That’s what the alarmists are hanging their hat on.
Do you mean hottest or biggest anomoly? Two different measures in general.
Here in Ottawa, we’ve just passed through a period of 10C/month warming!
Now we will have 10C/month cooling.
Natural variation.
Given 0.12C per decade warming is below every IPCC alarm-fest report then this ‘news’ actually represents a significant reversal of the ‘scare’. Are the IPCC going to re-write their reports and projections? Is Romm going to be credited with undermining the entire alarm-fest? Does anyone care?
Romm was also silent on 18 years of the pause but magically finds his voice again after a year or so of el Nino. Imagine that – a natural event propping up mann-made theory. The whole AGW circus really does stink to high heaven.
If climate stayed the same I’d be shocked, shocked. Hardly fair on the Egyptian Old Kingdom, the Hittites, the Mesopotamians, the Ming etc if they copped civilisation/dynasty-fatal climate change and we got to cruise forever on a flat line.
Mind you, a lot of that “civilisation/dynasty-fatal climate change” consisted of cooling + drought. But that would really spoil the narrative, wouldn’t it? Some people would really be shocked, shocked if forced to confront natural and human history as they were widely accepted not too many years ago. Or were Hubert Lamb and all the rest just making it up?
The words straws and clutching at spring to mind with their reaction to a slight, mild and beneficial warming that is way below what we were promised because of our sins of emission.
James Bull
Think Progress is just regurgitating the same nonsense as Seth Borenstein.
The Warmunists are like roaches, for every one you stomp, two more seem to pop up.
Which has killed more people, the melting of Arctic ice, the Antarctic ozone hole, or an average satellite measured temperature rise of 0.12c / decade.
That works out to 0.012 C per year. That’s the wind chill on my upper lip when I snort derisively at any fool who expects to achieve stasis in any complex and incompletely understood natural system by.
There’s a difference between global average and temperatures just outside your front door…
Global average is a made up number.
The difference is that the one outside your front door is more accurate.
Bet you wouldn’t bet your house, Griff, on the global average of lottery numbers. It’s just as meaningful as GAT. Unfortunately, GAT will cost us all dearly; you losing your house to the lottery would be acceptable.
Who said anything about the temperature outside his front door?
BTW, if there is a difference global average and the temperature at any particular spot, why does your team keep hyping every heat wave?
The methodology uses January – December to define a year. However it would seem that this definition is arbitrary. Why not go March – February or July- June?
What is interesting is that if we examine the series Monthly “average of previous 12 months” we see a slightly different picture. If we sort this series by highest to lowest anomaly, we find in the top 24 months all of the 1998-1999 El Nino months, whereas we only find 5 months from 2016. (the rest of the months are from 2010.
Breaking news……..
Maldives seems to be sinking under billions of ‘ criminal laundered cash’
I’m all for shorter winters.
Of course if you count 1945-2015 you have to cut the 0.12C to 0.06C. You see co2 didn’t start appearing in 1978. From 1945-1978 as everyone knows the temp of the earth DECLINED. so the change may be less than 0.06C/decade depending on if you believe adjustments. The adjustments wipe out the decline and produce a nice smooth upward Trend since 1900 or so contrary to the reported facts of the day. In fact even with adjustments the Arctic was warmer in the 40s than today. We had dust bowls in the american west.
The point is looking at a rise since 1978 and saying wow isn’t that amazing temps have gone up for 30 years and not realizing that during massive co2 production post WWII there was a drop in temperatures for 30+ years.
We didn’t have satellites in 1945 to confirm the temperature record and see if temps then we’re actually as warm or warmer than today. All we have are adjusted records of NASA to tell us yeah today is way hotter than the dust bowl Arctic ice free 1940s. Oh wait even they can’t deny that the Arctic was warmer then than today.
The fact temperatures go down for 30 years or stay stable for 20 years here and then means any assumption that 0.12C is the rate we will see for the next 85 years is stupid.
Obama said Americans are lazy because we do little about global warming. The reason we are so callous about global warming is that we don’t see the reason to spend trillions on a nonexistent problem. Tell us what exactly is the bad thing that will happen even if we get another degree. Not vague the world will collapse. Exactly what is going to happen that we need to worry about? You got nothing. So what the temps are a little bigger. That’s a good thing. I think many of us warmists would be happy to do something if there was a reason. They just make vague accusations of horrible things. Nobody has time for their unsubstantiated fear mongering. We’ve got too many real problems to worry about .3C warmer temperatures worldwide in 2100.
“Of course if you count 1945-2015 you have to cut the 0.12C to 0.06C. You see co2 didn’t start appearing in 1978. From 1945-1978 as everyone knows the temp of the earth DECLINED. so the change may be less than 0.06C/decade depending on if you believe adjustments.”
Very good point.
I for one am unconvinced that there has been any warming since the 1940s when one takes account the error in measurement, and the impact of UHI and station drop outs.
May be there has been a little warming since the 1940s but if so, it has probably been modest perhaps in the region of about 0.2 degC.
One should bear in mind the following:
1. The US data suggests cooling since the 1930s/40s.
2. We have hard contemporaneous historical evidence of the dust bowl conditions which whilst not quantitative describe and show conditions which we are not experiencing today.
3. Greenland temperatures suggest that it is cooler today in Greenland than it was in the 1940s. Again there is historical evidence backing this up.
4. The tree ring data that Mann had to disregard and not use in his famous nature trick does not suggest significant warming post 1940s.
All in all, if one considers how much warming (if any at all) that there has been post 1940, some or all of which is no doubt of natural origin, it does not suggest that there is any significant CO2 led warming.
Indeed, Phil Jones of CRU stated that there was no statistically significant difference in the rate of warming of the late 20th century warming (1975 to 1998) and that of the two earlier warming episodes of 1860 to 1880, and 1910 to 1940.
See generally: http://news.bbc.co.uk/2/hi/science/nature/8511670.stm
I lack the time to answer here, but what exactly do you mean with this strange claim?
Of course if you count 1945-2015 you have to cut the 0.12C to 0.06C.
According to a scientific trend computer
http://www.ysbl.york.ac.uk/~cowtan/applets/trend/trend.html
the linear OLS GISS trend for that period was: 0.129 ±0.017 °C/decade (2σ)
and that of HadCRUT4 was: 0.104 ±0.018 °C/decade (2σ).
Even WFT tells about 0.85 °C / decade:
http://www.woodfortrees.org/graph/gistemp/from:1945/to:2015/mean:60/plot/gistemp/from:1945/to:2015/trend
Between 1945 and 1978, the trend was flat:
0.018 ±0.046 °C/decade (2σ)
Some meaningful and credible explanations? I stay tuned!
Were you around in the mid-late 70s? If so, surely you remember the global cooling/coming ice age scare. Why the scare? Well, apart from glacier advance and growing arctic ice, ‘global temps’ – we were told – were on a 30-year decline. By as much as 0.5C.. . . Now where did that go?
I described it this way once:
I am not predisposed to reject global warming or climate change out of hand. I really only have three problems with it, and if those three problems are resolved I will happily jump on board the CO2 train
1) I don’t believe the underlying data. It sure does seem like the records are being systematically manipulated because the past keeps getting colder
2) I don’t believe the models. I have worked on some models and I know the difficulty of getting even a simple system with known components that behave in a measured fashion properly modeled. I find the claim that the entire earth can be modeled to be incredulous.
3) I don’t believe that the outcome of a few C warming is that big a deal. The warming we are talking about is roughly the equivalent of moving from Boston to Philadelphia. In the scheme of things… shrug.
Clear up those three issues (data, model, and conclusion) and I am fully in. Until that point you are going to have a really hard time getting me to believe you or to care even if I did believe you.
Exactly. I started out being interested in finding out why the planet was warming so much according to these scientists. The way I look at it is that it’s either going to warm or cool. Which is better for mankind? The rate of warming is nothing alarming, and since the models don’t match reality that show that we probably can’t do a damn thing about it by controlling CO2 anyway. I’m sure they have more accurate models but they don’t show the desired output.
Let’s remember there were two large volcanoes in the beginning of the UAH record that makes the trend appear larger. Start low with two volcanoes and end high with the biggest super El Nino in 100 years and yeah, you have an upward trend.


If you adjust those out (and then the ENSO impact, and the AMO impact and the small Solar impact) and then see what warming you have left …).
It is only 0.038C per decade.
I’ve been running this natural variation model for almost 8 years now having first posted the idea on WUWT in 2008.
http://web.archive.org/web/20090626174702/http://wattsupwiththat.com/2008/11/25/adjusting-temperatures-for-the-enso-and-the-amo/
Well, it is still working well and here is a model of the monthly average of UAH, RSS and HadAT back to 1958 (and this monthly, none of that phony smoothing over 5 years or something).
The warming residual is only 0.038C per decade and one can see there is no pesky ENSO bumps and volcano dips and just a small steady rise (with a white noise error of about 0.2C which the climate seems to exhibit on a monthly basis),
Now when we extend those trends back to 1850 and go out to 2100, we see there is maybe another 0.4C of warming to come by 2100 (the error margin on your thermometer). In 85 years, you wouldn’t even be able to see this much change on your thermometer, electronic or the old mercury ones.)
Oh you can make it look much worse!
– First scale the vertical axis (1 K should be from bottom left to top right corner
– Smooth / dampen variation in measurements so that it appears there is a stable global temperature in the first place
– Use surface temps over land instead of some satellite, they are adjusted more efficiently.
– Fudge the projection to cover measurements
– Use Schmidt’s baseline technology: https://climateaudit.org/2016/05/05/schmidts-histogram-diagram-doesnt-refute-christy/
– Graft and cherry-pick.
Bill,
It looks like your lnCO2 function would yield a climate sensitivity of less than 1 C… Right in line with just about every observation-based estimate.
Right in line with exactly 1 observation-based estimate: Lindzen & Choi. Pretty much every other paper gives a median estiamte about 1ºC. In any case Bill’s ‘model’ is estimating TCR, not ECS.
Transient Climate Response is the sensitivity that matters to people.
How does the solar component work in your model Bill? It was not in the original article. Are you taking sunspots? What is the trend of the solar component and its effect on temperatures according to your model? Thank you.
Solar is the TSI from Kopp and Lean and then updated data from the SORCE TSI satellite. Technically, it is not statistically significant and is just a +/- 0.05C in the regression. I leave it in just to say it is in but there is no solar cycle imprint in any of the residuals I have tried. Its just not there.
I think the solar impact needs to be an accumulation over many decades. Slightly warmer Sun for 50 years, energy accumulates on Earth at 0.1 X 10^22 joules per year and it is 0.3C warmer. The physics and the math actually works at this level but not in the 1979 to 2016 period of stable solar.
‘Slightly warmer Sun’ is at most a difference of 0.1w/m2. That’s indeed about 0.15 x 10^22 joules (zettajoules).
If transient sensitivity (for every 3.7w/m2) is about 1ºC or less, then that that should raise temperatures by 1 / 37 = 0.027ºC. This heat does not ‘accumulate’ because as the Earth becomes warmer it also radiates more; what can happen is that heat initially stored in the ocean is released over decades, making ECS larger than TCR. But for TSI to have caused a warming of 0.3ºC over any recent period is impossible. (Of course there might be over solar effects but these are largely speculative).
The parenthesis should have said 1.5 zettajoules.
Alberto, I’m thinking of a “slightly warmer Sun” as in 3 or 4 W/m2 TSI. (then divide by 4 and multiply by 0.7 for Albedo and we have 0.7 W/m2/year of additional energy that Earth is/was/will be getting versus what it was getting when it reached its previous equilibrium temperature. That would be in the range of 0.4 X 10^22 joules per year additional after the solar ramp-up. That is roughly what the ocean and Earth is accumulating right now so it is certainly within the realm of what can actually happen. 40 or 50 years of that and the Earth is 0.3C warmer. The question is does the Sun actually vary by that much in long cycles. We used to think the Maunder Minimum TSI was 4 W/m2 lower but now most solar scientists would put that at only about 1 W/m2.
You are assuming that direct TSI is the only way that the sun impacts the climate.
There’s also changes in UV which affect the thickness of the ozone layer, with ozone being another greenhouse gas. Not to mention the Svensmark affect.
@Bill Illis
September 8, 2016 at 5:27 am: Thanks, Bill. Working as I do on a 62-3 yr cycle, I looked at 1957-8 as similar in the last cooling slope. My memoru of then, not far from here on the same coast of NZ, is of similar weather patterns. Boisterous as the cooling started to bite then too, perhaps. Those graphs may tell a story…
“Even Satellites”
Unreliable according to some prominent Warmers.
Next post.
Andrew
The value of 0.12 degrees C implies that global temperature measurements are accurate to within +/- 0.005 of a degree. I find this unbelievable.
We are talking about a trend, that can be defined highly accurately. The problem is rather measuring and verifying the *defined global temperature* at any similar accuracy. You can have a robust trend of numbers that are not so much meaningful. As someone expressed long time ago, the most common mistake is to believe a number has truth in it when it can be calculated at a high precision.
This is not to say there has been no warming; it is just that its meaning is smaller than some (very intelligent) people suggest.
That someone was A.N. Whitehead.
thx Roger!
This is the same warming that has been going on since the Little Ice Age ended – about 1870.
Actually, the warming started during the middle of the Little Ice Age…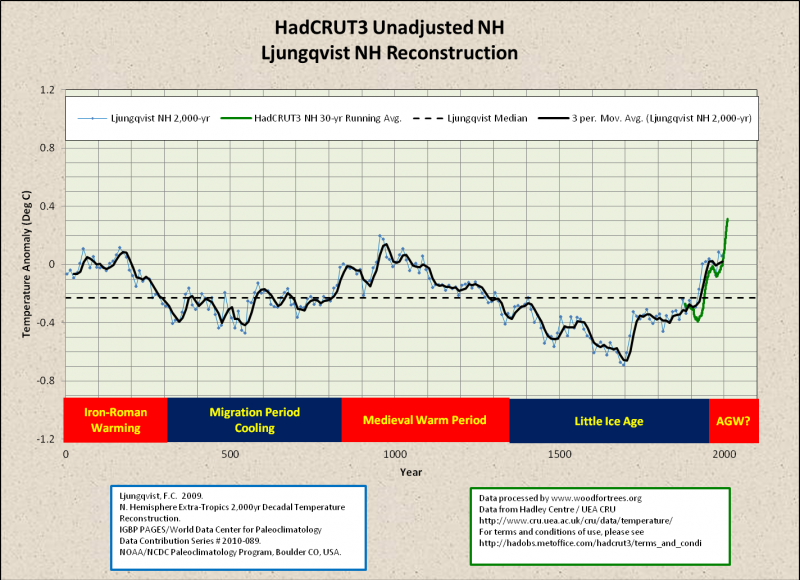

Yes, the Modern warming started in the late 1600’s.It is now around 320 years old,it is nearly done when compared to previous warming cycles of the last 4-5 thousand years ago. Warm periods lasts around 3-400 years.
The magic molecule will not stop the upcoming cooling,since the 1,500 year cycle can’t be intimidated by a trace gas,with a limited IR absorption range and near saturation condition.
Modern cooling is coming,there is nothing you can do to stop it.
If we’re lucky, the magic molecule will mitigate the next Little Ice Age.
.12C/decade
that’s .012/YEAR
just pointing that out that warmists are freaking out over a .012C degree rise per year. Are you freaking kidding me? You get more change in temp between going from sunlight to shade or a cloud passing on a sunny day.
So much ado about nothing…..AGAIN.
I think our problem in this modern time is our ability to measure things like picograms of poisons and single Becquerels. 1C in 100 years is not exactly a huge difference, but of course our more alarmed friends will say it is much more, say 1.5-3.0K / doubling which comes before the end of the century according to them.
That’s because the Apocalypse always happens at the end of a century….excluding the Mayan calendar….and the BIG Apocalypse is at the millennia mark.
Okay, and what percent of an AMO cycle is represented in the satellite record? Now recall that the answer is a percent of a grand total of one AMO cycle out of a set of irregular cycle episodes.
@ur momisugly Griff and all the insects, er, trolls here:
Correlation is not causation.
The burden of proof is still on the AGWers. It has never shifted to the science realists.
Moreover, there is anti-correlation, now:
CO2 UP. WARMING STOPPED (to any statistically significant degree).
Your windmills and solar projects are DOOMED.
Bwah, ha, ha, ha, haaaaaaaaaaaaa!
https://notalotofpeopleknowthat.wordpress.com/2016/09/07/sorry-alarmists-even-joe-romm-confirms-the-pause/
I’m happy to stipulate that
– it has warmed 0.12C / da in the satellite era
– this can be extrapolated back to 1950
– most of it is due to ACO2 with a little from the post-LIA trend
– the implied ECS can be extrapolated logarithmically
– the modelled adverse consequences attributable to that warming, past and present PROVIDED there is a reasonable estimate of the effect of CO2 accelerating crop growth to offset it
– any policies that achieve GLOBAL abatement that passes a cost-benefit test on the basis above have my support provided there are NONE allowed that merely shift emitting activity from signatory to exempt countries
I see nothing controversial about any of these positions, which I have consistently held for years. But I suspect this would but be in danger of persecution or even prosecution if stated publicly.
Has anyone looked into the possibility that global warming is caused by elections? It used to be that the election season really didnt kick off until labor day weekend. But now with all the primaries and conventions and so many candidates running for office, I think the amount of hot air being blown into the atmosphere is greater given a longer election season that is growing to the point of nearly overlapping with the previous season.
Maybe a surfacestations.org type project can be organized that tracks candidates and their locations in the vicinity of monitoring stations and see if there is a correlation.
I know is sounds silly but there have been so many ideas thrown around about what global warming can do that I thought maybe we needed more alternatives to what causes it as well.
Unfortunately my theory would imply out of control catastrophic climate warming no matter what we do. I see no end in sight and no cure.