
Guest essay by Eric Worrall
Think Progress is crowing that “even deniers” confirm an average satellite measured temperature rise of 0.12c / decade. My response is – so what?
Sorry Deniers, Even Satellites Confirm Record Global Warming
The planet just had its hottest 12 months on record.
The people who deny the facts of climate science for a living have had a really tough time recently.
For years they had been dining off the “there’s been no warming since 1998” talking point. But that one was mortally wounded when 2014 became the hottest year on record — and then it died entirely when 2015 blew away the 2014 record. And now a stake is being driven through the heart of this vampire again and again as every month of 2016 has been totally crushing both the record for hottest month and the record for hottest 12 months on record.
…
You will no doubt be shocked, shocked to learn that the satellite data has, in fact, confirmed global warming for a long time. Indeed Dr. Roy Spencer and Dr. John Christy of the University of Alabama at Huntsville (UAH) reported earlier this year that the satellite data shows a “Global climate trend since Nov. 16, 1978 [of] +0.12 C [0.22F] per decade.” And Spencer and Christy are both leading deniers themselves!
…
And now that dataset has once again confirmed what multiple data streams have been reporting for a long time: there is a long-term warming trend, and it has been getting worse.
In truth, none of this is funny. The lies of the professional deniers get repeated by the politicians and right-wing media who oppose action — and all that helps slow our response to the greatest preventable threat to our health and well-being. That is a tragedy we must all fight against.
Read more: https://thinkprogress.org/satellites-confirm-global-warming-ce6d636c469f
What kind of catastrophe awaits this century, if the calamitous 0.12c / decade (0.21F / decade) rise continues? The answer is none whatsoever. 0.12c / decade is well within the range of natural variation.
During the Holocene Optimum, 9000 to 5000 years ago, global temperature was warmer than today. The Eemian, the previous interglacial, was warmer still – up to 8C (14F) warmer in arctic regions.
What is absent from historical records of the warmer past is evidence of “tipping points” or abrupt harmful changes driven by mild global warming. Even when Earth’s CO2 levels were four times higher than today, the climate was stable, and only 7F higher than today’s temperature.
Even if CO2 is contributing measurably to global warming, it is not driving change at a rate which will cause harm to the biosphere.
It is a measure of the desperation of climate advocates that they feel such a compulsion to leap on every slight temperature wobble, in the vain hope that ordinary people will listen to their doom laden rants.
This is another bad post. You go from talking about rates of change to whether it was warm in the past. Clear bait and switch.
Amateurs.
The fact that it was warmer in the past proves the claimed rate of change may be due entirely to natural phenomena.
Absolutely correct. Climate change is a natural phenomena and IF human activity has a component it is no where near enough to drive climate change. The fundamental problem is there is no way to separate the effects of human activity from the Sun’s forcing function. The climate changes with or without the presence of humans.
The fact that it was (many degrees) warmer in the past proves that the claimed rate of change may be due entirely to natural causes, and have nothing to do with human activity. “Bait and switch” my azz.
that doesn’t exclude the possibility that climate change now may be the result of human produced CO2 – i.e. a new factor.
True, it doesn’t prove the slight warming since the end of the Little Ice Age was natural and not anthropogenic. But it certainly shows it could be.
And that’s a huge problem for the Climate Faithful. Their whole belief requires that the recent warming is ‘unprecedented’, that it COULDN’T be natural and must therefore be caused by human produced CO2.
Personally, the fact that they need to claim the ‘unprecedented’ warming of the last El Nino that shows up in the Satellite record as their indisputable proof of Global Warming tells me all I need to know about their crazy beliefs.
Do you think when the next La Nina is over and the Satellite record has returned to where it was back in 2013, that the Climate Faithful will admit they were wrong? Will they even admit it if we see significant cooling? I’m not holding my breath.
yep…and it also doesn’t exclude the possibility that we could be freezing our a$$es off if we hadn’t intervened
Climate science is so well understood….that no one knows
How’s this? At .12 degree C/decade it would be be ALMOST 1 degree C warmer in 2100; I seem to recall programs costing trillions that were targeted to holding warming below 2 degrees C by 2100.
Griff, the mere fact that CO2 hasn’t been excluded is not sufficient to prove that we need to do something about CO2 now.
Jim, and they are relying on the warm pulse caused by the recent El Nino to get even that 0.12C/decade.
A warm pulse that is already fading.
@Griff;
It is the obligation of the affirmative team (catastrophists) to provide evidence to support their claim. We can already show that it’s been warmer and colder in the past when CO2 was not the driver. We can also show in the last century a warming period from c. 1910 – 1940 that’s almost identical to c. 1975 – 2000. The IPCC itself says the “warming signal” can’t be detected before 1950. Therefore it’s the catastrophists’ responsibility to show how the rate of warming is different now from then and how CO2 is making that happen. So far, no dice.
Griff —
“Human produced CO2” is no different from “non-human produced CO2”. It is all CO2. We know that CO2 has been much higher in the past and the earth suffered no climate calamities. What’s this bug you have up your rectum about “human produced CO2”?
Do you believe “human produced CO2” causes ten times the green house effect that “non-human produced CO2 causes? Or something else crazy like that? Get help, man.
Eugene WR Gallun
The idea that a trace gas that easily moves in and out of the oceans can drive the climate is ludicrous. The IPCC models say that a tiny bit of warming caused by a tiny increase in atmospheric CO2 is magnified by water vapor that enters the atmosphere because that tiny CO2 warming.
However, what is entirely ignored is the water cycle, a powerful, global heat engine that ramps up with warming and brings the temperature back down. Rising convective, warm, moist air carries heat energy as well as the latent heat of evaporation (insensible “heat”) and returns cold water, as rain, sleet, or snow, to the surface. This cycle is responsible for the movement of as much as 85% of the surface insolation budget. If you ignore this massive het engine, then you have Trenberth’s problem where he cannot find the “missing” heat and tries to claim that the missing heat has somehow burrowed into the deep ocean and is lurking there, waiting to emerge later—a boogey man in the closet approach to science—constituting a willful ignorance of the water cycle and what it does.
The warmist models focus ONLY on CO2 and then consider water vapor as enslaved by a little warming to serve as a positive-feedback that can cause runaway warming. They completely ignore over 50 other major climate factors s they HAVE to have CO2 drive the climate. The fact that it has been much warmer than now in the past, when CO2 has been much higher than now, indicates clearly that runaway conditions or “tipping points” do not exist in our climate.
Warming by CO2 in any detectable way is a joke. a joke supported by junk science, totally biased to support the political agenda of blaming “climate change” on man’s activities. This gives politicians the backing to make policy decisions that are aimed at control, power, and money and have nothing to do with global warming by man that is not happening. Some fighting-climate change leaders have openly admitted that the agenda is to force wealth redistribution, destroy capitalism (the only system that actually creates wealth), and create a one-world government (which would HAVE to be socialist and totalitarian).
Do not forget that, as climate variation in the last hundred has been entirely within the normal historical variation range, it is irrational or blatant lying to blame recent warming on man just because you want it to be true.
“””””…..The planet just had its hottest 12 months on record. …..”””””
NO ! that simply is not correct.
For example, back East they had at least one month with record massive snow falls that shut everything down.
How could such a thing possibly happen during one of the hottest 12 months on record.
Even in California, we had at least one month that was nowhere near being one of the 12 hottest months on record.
All over the world people experienced at least one month that was nowhere near being one of the hottest 12 months ever recorded.
Total BS.
And for the record, the satellite record only goes back to about 1979.
And I personally don’t believe ANY Temperature records that pre-date that; nor those previous to circa 1980 when oceanic buoys started reporting that oceanic air Temperatures are NOT the same as oceanic water Temperatures, which were used for most of the previous hundred and fifty years. And since those two Temperatures were also found to NOT be correlated, it is inherently impossible; no matter what to correct those erroneous temperatures obtained from buckets of water, to find the true lower tropospheric atmosphere temperatures.
So we have barely begun the second climate 30 year period of credible temperature records, so it’s a bit early to be crowing about records.
G
Eric,
“It is a measure of the desperation of climate advocates that they feel such a compulsion to leap on every slight temperature wobble, in the vain hope that ordinary people will listen to their doom laden rants.”
To me, it is a measure of climate alarm skeptic’s unwise laziness when they use language like; “climate advocates”, rather than something like *climate alarm advocates* or *climate crisis advocates* . . I really believe it behooves us to make it clear that we don’t deny climate, are not skeptical of climate, or global warming, or advocate against climate, etc, etc.
“We” are being gamed, I believe, into adopting non-nonsensical lingo about ourselves, and thereby I believe, have missed many an opportunity to make clear that what the subject piece here is presenting, is simply wrong. Please consider avoiding the catch phrases which don’t speak to the aspect climate alarm/crisis skeptics are skeptical about.
PS ~ Also please consider adding a pale blue or gray line in the left-hand border of the middle column comment boxes, as I’ve suggested before, so I don’t keep sticking my comments in the wrong places ; )
Seems like all you’ve got cricket. That was an awfully lazy drive-by shooting. You missed and still ran like the wussie you are.
Amateur.
If 0.12 C/decade seems bad to you, how does it sound when every 6 months the globe has a dramatic shift of some +/- 25.00 C? That’s a rate of change 0.12 C/decade pales into insignificance by many orders of magnitude and, there’s STILL nothing bad to show for it except your fingers and toes either get chilly or you sweat a bit more and the trees either lose or grow their leaves.
Regardless, over the last 500m years (even late 20thC, according to GISS data fudgers), there have been higher rates of change (not just counting El Nino or La Nina), higher temperatures and higher amounts of CO2 in the atmosphere that only appear some 800 years after the warming, according to ice cores. This also applies to cooling. How you’ve managed to survive this long is incomprehensible according to your “scientists”, that have also miraculously survived alongside you.
Just because some data pointed to some month being 0.01 C/F higher than last month/year, doesn’t mean it’s anything meaningful, let alone measurable or honest. Data fabrication is statistically higher this month than the last. Go see Steve Goddard.
While you’re contemplating this on the Tree of Woe, many more REAL scientists, archaeologists, geologists and anthropologists will continue to find ancient tree stumps and manmade tools under glaciers that are retreating, which they have accomplished before. Proving that the climate will continue to change and icicles somewhere in the Arctic will continue to dribble in summer no matter what you espouse and poo yourself over.
Olaf,
he is so ignorant on what the IPCC, for years has been projecting their per decade warming rate, as part of their CO2 is bad for you campaign. If he bothered to read and learn,he would know that the Satellite .12C per decade warming rate is BELOW the minimum per decade warming rate as published in EVERY single IPCC report publication.
Thinkless Stagnation doesn’t bother to point out the inconvenient information.
I know Sunsettommy, that’s pretty much why I didn’t base my answer on $billion IPCC stuff in the first place and instead used facts that cost FAR less and has been known for a long time. Alluding to stuff Warmists use anyway, which is probably all cricket could comprehend:
That’s been a common theme among those that have no evidence or know nothing anyway, such as celebrities. They appeal to authority and claim us realists aren’t climate scientists, then quote the above as if they didn’t need any or facts either. Laughable, but also sad considering there are still people in the world too lazy to think critically and self-educate.
Evcricket,
you ignorance is clear,you failed to realize that the IPCC projected from 1990 on wards of at least .15C per decade warming (1990) to the current .30C per decade warming projection.
You offer nothing cogent here.
Cricket,
Thinkless Stagnation think they wrote a clever article attacking a group of people who for years have accepted the Satellite data all along,showing a warming trend since 1979. Why did YOU fall for their obvious lies,evcricket?
Dr. Spencer, has a personal climate blog where he post a monthly global temperature report, showing that it has warmed since 1979.
Skeptics have long known there is warming going on even further back to the 1800’s and even further back to the late 1600’s when the LIA bottomed out at the coldest point.
You are being easily mislead and lied to by their breathless crap.
“Dr. Spencer, has a personal climate blog where he post a monthly global temperature report, showing that it has warmed since 1979.”
You’re being misled into thinking that there is such a thing as a global temperature. It’s junk when either side of the issue uses it.
The article on “Thoughtless Stasis” is by good old Joe Romm, who gave up science for politics. I believe that both Drs. Spencer and Christie have been pointing out a mild warming in satellite data for several years. The warming was not in line with predicted changes (not big enough) and was generally ignored, trivialized, or criticized. Now it has become “warming” – italicized and bolded.
Recently we have also seen “warmist” thinkers “discover” that the planet has in fact warmed since at least 180 years ago, and that sea levels are not rising significantly or possibly at all based on longer term tidal-gauge data. What we see is a clique who have established themselves as being “very alarmed.” Now that everyone knows this they can be “very alarmed” about relatively trivial natural patterns, which they are now in the process of re-attributing to the “alarming” preconditions (of anthropic environmental changes). Hmmm, I may be suffering from apophenia.
Gees cricket, you poor little insect…
…. the ONLY warming has come from El Ninos and ocean oscillations.
neither of which are caused by CO2.
The only way you get a trend is by using those El Nino “events”
1979 was the very bottom of the AMO. That AMO is just starting to ease of its peak, and we have a somewhat sullen sun. The next few year could be very interesting for the farce that is called “global warming”/ climate change” / climate disruption”… or whatever the troughers want to call it next.
@ur momisugly AndyG55
September 7, 2016 at 11:58 pm: Andy, I was about to write the same, that 1979 was at the chil end of the last cooling cycle, c.32yrs. Been mostly the next warming curve since. But we are cooling again now, merely exiting a Nino/Japan Current heat release to space as cooling resumes. The AMO/AO is showing cold currents northwards which have the warmists wetting themselves and proposing their usual pseudo-scientific waffle. They are staring doom in the face in the waters near Scotland so there will be a lot of squawking…..
I would simply ask what are the alternatives and costs. If there is only one alternative and no idea about the costs it’s a good indication that Marxism is behind it all in order to attack today’s western culture and society. Marxism has been tried out in several countries, but it does not work. It’s a corrupt ideology and I will not be a serf under Marxism. No thanks.
Santa:
After decades of being a “leader” in our weird society, once bent on the idea of making freedom a genuine option, I’ve personally decided the vast majority are ignorant tax cattle, doomed to serve the rent seekers willing to spend time herding them.
As far as I’m concerned, good riddance. I’ll die soon enough anyway and I’ll likely spend the rest of my life on a ship in international waters. To hell with the rest of you.
Because as the rate of change stays constant, the temperature increases? You seem to be confused as to how rate of change and the effects of that change relate.
Live bait anyone?
http://oi68.tinypic.com/1zzm2vd.jpg
Now that is funny. Made me laugh. Thanks
Of course it is getting warmer what do expect to happen at the end of “The Little Ice Age” and the beginning of the “Modern Warm Period”. The real question is if it is abnormal and the is no evidence that it is.
John, it’s been my experience logic has no place in this conversation. As soon as hell freezes over the opposition will be both happy and dead. Game over.
Didn’t they say this is within normal variation, then compare current conditions with past events to show that there has been even more natural variation before the industrial era? How is that a bait and switch? Regardless – the point is well taken – there has been much more natural variation in the past, and the result wasn’t catastrophic.
if you look at the CET for the last 350 years it appears the globe has been warming at a fairly constant and moderate rate. The rate appears to be constant before, after and during the broad use of fossil fuels. Even in the last 50 years or so, with increased use of fossil fuels, the rate seems to be exactly the same. It would appear that natural variation could be a plausible explanation for this.
I find it hard to believe commenters like evcricket are not willfully dishonest .
The simplest , 8th grade projection :
http://cosy.com/Science/CO2vTkelvin.jpg
Except it’s well known that energy absorption follows beers law of Eabs=E(1-e^Ac), where A is a negative constant. Linear extrapolation is just plain wrong and will greatly overestimate the effects of the further you extrapolate.
You left ff the /sarc tag Ben. That may cause trouble around here…
Beer’s Law indeed.
Thank you Bartleby !
The importance of 0 based scales for any computations is something that should be basic knowledge at the 8th grade level .
Both points are relevant.
What’s amateurish is you pathetic attempt to change the subject.
Funny that you don’t point out that the “Sorry Deniers, Even Satellites Confirm Record Global Warming” is based on a lie since skeptics (not the “D” word) have not denied that the planet has been warming, although we have pointed out that for almost 20 years there had been a pause in that warming which is something that does not fit in the Alarmist’s predictions/projections.
It was Joe Romm who wrote that. He has a former life as a physicist, but has now converted to politics. The “d-word” is a political key. It is meaningless, oxymoronic and only appeals to about 1/2 the population who never were taught critical thinking or how to read for meaning.
If you honestly think there is a proxy from thousands of years ago that is as accurate as .12c a decade you aren’t even an amateur. You are on the sidelines never getting picked.
Caligula, it’s obvious you lack a solid grounding in statistical methodology.
What you do is take a few measurements by “proxy” a couple thousand years (estimated +/- 10,000 years) accurate to +/- 100C, put them over the estimated time, and divide. Then you report the results with one tenth degree C precision. Simple as cake. Easy as pi.
Sorry, didn’t see the 2. One one hundredth degree precision. A pi walk.
So what’s the problem? You folks went from denying the satellite record – 19 years of no warming – to embracing it because it came up with a year of warming. Do you always think that everything has to be according to your rules?
Tom, rules are meant to be interpreted. A person can’t be constrained by rules. How could we ever sell sneakers if we took all those rules so seriously? Be realistic.
“What kind of catastrophe awaits this century, if the calamitous 0.12c / decade (0.21F / decade) rise continues? The answer is none whatsoever. 0.12c / decade is well within the range of natural variation.”
It also means we can meet the Paris targets on “business as usual” emission levels. Game over.
As if .12C is any big deal 🙂
Tom Halla.: ” As if .12 C is any big deal” ,
if I read the article the right way, that was per decade? That in it self would be even more minuscule.
It would be quite literally below the margin of error of instrument decay on the sensors used, thus a false number to begin with and unscientific to use it at best.
“As if .12C is any big deal :-)”
And it’s mostly toward the poles and in winter during night. We would not notice.
Probably well within the +/- margin of error again.
Statistical significance for that rate would be hard to establish particularly in view of the known dependence and memory driven chaotic behavior of the temperature time series.
http://papers.ssrn.com/sol3/papers.cfm?abstract_id=2763358
http://papers.ssrn.com/sol3/papers.cfm?abstract_id=2776867
Well, you only get to .12 by including the monster El Nino we are in now and prior to this El Nino, satellite measurements had shown no increase since 1998. For sure they showed from 79 (the start) and 1998. Cherry picking El Ninos of 1998 and 2016 is just desperate. It reminds me of the charts floating around that ended in 1998. Probably because they know monster ones aren’t too common and they know it is going to level off. No claim yet that co2 makes El Nino? Ha..
Don’t you mean “Well, you only get to .12 by including all the temperatures from the start of the UAH satellite record to the present”? The number quoted is for the whole satellite record, no cherry picking. Incidentally, the RSS number is .13 for the TLT set (still using the flawed v3.3 methodology) and .177 for the TTT product (using the new V4.0 method that takes better account of diurnal drift).
Knowing we are in an El Nino, the biggest since the 1997-1998 one and ONLY THEN can you get to 0.12 per decade is akin to purposely ending your dataset on a high point, as you know a year prior will show something entirely opposite to your agenda. Then using those peaks, which are ENTIRELY understood to be not caused by CO2 to justify your stance on AGW is not that far away from fraud. In 5 years that 0.12 will have dropped off again and the next El Nino will be eagerly awaited to again start picking the peak and saying “Look! 0.12 warming a decade again”.
Incidentally, 0.12 a decade would be lower than even the most conservative IPCC forecast.
No, I don’t think anybody is “purposely” ending the trend from the start of the satellite record to the present day: its just reality that we are where we are today. There have been several strong El Nino and La Nina events within that period. All the data shows is that the net warming irons out to a trend. As for your claim that rolling the clock back a year “will show something entirely opposite to your agenda”, that is simply incorrect. If you do so, the UAH6.0b5 dataset would then give a trend of 0.110 (+- 0.013 degrees). i.e. within the error margin of the current trend. The data are publicly available – go do the math properly.
Ah, you are right, I did miscalculate.
.11 or .12 (not sure if even statistically relevant). I don’t think this trend is concerning, even if it were to continue for another 3 or so decades.
Los niños, not El ninos, please. 😛 (same as in Los Ángeles).
Dave, so you are defending the use of bad data, because it’s the only data you got?
Dave, in a year or so, when we are in the middle of a La Nina, will you still be defending using all readings or will you be arguing that since the La Nina is a temporary phenomena, it should be factored out?
Always starting at the beginning point in a data series is not always the best. If you want to know how much a 40 year old person is growing which is better? Starting at birth or at age 20?
The same holds true for climate. Since we know there are natural cycles, starting at the beginning of the satellite data series is actually quite misleading. That is near the low points for both the PDO and AMO effects on the climate. At present the best starting point is probably the mid-points of the cycle which would be around 1994-95. If you then stop before the current El Nino contaminates the data you end up around .2 C / decade with UAH and .3 C / decade with RSS.
Quite a big difference considering this is still slightly influenced by the ocean cycles and occurs over a period where nearly 40% of CO2 emissions took place.
http://www.woodfortrees.org/plot/rss/from:1995/to:2015/plot/rss/from:1995/to:2015/trend/plot/uah6/from:1995/to:2015/plot/uah6/from:1995/to:2015/trend
MarkW, are you suggesting that the UAH satellite data is “bad”? I didn’t get any data at all – all I did was run analysis on the readily downloaded UAH V6.0 (beta 5) that you can get via links on Roy Spencer’s blog. The numbers I have quoted have not “factored out” any data at all, I just computed the trend to today and from 12 months ago and gave you the trend for both, because John was claiming that it was just the recent El Nino that gave that trend. The last 38 years of satellite records include several large El Ninos, La Ninas and volcanic eruptions that have all influenced global temperatures. But over all 38 years, despite that, there is still a trend.
Sigh. Dave, do we really have to go over this yet again.
You claimed that we have to all the data, regardless of where it started because it’s all we’ve got.
Actual scientist know that starting a recording at the lowest point in nearly 100 years is not a good way to measure actual trends. But then we all know that you aren’t interested in being accurate, just proving your point.
Dave – You are comparing apples and tennis balls. Yes, there was an increase in temperatures in the satellite records up to the monster El Nino in 1998. After that, temperatures stopped rising by any statistically significant measure. Until the recent monster El Nino, it was possible to extend a zero slope trend line all the way back to about 1997.
That is the “pause”. It was entirely counter to the warmist meme that CO2 had now set us on a course of relentlessly rising temperatures, and that meme was thereby falsified.
The claim now is that the “pause” is no longer, as the recent El Nino tips the trend slightly upward. But, El Nino is a temporary natural phenomenon, independent of any human attribution. Within the next few months, it will dissipate entirely. Moreover, there will likely be a significant La Nina cooling event to follow. The “pause” will continue, and likely even dip into negative trend territory.
Hanging the warmist hats on a temporary natural phenomenon is begging for humiliation in the months ahead. Global temperatures are simply not rising, and AGW is a bust.
All government and scientific papers in English say “the El Niños” because “El Niño” is a single concept, as in “The El Niños of 2004–2005 and 2006–2007 were weak, moderate in 2002–2003, but moderate La Niña occurred in 2010–2011.” It’s not treated as if “El” and “Niño” were two separate Spanish words being used in an English sentence.
Dave
September 8, 2016 at 11:48 am
The trend will at the very least fall over the next year and quite possibly disappear in coming years. In any case, it’s tiny and an artifact of another super El Nino, natural phenomena which occur around every 15 years or so.
The most important point, though, is that the insignificant warming currently visible in the satellite record is far below that predicted by models. And if you look back before the dedicated satellite record began in 1979, it’s even more obvious that there is no correlation between rising CO2 and temperature.
Earth’s response to rising CO2 for 32 years after the end of WWII was to cool dramatically. Then, in 1977, the PDO flipped and the planet started to warm. This natural cycle happened to coincide accidentally with the continued rise in CO2, and indeed contributed to the increase, since warmer water gives up more of the beneficial, essential trace gas.
Your persistance at Sonoma has steadily raised my opinion of the school. Thanks for posting those links. The Greenland paper is particularly interesting. No trend in over a century – very interesting to say the least.
The air temperature can change very quickly.
http://vortex.accuweather.com/adc2004/pub/includes/columns/newsstory/2016/650x366_09071847_page-1.jpg
So what causes this cold burst? Where does it come from? Is space not cold?
“Is space not cold?”
Space is cold. The equator is warm. Hot air rises.
We call this process convection.
Circulation in the north.
http://mp1.met.psu.edu/~fxg1/SAT_NHEM/animwjap.html
No, space is not cold. Nor is it hot. Substances in it, radiation passing through it might be thought to have temperature but if vacuum had temperature your thermos would fail.
No one has answered the question. Sigh.
“there’s been no warming since 1998” talking point. But that one was mortally wounded when 2014 became the hottest year on record — and then it died entirely when 2015 blew away the 2014 record. And now a stake is being driven through the heart of this vampire again and again as every month of 2016 has been totally crushing both the record for hottest month and the record for hottest 12 months on record.”
As always, not as smidgen of data. Preposterously exaggerated warming , cannot make any claims about whether statistically any warming trend is present. Also “hottest on record” (by a tiny amount) is not even hottest of this eposh – both the Roman and Medieval Warm periods were considerably warmer. The “record” they refer to is meaningless. And I never heard either Christy or Spencer ever deny that there is a warming trend going on . The history of the planet for the past multi millenea has been one of warming. If you find cooling, that would be a big deal. Warming no big deal, people. The stupidity of the global warmists is that they cannot seem to understand that the issue is not whether (irrelevant) but how much warming can be ascribed to human activity. Correlations between CO2 and warming have been low enough to lead anyone to doubt the capacity of CO2 to cause massive warming. And thank God the warmists don’t have the ability to control carbon emissions – those morons would render our planet incapable of feeding itself. All can see warmists as emotional, irrational “Earth saviors” whose religion is more primitive and stupid than any Fundamentalist variety of the past.
The “hottest year on record” is still 1998…
http://woodfortrees.org/graph/uah6/mean:12
The recent monster El Niño has disrupted the hiatus.
The trend since 1998 now stands at +0.035 °C per decade, with a robust (/SARC) correlation coefficient of R² = 0.0098.
0.035 and 0.0098 are not exactly synonymous with zero-point-zero; but they do round down to zero-point-zero.
You have to be very careful when looking at temperature data; you must consider if the data has been dishonestly adjusted.For example, NOAA has been regularly and progessively adjusting older data downward and recent data upward, such that they finally erased the 1950 to 1978 cooling we all lived through. It is just a continuation of the attitude that, if you do not like what the datA SAYS, you can change the data, a la the fraudulent hockeystick graph that removed the Medieval Warm period and The Litle Ice Age.
!938 remains the hottest of the last century and the claims about 2015 and 2015 derive from altered data.
You cannot trust a man whose livelihood and welfare of his family depends upon him agreeing with his boss. The same, unfortunately, is true for some scientists and their government funding, the sources of which are politicians who have an agenda that requires control of other people and resources.
@ur momisugly David Middleton
September 8, 2016 at 6:52 am: But luckily we have kept the untainted records, for the reckoning and ultimate return to ground Truth. E.g. 1936-38.
So at the current rate we are on track for the aprox 1 degree every century warming that has been happening since the last ice age. Ya got me shaking in my boots. Holy cow folks adapt or die. You believe in evolution right? Prove it.
You are kidding I hope? The last ice age ended around 8000 years ago. Are you suggesting it has warmed 80 degrees since then?
Charitably I suspect he meant the little ice age.
80 degrees in London today, give or take, and it was probably 0 or lower in the Ice Age…Fahrenheit mind you!
As the peak temperatures of the Minoan Warm Period (WP), Roman WP, Medieval WP, and Modern WP have each been successively cooler, there is every reason to predict that we are on a downward trend. eventually to the next glacial period. To assume a 1 deg C warming into future decades or centuries is unfounded and not defensible.
In some parts of the world it may have warmed 80 degrees C. Toronto and London were under thick sheets of ice based on the very little we suspect. 12,000 years ago according to the feeble records we’ve guessed at? An 80C climb isn’t off the menu.
The question is not whether global warming will cause damage to the biosphere but whether or not it will damage human society. Changing monsoon patterns could result in 100 million people in south east asia and africa not being able to grow enough food. Similarly several meters of sea level rise would also result in the mass migration of nearly 100 million people. Both events are possible (I have no idea how likely) and so that the issue is the lack of resilience of our current society to small changes to the environment.
The issue is “when”. This planet and the surrounding cosmos has been throwing everything at life on the surface since day dot. Stability is something a region may see for a decade or so, however there’s always change at some point and no way to predict it. Ergo, be ready.. 🙂
And another issue is ‘how quickly’. Adjustment to rapid change is more difficult.
0.12C/decade is rapid change?
Are you really that desperate?
Yeah Griff, look how poorly the human race adapted to climage change at the end of the ice age. Somewhere a Clovis man is missing his continental glaciers.
Everything doesn´t look that grim:
Inconvenient Study: CO2 fertilization greening the earth
Looks like Russia has a 11% over-production of wheat this year (or it could be state propaganda). Those fields look very heavily packed.
Yah. Food production is really suffering./sarc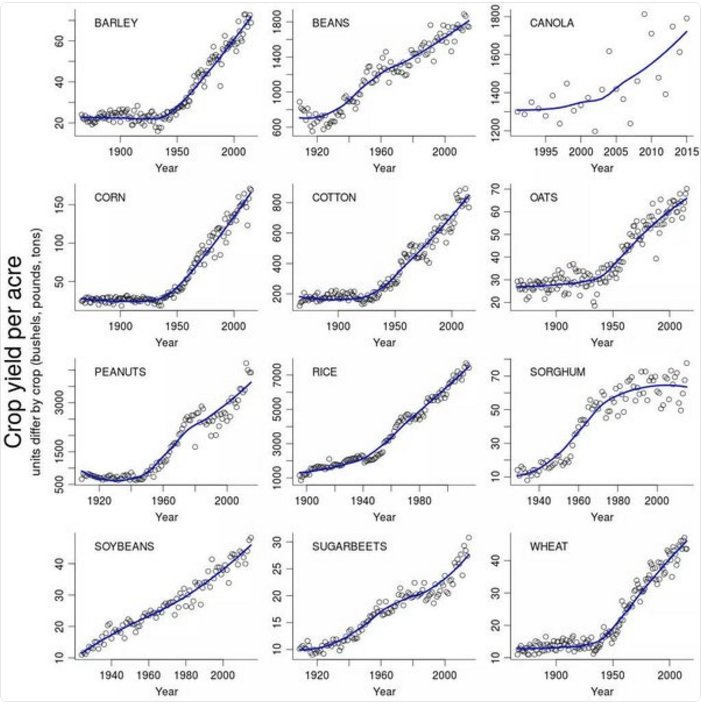
That is an enormously telling set of graphs. Thanks for providing that figure. 🙂
Sorry, the link was messed up by wordpress, It was to an article on this site – searchable.
And if the moon doesn’t rise tonight we are all dead!
depends…..
michael ;-D
If the moon doesn’t rise tonight, I might need Depends.
@ur momisugly Geronimo: The climate has little to do with losing the lives of millions of people. If we could and frankly SHOULD provide these regions with cheap ( yes coal and oil) energy to stop these cultures from denuding forests ( which actually leads to more ecological disasters like floods) to “heat” their homes and provide “fuel” to cook meals,
Cheap energy would provide them with hospital care and education, both made way easier with cheap energy and there would not be hundreds of millions of lives in danger.
I just cannot grasp the inhuman, mean, and frankly despicable way these so called “humanitarians” are influencing policies everywhere. It is sickening.
Education, basic health because of cheap energy will lead to salvation for actually many hundreds of millions of people.
It would lead to a stable societies as that has been proven for centuries.
But I guess on this site I am preaching to the converted ( unlike you)
Toby I would agree with you that we should be doing more to improve
the lives of everyone. But that is not the point I was trying to make — my
point is that currently there is very little resilience built into human society
which means that it does not take much to cause a huge disaster. Consider
the Irish potato famine as an example, one crop failure (combined with disastrous polices from the British) meant the death of millions.
If you aren’t able to see that our society is lot more resilient today compared to 200 years ago, then you are deliberately not looking.
Wealth is what makes societies resilient, and wealth comes from cheap energy.
repeated annual (serial) crop problems … not just one year.
You idiot.
100,000,000 people?? really?? what suburb do they live in?? warmer temps are REQUIRED for rice growing. in fact you provide no FACTS what soever, just the usual Emotional terrorism of the Crimate Crew
“several meteres of sea level rise” ??? really ?? that would induce a small change to the environment. ??
go back to bed.
regards
The point here, I believe, is that we still do not know how much of the warming is natural and how much is anthropogenic. Demonstrating that the planet is warmer does not imply that said warming is 100 % anthropogenic, or only 50 % anthropogenic.
Similarly several meters of sea level rise would also result in the mass migration of nearly 100 million people.
Makes that “wall” across your southern border all the more useful! Go Trump!
The Chinese have over 300 million people living in coastal cities and they know just as much as the West does about climate change. So why are they still building coal fired plants while we are demolishing our own competitive ability and adaptability? Because the Eco-Left is so stupid is why! Wake up! Chinese science is focused on what is good for China while Western science is held captive by the Eco-Left who couldn’t care less what happens to human beings, even if it’s just a bad dream!
The monsoon cycle is driven by the fact that temperatures over land rise faster than they do over oceans.
Even if the world warms up a smidge, that will still be true.
It’s always been nutty. Pure panic mongering. Weather fronts are driven by temperature differentials. But the GHE more evenly distributes temperatures, and increased warmth via that avenue would result in lesser, not greater, storminess.
The Moon crashing into the Earth would cause a lot of problems too… And it’s more likely than “several meters of sea level rise” over the next few hundred years.
http://i90.photobucket.com/albums/k247/dhm1353/SL4_zps22bee1aa.png
OMG, Geronimo actually believe humans can control the climate. Face-palm.
To be fair, I didn’t glean that from Geronimo’s remarks. He didn’t attribute warming to human emissions, and he said nothing about humans controlling the climate. He discussed some possible and not entirely unlikely effects from future warming (from whatever cause) even if they could be described as “worst case”. He did discuss human resilience, and implied we would need to adapt to any such changes, something I think pretty much everyone here would agree with wholeheartedly. Where’s the beef, Richard M?
@ur momisugly brians356 ,
Short of Dr. Evil melting Antarctica with his orbital “laser,” “several meters of sea level rise” is physically impossible over any human-relevant time-line. It’s not a worst case scenario. It isn’t even realistic enough to qualify as bad science fiction.
Geronimo —
i see you attend the Ehrlich school of “big lie predictions”. Ehrlich and Goebbels are surprisingly similar in their technique. The bigger the lie the better.
Eugene WR Gallun
Eugene,
See my comments to Richard M. Are you chaps reading comments from Geronimo I’m not seeing? (What’s wrong with my browser …?)
I have to agree. I don’t see anything in what Geronimo wrote that indicates any of the ideas being criticized. except that bit about “several meters” of sea level rise. That would need either Greenland or Antarctica to lose its cap. That has been addressed already above by Chaamjamal:
http://papers.ssrn.com/sol3/papers.cfm?abstract_id=2776867
No warming on in at least a century in one location. Not gonna happen.
Technological sophistication equals adaptability and resilience. That depends on cheap or at least cost effective power. The enforced impoverishment of the world via “green” power options puts the developing world in particular in the cross hairs of virtually any disruption. Disaster there turns into disaster everywhere through refugees, war and famine. Cheap power lets them get on with development.
The notion that CO2 and/or rising global temperature is making it more difficult to grow food is completely unhinged from reality.
Only 6,000 years ago there were lakes and rivers on what is now the Sahara. 18,000 years ago sea level was 400 feet lower. 1,200 years ago spruce grew and then were overtaken by glacier expansion in Alaska, only to just now being exposed by glacier retreat. Large changes in environment are, have been, and will continue to be condition of life on Earth. The idea that the most adaptable organism on the planet, humans, cannot successfully survive moderate warming of 1.2 C per century is ignorant and misinformed. Worry should be directed at the inevitable 100,000 year glacial period due within the next several thousand years. We have been in an Ice Age for the past 35 million years, and are now on a cooling trend.
Have a close look at the set of figures provided by Artemis. Add to it that:
25 New Papers Confirm A Remarkably Stable Modern Climate: Fewer Intense Storms, Hurricanes, Droughts, Floods, Fires…
We are halfway to the 2-degree global warming limit – If we believe in homogenisation of temperature records. I know it won´t suit the agenda of those benefiting by the scaremongering – but it seems more like we are halfway to heaven than halfway to hell.
Are you sure your haven´t been scared by a political movement? I used to be quite scared, but the data tells another story – I ain´t scared no more.
What does he think he is achieving with his vile insults. This is about as weak as commentary can be. Where does he talk about natural variation. 1.2C+-??.
He is just a marketing person with no understanding of what he has said.
Jack,
Natural variation from 1850’s onward is about .16C per decade warming in ALL three trends,according to warmist Dr. Jones himself.Here is his answer to Roger Harrabin’s question:
“Do you agree that according to the global temperature record used by the IPCC, the rates of global warming from 1860-1880, 1910-1940 and 1975-1998 were identical?”
Dr. Jones replies,
“Temperature data for the period 1860-1880 are more uncertain, because of sparser coverage, than for later periods in the 20th Century. The 1860-1880 period is also only 21 years in length. As for the two periods 1910-40 and 1975-1998 the warming rates are not statistically significantly different (see numbers below).
I have also included the trend over the period 1975 to 2009, which has a very similar trend to the period 1975-1998.
So, in answer to the question, the warming rates for all 4 periods are similar and not statistically significantly different from each other.”
http://news.bbc.co.uk/2/hi/8511670.stm
There is a chart in the link showing that .16C is the common warming trend line
Yes it is reasonable to say that .12C falls within a natural variable range since there is some past evidence of it.Thinkless stagnation is an embarrassment to rational thought..
Sunsettommy September 7, 2016 at 10:48 pm
Good post, that.
1.2 C Degrees per Century is well beneeth the 2 Degrees of the Paris accord last year, so lets have a congratulatory party and declare the war on Climate Change over and won since the rate is below the predictions and we obviously don’t now need to make any significant new taxes or radical policies or even need an IPCC to continue to monitor the situation as its clearly well below all the declared reasons for worry.
Since the onset of Global Warming what has been the downside?
Is there any evidence to suggest that slight warming is bad! Seriously, ANY?
Fewer hurricanes, more Polar Bears, less climate related deaths, increased crop yields, greener earth…
zzzzzzzzzzzzzzzzzzzzzzz
Ron —
But – but – you only have to stick your head out your window to see climate disasters happening!
Eugene WR Gallun
Eugene
I would stick my head out the window but it is unusually cold and wet! Record high temp for my neck of the woods is 47C in 1937!
The problem is that warmists and the poorly informed – often the same people – see .12C per decade and believe that it’s 100% human induced. They have a rather childish belief – reinforced by MSM, politicians, etc – that climate is constant or that our planet has passed its optimum temperature.
They see a tiny insignificant warming trend and say “aha! Proof!”, while ignoring what has happened in the past. It simply doesn’t matter to them that we cannot distinguish the natural signal from the human contribution, whatever that is, and they never look for any of the positives: Humans are a cancer. End of.
But for all the protests and climate tears from drama greens, the world’s major emitters are planning to build enough new coal-fired power stations to ensure that their CO2 emissions will rocket. India is planning more than 400 coal-fired plants, meaning its emissions will triple by 2030. China has absolutely no intention of halting the rise either. They burn more coal than the rest of the world combined and by 2030 80% of China’s total energy will be from fossil fuels, down from 90%.
I watched the Paris Agreement debate in the House of Commons yesterday and was stunned at how poorly informed our politicians really are – apart from David David, MP for Monmouth, who made an excellent contribution and was then called a “denier” by the Shadow Energy & Climate Change Secretary, Barry Gardiner (Socialist).
Sadly, until we see a period of cooling greater than the period of warming, it will be very difficult to turn the climate supertanker round. China and India will carry on regardless, of course, but politicians and climate lemmings in western countries will continue the assault on their own people in the belief that their actions are saving us from ourselves.
Resist.
I see evidence that it is human produced, based on scientific observation and research… I cross check the evidence presented before accepting it as fact.
In particular I have looked at the known causes of past warming – e.g. Milankovitch cycles, solar output – and looked at whether they are in effect now. I have looked at the temp records and if they are reliable.
I also keep a close eye on the fossil fuel sources which contribute CO2 and see that India and China are scaling back their coal power plant proposals and making great efforts in installing renewable energy. India is aiming at 100GW of solar by 2022 and has made a good start on that… This has been a recent and rapid change.
There’s no chance of cooling, alas…
Wish I could be here in 30 years to watch you eat crow.
The only reason China is slowing down the coal plants is because they have too many and they were building them to employ people. But they are trying to shift to nuclear and hydro.
I don’t know if you are lying, or really just this stupid.
The Milankovich cycle caused the Midieval, Roman, and Minoan warm periods?
India and China are scaling back on coal because they have an over abundance at present.
Sheesh, this moron actually believes the fact that politicians are rushing to make their buddies rich as proof that man caused global warming must be true.
Pathetic.
China’s annual coal consumption is projected to increase by 16.3% by 2020. Coming on the heels of a tripling of coal use since 2000, There is no scaling back. On the contrary, while saying it will cut emissions per unit of GDP, it projects that its economic growth will result in a CO2 rise of 50 per cent by 2030.
Don’t worry, though. They’ll use that cheap, dense, reliable energy to manufacture solar panels for the lemmings.
You see ‘evidence that [warming] is human produced’, Griff? Through what power of microscope? And it’s all based on ‘observation and research’? Who’s? Where are your citations? Is all the ‘warming’ down to ‘humans’, or just a bit of it? If it’s a ‘bit’ of it, how much?
And even if what you say is true, why is 1,2C in a century such a catastrophe? I assure you, there are greater things to worry about in this world.
Really Griff, a warming rate from 1979, that is BELOW the minimum IPCC per decade rate, is evidence that it is human caused?
Please don’t be this dumb again in pushing your unsupported assertions.
… a whole lot of cooling when the next large asteroid impact increases the earth’s albedo1
‘I don’t know if you are lying, or really just this stupid.’
Ever see ‘My cousin Vinny’? – when Joe Pesci is describing how to make a card look like a brick? He’s like some biased, partisan reporter microscoping a political speech for something that he can spin to his advantage.
It’s that sort of bought-and-paid-for, manufactured-earnest advocacy that you get when you hire a lawyer – or a salesman. But people create shadow puppets of their true motivations – both by what they say, and what they don’t say. My guess is that he’s a solar rep or something – hence the pseudo-capitalist language he uses to push his product.
So the short answer: yes, Griff the Grifter is deliberately lying (or more properly, misleading, after being deliberately obtuse), while giving the nominal appearance of staying within the lines. But definitely working backwards for the salesman’s talking-point – which is the job. Standard promotional/sales-methodology.
“this moron actually believes the fact that politicians are rushing to make their buddies rich as proof that man caused global warming must be true.”
More likely, he’s participating in the process of making said-buddies rich. This is a promotion he’s working on.
Griff
You really should open your eyes to how twisted this pseudo-science is. The Environmentalists have cross pollinated with the Socialists to declare de facto war on Capitalist industry without any idea what the consequences of that may be or what to put in it’s place. It’s Bernie Sanders 1930’s solutions married to the flowers and trees crowd with about 1 million people on the planet living in the jungle and wearing grass skirts. A sober, analytical and realistic look at this says that the temperature has been much warmer than this in the past, has been going up at about the same rate for at least 200 years, ocean acidification is a flat out lie. SLR is not even measurable against the variety of issues such as subsidence, gravitational anomalies, prevailing winds, reef growth, etc. Lastly, if you’re worried about people starving, concern yourself with population growth in sub-Saharan Africa where poverty and lack of education has them headed for +1 billion souls without a sniff of adequate development to carry that burden. You’re just way, way, way off the mark! Which is a shame because I’m sure you’re a reasonably intelligent person who could figure this out if you tried. That’s what the world needs now, Griff. Questioners! Not toadies to a twisted political orthodoxy.
The eco-loons take it as a given that life on earth is precariously balanced on a knifes edge, and any pertubation, no matter how tiny is capable of crashing the entire eco-system resulting in the death of everything.
Even if it were only 0.01C/century, they would still panic over it.
It’s an obsessive-compulsive disorder. Like constantly washing one’s hands.
Which fits nicely into the doctrine that any influence by human beings (who are apparently not part of nature, – perhaps planted by aliens) is, by definition, destructive and evil.
Eco-progressives would preserve nature like a mummy moldering in a tomb – all the while forcing humanity into cramped cities – and then bemoan the horrid conditions and overpopulation that plague these cities that they won’t let anyone move out of.
The mathematical abstraction called “global average temperature” is a meaningless construct built from a mishmash of instrument readings taken from below the waves and above the dirt, then subjected to constant politically-motivated Orwellian revisions designed to foster the illusion of incessant heat retention.
Of course, temperature measurements of a system containing dynamic quantities of water vapor and ice are a very poor measure of heat, especially when that system hasn’t achieved the state of thermal equilibrium required to establish a meaningful temperature in the first place.
Where in the real world is the alleged heat retention occuring, and what problems is it causing?
The article is about satellite records, not weather stations.
His question still stands, however – where is the harm? (the actual harm, not modelled projections) If this warming has been ongoing for quite some time, and this is the “hottest year ever”, then there should be demonstrable harm by now. Without that, there is no case, especially to warrant a complete realignment of world economies and the suppression of tech/energy growth in the 3rd world, which they desperately need. In fact, the case is easily made the world is better for the extra warmth and CO2.
urederra
The ThinkProgress quote says:
=========
“And now that [satellite] dataset has once again confirmed what multiple data streams have been reporting for a long time.”
=========
The article wasn’t just about the satellite record.
Nevertheless, in my category system I include satellite records as instrument readings taken “above the dirt,” and my points (concerning the validity of a “global average temperature” as a measure of heat retention in a system with variable ice and water vapor content kept far from thermal equilibrium) remain true when applied to those records. That is to say, the socially constructed “global average temperature,” even the satellite version of it, provides no useful information about conditions at any particular place in reality world.
Thus can an incessantly rising “global average temperature” be blamed for heat waves or blizzards, floods or drought, depending purely on today’s weather.
e.g.:
Scientists: Don’t make “extreme cold” centerpiece of global warming argument – WP, Feb 2014
Cold winters have been caused by global warming: new research – Telegraph, Oct 2014
Fall snow cover in Northern Hemisphere was most extensive on record, even with temperatures at high mark – WP, Dec 2014
Let me know when Earth reaches thermal equilibrium so I can take a meaningful temperature reading.
Perhaps my memory is faulty but it seems that for many years the CAGW crowd disavowed the satellite record because is showed no warming and frankly stated that it must be instrument error. Now, suddenly, when the satellite record indicates some warming, CAGWers swear by the satellite records.
Oh dear! What to do, what to do?
I know.. Fudge the data upwards as with everything else.
“Look.. It’s warming! The Earth isn’t biased, it’s on our side..“
“What kind of catastrophe awaits this century, if the calamitous 0.12c / decade (0.21F / decade) rise continues?”
Warming of the lower troposphere by 0.12°C/decade probably won’t trouble us much. It’s what happens at the surface that affects us.
Well, the last two years provide a lot of perspective on how warming ‘affects’ us, because there’s been three decades’ worth of warming with essentially no time for adaptation or technological change.
Take agriculture: a lot of studies claimed that temperatures of the 2000s were already ‘slowing gains’ in crop yields. Well, temperatures ‘surged’ an additional 0.5ºC or so from to 2014 to the first half of 2016 and still most major crops are at or near all-time records. Surely the warming-is-already-affecting-yields hypothesis is busted?
Or take weather disasters. They vary too much to draw any strong conclusion from an additional two or three years, but the last three-year period has the lowest losses (as a percentage of GDP) on record and the trend is clearly down.
Oh, but think of the children.
Careful Alan, you can be arrested for that (:-))
Only if you put it on your computer.
Nick@11:30pm
What do you think will happen at the surface and why is this bad for the human race?
I think it will warm, by at least 2°C/cen. How that will work out overall I don’t speculate, but I’m sure it will cause big effects that we need to figure out.
Nick @ur momisugly 11:58
2degrees per century is almost twice the 1.2 degrees we are talking about…but why should we worry about even 2 degrees…maybe it could be beneficial, eg. for food production. Maybe we should encourage a slightly warming world…I don’t like Ice Ages having grown up in Montreal (after the 2km of ice on top of it melted).
“Nick Stokes September 7, 2016 at 11:58 pm
I think it will warm, by at least 2°C/cen. How that will work out overall I don’t speculate, but I’m sure it will cause big effects…”
How are you so sure Nick? I mean the earth handles temperature variation every day very well as well as temperature variation annually as well as solar and El Nino and La Nina changes. So, Nick, where is your proof that convinces you that you are sure 2c/century will have “big effects”? Nick, you are talking rubbish again.
Patrick, it’s easy to be sure when your side controls the measurements.
Just keep adjusting until the data shows what you predicted.
Arguably, one “big effect” so far could be the lower intensity and frequency of hurricanes in the Atlantic.
Nick
“I think it will warm, by at least 2°C/cen. How that will work out overall I don’t speculate, but I’m sure it will cause big effects that we need to figure out.”
Being SURE it will cause “big effects” is speculation. Leaving out details doesn’t change the meaning speculation.
How much of your resources are you willing to contribute to figure it out? (Sit back, be honest, think about it and decide what percentage of your net worth you are willing to contribute figure it out). AND do you want to spend even more of your resources to mitigate the “big effects” before or after you/we figure it out?
Of course you are right to point this out so succinctly, Nick. Surface temperatures, land and air (obviously related but with a lag between any changes) are very influential in governing the rate of plant growth, on which life on Earth depends. They are not the only factors involved of course – CO2 concentration in the atmosphere, availability of ample water, and the necessary minerals in the soil – and no doubt others, but growth chemistry is temperature controlled to a large extent.
The temperatures experienced by plant life are the climate aspect of most immediate importance to us. Here in the UK I can grow many vegetables and types of fruit, but not oranges, bananas, some beans, rice, coffee and so on almost indefinitely. They require growing season average temperatures perhaps four to ten degrees C higher than what we experience. In Scotland, only 300 miles north of here the average temperatures are fine for oats but much less suitable for wheat. I have no data to hand, but am guessing that the temperature difference is perhaps 2 degrees C.
With these sorts of temperature differences occurring throughout the planet and over small distances and elevation changes surely a 0.12C general change per decade is well within our capability of managing.
Good thing that isn’t warming either.
@ur momisugly Nick Stokes
September 7, 2016 at 11:30 pm: My feet can take it.
I think they made a blunder telling their ignorant warmist friends,to accept Satellite temperature data,which shows a much smaller warming rate than their favored ever changing GISS data set,which is much warmer.
Actually the Berkeley Earth data set shows an even larger trend, and it’s not “much warmer” than the Satellite data. GISS gives 0.170, Berkeley is presently 0.178 per decade (both evaluated over the same period as the satellite record), versus 0.122 for UAH 6.0 and 0.177 for the RSS TTT satellite data. The satellite data is also “ever changing”: UAH is now in v6.0 beta5, which gives a different trend to v5.6 from a couple of years ago (a reduction), while the recent version revision to RSS (v4.0) gives a different trend to the previous v3.3 (this time an increase). These changes happen even in the satellite record as the scientists who interpret it discover flaws in their own methodology or come up with new ways to better account for known issues. I’m sure the current versions won’t be the last.
Yes… the satellite figures have been adjusted multiple times.
I think these silly numbers of rates of warming measured to1/1000th of a degree Celcius are meaningless in reality!
Griff, you really are a sucker for punishment.
Regarding the satellite adjustments. Everyone of them has been explained as to why they were needed and the adjustment methods were publicly displayed.
To bad the same can’t be said of your favorite warlocks methods.
“Everyone of them has been explained as to why they were needed and the adjustment methods were publicly displayed”
Actually MarkW thats not strictly true: Although Roy Spencer has published some of his revised methodology on his own blog for UAH6.0 beta5, there is, as yet, no peer-reviewed paper describing this. I’m sure you and others will flame peer review as a concept that validates data. I’m a scientist (not a climate scientist to be sure, but not that far from the field) and I’m the first to admit that the system isn’t perfect. But I still have to ask, why, when Roy Spencer’s latest monthly update states “NOTE: This is the seventeenth monthly update with our new Version 6.0 dataset” do we STILL not have a proper publication describing the methodology?
That’s why it’s still called beta. Sheesh Dave.
As to your claim to be a scientist, that isn’t evidenced by any of your posts.
@ur momisugly Dave
September 8, 2016 at 11:59 am: We have seen your pack of trolls claim various intellectual attainments over the years. But the evidence has only pointed to misused Arts studies at best. Not a sniff of Scientific Method, and nothing else counts.
As with ANY good scam, there always has to be an element of truth to the scam to make it work….
Yes, Think Regress, UAH and RSS Satellite datasets do show a global warming trend of around 0.12C/decade since 1979….. So what?
No one “denies” there has been about 0.81C of global warming RECOVERY since the end of the Little Ice Age in 1850, of which, CO2 forcing has perhaps contributed about 0.2C to the total. Again, so WHAT??
The disconfirmed CAGW hypothesis projected we’d experience a global warming trend of around 0.2C/decade over the past 20 years from CO2 forcing, but there hasn’t been ANY discernible warming trend since the middle of 1996, despite 30% of all manmade CO2 emissions since 1750 being made over just the last 20 years (excluding the 2015/16 El Nino spike):
http://www.woodfortrees.org/plot/rss/from:1996.6/to:2015.7/plot/rss/from:1996.6/to:2015.7/trend/plot/esrl-co2/from:1996.6/to:2015.7/normalise/trend/plot/esrl-co2/from:1996.6/to:2015.7/normalise
The 0.16C/decade global warming trend from 1979~1999 can easily be explained by: the 1980 30-year PDO warm cycle, the 1994 30-year AMO warm cycle, the 2nd & 3rd strongest back-to-back solar cycles in 1,000’s of years occurred from 1976~1996, the 97/98 Super El Nino event occurred (the strongest ever recorded) and 5 other El Nino Events between 1982~1995.
Now, all of these warming factors have REVERSED: both the AMO and PDO will be in their respective 30-yr cool cycles from 2019, and the weakest solar cycle since 1790 starts in 2022.
Regardless, the disparity between CAGW’s dire global warming projections vs. reality already exceed the criteria necessary for hypothetical disconfirmation:
Additional disparity and duration will simply increase the confidence interval of disconfirmation, which already exceeds 90%+.
For the CAGW hypothesis to be even considered viable, global warming trends would need to suddenly jump from near 0.0C/decade to 0.3C/decade starting from tomorrow and continue unabated for the next 10 years…
That ain’t gonna happen for the aforementioned reasons. It’s much more probable global temp trends will be flat to falling over the next 10 years and perhaps for the next 80 because of collapsing solar cycles and a possible Grand Solar Minimum event starting from 2033 and lasting 50~100 years.
CAGW is dead.
Good post. Thanks.
From the figure,it is clear that the rise in global average temperature anomaly is not even 0.04 oC/decade. Then where from 0.12 oC/decade rise has come from? Even the 0.04 oC/decade is not due to global warming but it may be less than 50% of it [IPCC] or 25% of it [In one of the posts somebody cited a reference of Dr. David Evans of Perth-based].
Dr. S. Jeevananda Reddy
RECOVERY since the end of the Little Ice Age in 1850…
You do realize that’s made up too, right?
1. No warming in the UAH satellite record from 1980 to 1998 El Nino
2. No warming between the end of that El Nino in 2001 and the start of the current El Nino at the beginning of 2015.
3. No warming in the southern polar region for the whole 38 years of the satellite record.
4. No warming in the southern ex-tropicals for 20 years.
5. No warming in Australia for 20 years, cooling since 2002
6. No warming in Japan surface data for the last 20 years, No warming from 1950-1990.. zero trend for 40 years
7. No warming in the USA since 2005 when a non-corrupted system was installed, until the beginning of the current El Nino.
8. UAH Global Land shows no warming from 1979 1997, the no warming from 2001 – 2015
9. Iceland essentially the same temperature as in the late 1930s as now, maybe slightly lower
10. British Columbia (Canada) temperatures have been stable, with no warming trend, throughout 1900-2010
11. Chile has been cooling since the 1940s.
12. Southern Sea temperatures not warming from 1982 2005, then cooling
13. Even UAH NoPol shows no warming this century until the large spike in January 2016.
That is DESPITE a large climb in CO2 levels over those periods.
THERE IS NO CO2 WARMING SIGNATURE..
The ONLY real warming has come from regional ElNino and ocean circulation effects.
The things you list above are mostly revisionist and disputed ‘facts’, which can only be supported by taking certain starting points for the changes or rejecting temp observations.
Just one example – here’s the research on Icelandic temperatures, at odds with your statement.
http://onlinelibrary.wiley.com/doi/10.1002/joc.1051/pdf
From the first paragraph of your link, Griff:
How does that possibly square with increased CO2-caused warming?
Also:
You really should think about a reading comprehension course, Griff.
This from the team that wants to start the clock in the coldest decade of the last 100 years.
Doug, you don’t expect Griff to actually understand the propaganda he’s pushing?
A good list of important points.
As regards 7, the USA data suggests that the 1930s/40s was the warmest decade and that the USA has cooled since then.
The take home of the satellite data set is as you suggest ENSO modulated by Volcano eruptions (at any rate short term). There is no first order correlation with the steady and unabated rise in CO2 levels, and there is nothing global about so called global warming.
If there is no long lasting step change in temperature coincident with the 2015/16 strong El Nino (there was a long lasting step change of about 0.3 deg C coincident with the 1997/98 Super El Nino) then when the current ENSO cycle completes it is probable that by 2017 the ‘pause’ will reappear and be over 20 years in duration.
If that is how matters pan out it will soon be the case that somewhere between 35 to 40% of all manmade CO2 emissions will have taken place without there being any statistically significant warming during the output of those emissions.
“… there is a long-term warming trend, and it has been getting worse …”.
==================================================
Since 1900 there has been no correlation between the annual rate of temperature increase and the atmospheric CO2 concentration trend — certainly so from ~1958 since when the CO2 trend has been almost monotonic:
http://www.climate4you.com/images/HadCRUT4%2050yr%20AnnualTrendSinceDecember1899.gif
Running 50 year linear annual temperature trend calculated from monthly global average surface air temperature anomaly
Just how long have scientists been measuring temperatures in hundredths of degrees? My guess is that before they started doing that, the temp would have been eye-balled it and they wouldn’t have been able to tell the difference. So just what are they measuring against?
Fully agree!
For ground based measurements, they still aren’t measuring in hundredths of a degree.
Prior to the digital instruments, the thermometers were marked in 1 degree increments, and the observers eye-balled it to the nearest degree.
MarkW,
To calculate a so-called temperature ‘anomaly,’ one subtracts a historical average from a current temperature. If that historical average was from a time when all or even some measurements were read only to the nearest degree, then the rules for subtraction and significant figures dictate that all significant figures to the right of the decimal point be dropped for the current temperature:
https://www.khanacademy.org/math/arithmetic-home/arith-review-decimals/arithmetic-significant-figures-tutorial/v/addition-and-subtraction-with-significant-figures.
Thus, any claim of anomalies with a precision of hundredths of a degree are invalid if derived from an average of base years that were not read to the same precision. The claims “Hottest on record,” are meaningless!
The claim is that if you average the readings from hundreds of thermometers, you can increase the accuracy of the result.
If so, then climate science would be the only branch of science in which that was true.
Learn about the Law of Large Numbers. The larger your sample, the more the mean converges on the population’s true value, because the errors cancel each other out. This is simply a basic mathematical fact that you can prove for yourself easily. A great many branches of science and engineering take advantage of that fact. https://www.khanacademy.org/math/statistics-probability/random-variables-stats-library/expected-value-lib/v/law-of-large-numbers
Tom: Are you paid to make a fool of yourself?
The law of large numbers only applies if the error distribution is Gaussian. In this case, it isn’t.
MarkW: Insulting me does not compensate for your being incorrect. The Law of Large Numbers does not require Gaussian distribution. Look in a textbook. Ask a professor. Ask a student. Research on the internet: https://en.wikipedia.org/wiki/Law_of_large_numbers
Those who measure tree rings to try to pry out historical temperatures, if they are honest (and if you are a regular here, you know that many strain the definition of that word), will tell you that they are accurate to 2 degrees F.
As usual, we get a Frankenstein grafting of “measurement” accurate to full degrees, to measurement accurate to decimal points.
For some reason, the political activists with degrees in sociology, political science and women’s studies, and who once took a semester of statistics, think this is how science works.
Many of us who were taught math in the 1980s, and who aren’t blessed with such high ideals of education, think otherwise.
When I was taking math at school if I were to use measurements with accuracy of +/- 1 degree C and ended up with results showing an accuracy of even +/- 0.1 degree C I would have failed.
I was taught that each calculation would actually increase your uncertainty. If you start your calculations with data with +/-1C error bars, you would end up with error bars even greater after all was said and done.
Learn about the Law of Large Numbers. The larger your sample, the more the mean converges on the population’s true value, because the errors cancel each other out. This is simply a basic mathematical fact that you can prove for yourself easily. A great many branches of science and engineering take advantage of that fact. https://www.khanacademy.org/math/statistics-probability/random-variables-stats-library/expected-value-lib/v/law-of-large-numbers
I am a ‘climate sceptic’ according to the forums I frequent. Let me just state that. However, the ‘bounce back up’ in the tropo of June, July, and August is surprising, to say the least. Why isn’t this being noted on here, and in other sceptic places? If it continues, we are in big trouble. With a La Nina, and yet tropo temps going up, that’s going to be hard to explain. If this happens…
http://www.drroyspencer.com/wp-content/uploads/UAH-v6-LT-with-2016-projection-3.jpg
…then fine, but it’s an ‘if’. The climb of 0.05 for each of the past two months is a little disconcerting. We should be honest and acknowledge this. Just because the other side isn’t honest, doesn’t mean that we shouldn’t be also. We await September’s…
Bazz~ don’t forget to take into account that temperature and weather changes lag an el-nino or la-nina by upwards of 6 months.
Bazzer- 4 months of adlibbing might be of concern, if it amounted to more than a missed apostrophe in the critic’s review copy of the script.
The reason is the JETSTREAM.
https://earth.nullschool.net/#current/wind/isobaric/250hPa/orthographic=-150.51,-1.00,300
No big deal. Just a classic head and shoulders pattern.
“However, the ‘bounce back up’ in the tropo of June, July, and August is surprising, to say the least. Why isn’t this being noted on here, and in other sceptic places?”
bazzer1959, look at the chart of the 1998 El Nino. It has several “up” blips on its way down, just like the 2016 up blip. It’s too early to say which way the temps are going, but my guess is down.
bazz ….. ENSO is always a NH late fall/winter phenomena. It appears the trade winds don’t really get going during the summer and therefore nothing much happens. If we are going to see a real La Nina it will probably get started in October and build from there.
Also you should look at a direct comparison of those months. 2016 was cooler than 1998 for all 3 months.
Global Temperature Anomaly (°C)
UAH June 1998 0.57 2016 0.34
UAH July 1998 0.51 2016 0.39
UAH Aug 1998 0.52 2016 0.44
RSS June 1998 0.567 2016 0.467
RSS July 1998 0.605 2016 0.469
RSS Aug 1998 0.572 2016 0.458
SST Anomaly 7-day Change
http://www.tropicaltidbits.com/analysis/ocean/cdas-sflux_ssta7diff_cpac_1.png
http://www.tropicaltidbits.com/analysis/ocean/
@ur momisugly bazzer1959
September 8, 2016 at 12:30 am: As the graph shows, notches are common ie normal. Just warmer or colder patches in a current.
That was:
http://www.drroyspencer.com/wp-content/uploads/UAH-v6-LT-with-2016-projection-3.jpg
Bazza think of the great climate shift of 1878, now that’s what I call a hot year.
ironicman, Ironically, I can’t seem to find that in the satellite record. What evidence do you have that it ever happened if surface temperature records are as flawed as folk on this site seem to think?
Bazz, look at the 1998 El Nino, the temperature drop from that one wasn’t smooth either.
MarkW September 8, 2016 at 6:51 am
Also the 2009-10 El Nino.
This will be interesting to watch. As I gaze into my crystal ball I for-see a second small up tick for the end of this present El Nino.
Then again my crystal ball is one of those glass floats that artisans on the Oregon coast toss into the Pacific which my son found.
michael
“Even when Earth’s CO2 levels were four times higher than today, the climate was stable, and only 7F higher than today’s temperature.”
From the wikipedia link you included: “The high eustatic sea level and warm climate of the Cretaceous meant a large area of the continents was covered by warm, shallow seas.” If having a large part of the earth’s continents covered in shallow seas is not catastrophic, we have very different definitions of that word.
During the Cretaceous, there was no Antarctic. So no Antarctic ice sheets. All that water had to go somewhere.
If you think that 7C will be enough to melt the Antarctic ice sheets, you really need to do more research.
“If you think that 7C will be enough to melt the Antarctic ice sheets, you really need to do more research.”
What is the research that shows that a temperature rise of 7C is insufficient to melt the Antarctic ice sheets?
The fact that the Antarctic continent is way, way below -7C.
A 7C increase would just mean that it isn’t as far below freezing as it is right now.
MarkW, the ocean temperature in Antarctica is most certainly not -7C. Most of the melting of that ice is due to warming ocean waters, the melting is coming from below, not from the air around it.
don’t believe it was very catastrophic for the abundance of life on the planet at that time. That catastrophe arrived from outer space about 66 million years ago.
“don’t believe it was very catastrophic for the abundance of life on the planet at that time.”
How is that relevant to our life today? There are 100s of millions of people living on coastlines around the world.
Chris,
What’s your argument? Are you saying that those ‘hundreds of millions’ of people will be flooded out?
If so… got any evidence that global SL rise is accelerating?
dbstealey, look at my initial comment.
Chris,
You mean the non sequitur in your comment of September 8, 2016 at 12:37 am?
You know, where you posted a past CO2 level, and then commented about sea levels?
What does one have to do with the other?
(No speculating, please. Just post solid evidence showing cause and effect.)
Quite frankly, this post leaves a lot to be desired. And it is plain wrong on some things. There are very evident tipping points in paleoclimate records. The last one about 18,000 years ago, when small progressive orbital changes triggered a very fast (geologically speaking) glacial termination and the world went from glacial to interglacial in a few thousand years. That is a warming tipping point. There are others like the abrupt warming associated to Dansgaard-Oeschger events. Several degrees in the Atlantic region in less than 80 years.
If Think Progress makes some very bad posts, WUWT should not try to win that competition.
Javier
“Tipping point” in the form the alarmists use it refers not only to a point at which change is accelerated but also a point from which there is no return or recovery. That is why we see repeated claims that we must act now despite the lack of evidence of human caused catastrophic change.
Javier,
There is only paleological evidence of a two state regime, ice age and interglacial. There is no paleological evidence for tipping points to a warmer regime from the interglacial regime. The Stefan-Boltzman relation is likely to preclude such tipping points. So don’t be a concern troll.
“There is only paleological evidence of a two state regime, ice age and interglacial.”
Not true. There is paleological evidence of very different regimes in the past 540 million years. Earth climate has been quite varied.
The only “mistake” (nothing deliberate is really a mistake) from ThinkProgress is that it is attacking a position nobody holds. No skeptic that I know has ever claimed that the satellites didn’t show warming since 1978. For some reason they want to make their followers believe that we did and we are proven wrong. I think the key is the later part. To make them think that they can prove anyone wrong. It is funny that they keep calling Roy Spencer “denier” when he has published a number of articles already proving the greenhouse effect.
The straw man is the the warmists favorite target.
They’ve learned not to attack anything they can’t defeat.
I read through the Joe Romm site the other day.
Only the most stupid, or mindless politico, would believe any of it.
If you do believe then look at other sites and join us in the real, non panic world.
There have been many questions raised here in the past that are overlooked in these comments. Whether or not there is some warming is not the only question. Some other questions are:
How much temperature change is natural versus man driven?
What is the optimum temperature of earth?
How much of the man driven temperature change is caused by fossil fuel use?
Is fossil fuel caused warming, if any, worse than the proposed cures?
There are more but it is early morning where I live and I need some more sleep.
Goodnight all.
Since we are discussing the press release, only issues related to that press release are relevant and likely to be brought up.
We don’t need to discuss the entire gamut of issues for every single article.