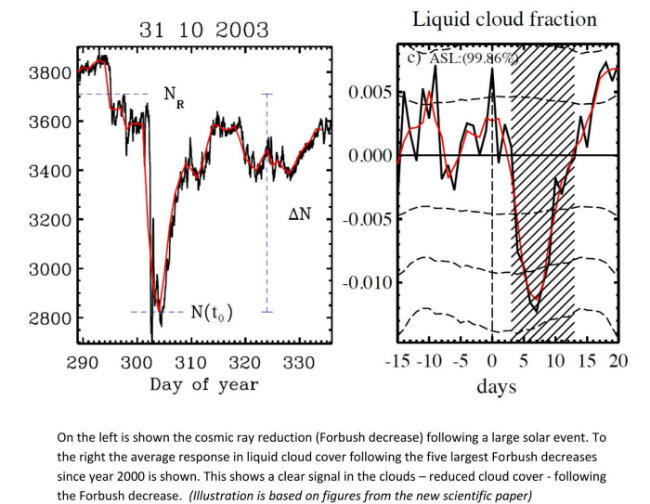
Solar variations affect the abundance of clouds in our atmosphere, a new study lead by DTU Space suggests. Large eruptions on the surface of the Sun can temporarily shield Earth from so-called cosmic rays which now appear to affect cloud formation. A team of scientists from the National Space Institute at the Technical University of Denmark (DTU Space) and the Racah Institute of Physics at the Hebrew University of Jerusalem has linked large solar eruptions to changes in Earth’s cloud cover in a study based on over 25 years of satellite observations.
The solar eruptions are known to shield Earth’s atmosphere from cosmic rays. However the new study, published in Journal of Geophysical Research: Space Physics, shows that the global cloud cover is simultaneously reduced, supporting the idea that cosmic rays are important for cloud formation. The eruptions cause a reduction in cloud fraction of about 2 percent corresponding to roughly a billion tonnes of liquid water disappearing from the atmosphere.
Since clouds are known to affect global temperatures on longer timescales, the present investigation represents an important step in the understanding of clouds and climate variability.
”Earth is under constant bombardment by particles from space called galactic cosmic rays. Violent eruptions at the Sun’s surface can blow these cosmic rays away from Earth for about a week. Our study has shown that when the cosmic rays are reduced in this way there is a corresponding reduction in Earth’s cloud cover. Since clouds are an important factor in controlling the temperature on Earth our results may have implications for climate change“, explains lead author on the study Jacob Svensmark of DTU.
Very energetic particles
“Since clouds are an important factor in controlling the temperature on Earth our results may have implications for climate change”
Galactic cosmic rays are very energetic particles originating mainly from super novae.
These particles generate electrically charged molecules – ions – in Earth’s atmosphere. Ions have been shown in the laboratory to enhance the formation of aerosols, which can serve as seeds for the formation of the cloud drops that make up a cloud. Whether this actually happens in the atmosphere, or only in the laboratory is a topic that has been investigated and debated for years.
When the large solar eruptions blow away the galactic cosmic rays before they reach Earth they cause a reduction in atmospheric ions of up to about 20 to -30 percent over the course of a week. So if ions affect cloud formation it should be possible to observe a decrease in cloud cover during events when the Sun blows away cosmic rays, and this is precisely what is done in this study.
The so-called ‘Forbush decreases’ of the cosmic rays have previously been linked to week-long changes in Earth’s cloud cover but the effect has been debated at length in the scientific literature.
The new study concludes that “there is a real impact of Forbush decreases on cloud microphysics” and that the results support the suggestion that “ions play a significant role in the life-cycle of clouds”.
Arriving at that conclusion was, however, a hard endeavor; Very few strong Forbush decreases occur and their effect on cloud formation is expected to be close to the limit of detection using global atmospheric observations measured by satellites and land based stations. Therefore it was of the greatest importance to select the strongest events for study since they had to have the most easily detected effect. Determining this strength required combining data from about 130 stations in combination with atmospheric modeling.
This new method resulted in a list of 26 events in the period of 1987-2007 ranked according to ionization. This ranked list was important for the detection of a signal, and may also shed some light on why previous studies have arrived at varied conclusions, since they have relied on events that were not necessarily ranked high on the list.
Possible long term effect
The effect from Forbush decreases on clouds is too brief to have any impact on long-term temperature changes.
However since clouds are affected by short term changes in galactic cosmic radiation, they may well also be affected by the slower change in Solar activity that happens on scales from tens to hundreds of years, and thus play a role in the radiation budget that determines the global temperature.
The Suns contribution to past and future climate change may thus be larger than merely the direct changes in radiation, concludes the scientists behind the new study.
Source: http://www.dtu.dk/english/News/Nyhed?id=b759b038-66d3-4328-bbdc-0b0a82371446
The full reference to the new paper is: J. Svensmark, M. B. Enghoff, N. J. Shaviv, and H. Svensmark, “The response of clouds and aerosols to cosmic ray decreases”, Journal of Geophysical Research – Space Physics, 2016, DOI: 10.1002/2016JA022689.
Click here or here to access the abstract and full scientific paper.
Related: (via the Hockey Schtick)
Solar physicist Dr. Leif Svalgaard has revised his reconstruction of sunspot observations over the past 400 years from 1611-2013. Plotting the “time integral” of sunspot numbers from Dr. Svalgaard’s data shows a significant increase in accumulated solar energy beginning during the 1700’s and continuing through and after the end of the Little Ice Age in ~1850. After a ~30 year hiatus, accumulated solar energy resumes a “hockey stick” rise for the remainder of the 20th century, followed by a decline beginning in 2004, all of which show remarkable correspondence to the HADCRU3 global temperature record:

“The most obvious way for warming to be caused naturally is for small, natural fluctuations in the circulation patterns of the atmosphere and ocean to result in a 1% or 2% decrease in global cloud cover. Clouds are the Earth’s sunshade, and if cloud cover changes for any reason, you have global warming — or global cooling.”
I am ambivalent about the effects of cosmic rays / clouds and here’s why. Cloud formation is a thermodynamically reversible process, that is, if you differentially reverse the process that caused the cloud to form, it will dissipate. This implies that there can be no change in the energy balance at cloud level as a result of the cloud’s formation. Before formation shortwave traverses the cloud level going downward. After formation, shortwave is reflected upward and longwave is reflected downward. Any discussion?
http://imnh.isu.edu/digitalatlas/clima/imaging/clddev.htm
“Cloud development is linked closely with the concept of stability, i.e., the tendency of air to rise. Although several factors determine whether or not clouds will form, the stability of the atmosphere is far and away the single greatest indicator of cloud formation………”
A luminous photosphere of energy radiates from our sun in all directions out across the cosmos. When that sphere expands to the average orbital distance to the earth its dispersed luminous surface emits a power flux of 1,360 to 1,368 W/m^2. But the earth does not orbit in a nice average circle, but in an ellipse with perihelion being closer and aphelion being farther. So how much difference does that make?
At perihelion (closer) the power flux is 1,413 W/m^2. At aphelion (farther) the power flux is 1,323 W/m^2. The total annual range/change/fluctuation is 90 W/m^2. Yes, 90 W/m^2.
According to IPCC AR5 the radiative forcing added to the atmosphere by the CO2 increase in the 261 years between 1750 and 2011 is 2 W/m^2. Yes, 2 W/m^2.
So if an annual 90 W/m^2 fluctuation does not cause catastrophic climatic consequences what possible reason have we to believe that 2 W/m^2 will?
Nicholas Schroeder, when did Earth reach last time 1,413 W/m^2 and when 1,323 W/m^2? Thanks for the answer.
Wim Röst
Measured maximum solar TOA levels are 5 January (every year) at 1408 Watts/m^2 and the minimum are at 1316 on 5 July (every year).
It follows a near-sinsuoid curve (within a 0.5 watt/m^2), which is available below in Excel format for DOY = day-of-year if you want it.
TOA =1362.36 + 46.142*(COS(0.0167299*(DOY)+0.03150896))
Theory holds that the yearly total remains the same, so the +/- change from the yearly average of 1362 can be ignored, and the average 1362 watts/m^2 at TOA should be used for everything, as if it were constant.
That’s not true, but that’s what those who believe in a flat-earth 1/4 TSI average TOA radiation level believe/use in their averages.
Whether their results are accurate or not depends on what you are attempting to simulate, and how accurate you are trying to make the simulation.
It’s math, geometry. Sphere = 4 pl r2. Divide the solar luminosity over the area of the sphere at aphelion distance and then at perihelion distance and those values pop out. I think it’s like the baro pressure on the local weather station, “corrected” to sea level. Or averaged.
It’s the power flux of the sun’s luminous sphere, what the earth receives.
A sphere of r has 4 times the surface area of a disc of r. The incoming flux is perpendicular to the earth’s cross sectional area. So divide 1,368 by 4 = 342. These popular diagrams do no consider day or night or seasons. Pie simple models.
“Theory holds that the yearly total remains the same, so the +/- change from the yearly average of 1362 can be used for everything.”
RACookPE1978, thanks for the answer. In respect to ‘climate’ (averaged 30 year period) the interannual changes are the most interesting, I expect. What about changes in W/m2 thanks to the Milankovitch cycles?
RACookPE1978
Thanks, I didn’t realize there was data to back up the calcs, I was just seeing where the numbers went. So what does this data tell us?
Let’s say that winter is when the tilted axis points the NH away from the sun and summer is when the tilted axis points the NH towards the sun. From the data it appears that currently NH winter coincides more or less with the aphelion, closer to the sun. So the power flux is set on hot, but the away tilt is set on cold so they counteract each other. Same with summer. The NH is tilted towards the sun and hotter, but is at perihelion and colder. So the colder perihelion is offset by the warmer tilt.
In 5,500 years +/- the earth will have precessed to the point that summer/winter will occur around the equinoxes, not the solstices and the power flux will be much less and equal summer to winter. In 11,000 years winter and summer will be opposite what they are now and the fluxes and tilts will double up not contradict. All of that is bound to change the atmospheric heating and climate.
So that’s what Milankovitch is all about. Why didn’t somebody just say so?
(NschroederPE1983)
Nicholas Schroeder August 27, 2016 at 7:04 am
“Let’s say that winter is when the tilted axis points the NH away from the sun and summer is when the tilted axis points the NH towards the sun.”
WR: Nicholas, I read the above sentence in this way: “Let’s say that a cool period develops when the tilted axis points the NH away from the sun and that we get a warming period when the tilted axis points the NH during the NH-summer (July) towards the sun”. Am I right that this is what you mean?
The data RACookPE1978 gave at 7:21 pm says, that the sun sends right now the maximum energy when the South Pole (!) is pointed to the sun: “5-Jan 1408 Watts/m^2“. And the minimum solar right now is when it is summertime on the NH (July) – 1316 Watts/m^2. Which reminds me to the lowering trend of the Holocene temperatures, after the Holocene Optimum.
We know that we need maximum solar at the NH (!), at 65N in July to get a maximum warming effect of the Earth. And not a maximum solar at the SH as is happening right now in January. You are writing “In 11,000 years winter and summer will be opposite”. So, 11.000 years from now the NH and the Earth will warm again at the maximum. Like they must have done 11.000 years ago, at the end of the last glacial………
Do I understand you well? In that case – and when you are right – you are completely right in saying: “Why didn’t somebody just say so?”
(P.S. Perhaps it is difficult for some people to realize that the last period of ‘out of the Little Ice Age warming’ is only a minor part of the total ‘downward Holocene trend’ of the last 6000+ years. But realising that we have to look at a 10.000 – 20.000 year time scale, inclusive a possible time lag of a couple of thousands years changes the whole perspective. This means that the Earth (if nothing would have been changed – CO2) would continue it’s cooling trend for some more thousands of years, as the Holocene Optimum was only 5000-9000 years ago, as far as I remember. So another 6000-2000 years of cooling would be in front of us, apart from eventual CO2 effects)
Hallo Wim
I think we don’t have to look so far back
nobody I know will be alive 2000-6000 years from now
rather keep the discussion for the past few hundred years and hundred years from now…
http://www.nonlinear-processes-in-geophysics.net//index.html
google: persistence of the Gleissberg
and see what you get
http://www.nonlin-processes-geophys.net/17/585/2010/npg-17-585-2010.html
[I think I gave the wrong link in my previous comment]
It is miraculous if we can abrupt this downward trend. So what do we do? Hypnotize the populace into refusing the miracle.
==============
Not many Olympic events come down to two dueling Danes, however, relatively junior Dr. Svensmark v. the senior Dr. Svalgaard.
This is all a lot of looking under the lamppost. The key is in the oceans, and it’s dark out there. Meanwhile, the drunk tries to explain his alcohol level to the cop without knowing how much he’s drunk nor how his liver works.
==================
“””Possible long term effect
The effect from Forbush decreases on clouds is too brief to have any impact on long-term temperature changes.
However since clouds are affected by short term changes in galactic cosmic radiation, they may well also be affected by the slower change in Solar activity that happens on scales from tens to hundreds of years, and thus play a role in the radiation budget that determines the global temperature.
The Suns contribution to past and future climate change may thus be larger than merely the direct changes in radiation, concludes the scientists behind the new study.”””
Fluxing around with the radiation budget them thar GALACTIC cosmic rays.
________________________________
lsvalgaard August 25, 2016 at 8:19 pm
. GCR have a Gyro radius around the interstellar magnetic field
Not when in the Heliosphere or near the Earth, so not relevant for the topic.
________________________________
Better take a closer look Dr. S., cause I’m only just skimming, cause I’m tired.
Please do note from whence these particles are coming IN from….
Measurement of the radial density gradient of cosmic ray in the
heliosphere by the GRAPES-3 experiment
http://tevpa2012.tifr.res.in/publications/journal/Radialdensity-Kojima.pdf
H. Kojima a,b, H.M. Antia b,c S.R. Dugad b,c , S.K. Gupta b,c,⇑, Y. Hayashi b,d,
P. Jagadeesan b,c, A. Jain b,c, S. Kawakami b,d, P.K. Mohanty b,c,
T. Nonaka b,d, A. Oshima b,e, B.S. Rao b,c, S. Shibata b,e,
Accepted 2 July 2014
The GRAPES-3 Collaboration
Introduction
“”These particles gyrate around the IMF but the presence of irregularities
in the IMF scatters them away from a regular gyro motion.
Also these IMF irregularities impact the convection of charged particles
by mediating the interaction of the solar wind with the
incoming cosmic rays. The overall impact of this phenomena is diffusion
and convection of the particles from the heliospheric boundary
towards the Sun. However, this diffusive motion of particles is
influenced by the gradient and curvature drifts in the IMF [1–3].
The solar modulation in the heliosphere results in streaming of
particles that produces an anisotropy in the flux of galactic cosmic
rays.””
Two major components in GCR reaching Earth’s Atmosphere
“” This streaming may be decomposed into two major components,
first one in the ecliptic plane and the second perpendicular
to this plane. The galactic cosmic rays entering the Earth’s atmosphere
produce a number of secondary particles. However, among
the secondary particles, neutrons and muons reach the ground level
and may be studied by the detectors placed on the surface of the
Earth. The streaming in the ecliptic plane can be recorded by ground
based detectors as a diurnal variation in the counting rate, super
posed on a larger isotropic component. The streaming of primary
cosmic rays responsible for this variation is known as the Solar Diurnal
Anisotropy [1].””
The effect of the towards and away sector of the solar IMF on GCR propogation into Earth’s atmosphere.
“”On the other hand, the streaming perpendicular
to the ecliptic plane in the north–south direction is observed as a
sidereal diurnal variation by the ground based detectors [4]…””
“”..Therefore, a muon telescope observes a maximum counting rate
at 18 h local sidereal time, if the streaming is downward (north–
south) and at 6 h local sidereal time if the streaming is upward
(south–north). Since Gr points radially outward this streaming process
reverses its direction whenever the polarity of the IMF changes.
The region of the heliosphere where the IMF is directed toward the
Sun, is called the Toward or TW sector, and the streaming is downwards
(north–south). Similarly, when the IMF is directed away from
the Sun, it is termed the Away or AW sector and the streaming is
upwards (south–north). Therefore, the muon telescopes located in
the northern hemisphere of the Earth detect a maximum rate at
6 h in the AW sectors and at 18 h in the TW sectors, in local sidereal
time. This streaming as mentioned earlier is referred as the Swinson
flow….””
Finding where the seeding of clouds occurs from the propagation of GCR into Earth’s atmosphere, has its degrees of difficulty.
Question though… if an electric field generates a magnetic field as in the magnetosphere, how does the lower amplitude solar cycle affect Earth’s electric field and magnetosphere?
I am not referring to the magnetic field generated at the dynamo regions. But its outer extension called magnetosphere.
And if the magnetosphere weakens due to a lower amplitude solar cycle, wouldn’t the records also be fluxed up indicating a higher solar value, but in reality a weaker magnetosphere?
Good night
Carla, the data supports a solar/climate connection and that this period of time in the climate is not unique.
Your bias is so strong that you get things wrong.
The GCRs gyrate around the Interplanetary Magnetic Field [IMF], not the Interstellar Magnetic Field.
Sigh.
The current research is as evidenced by this article is in support of a solar climate connection and there are many and all I have to do is be correct on one of them . Just one.
In addition the data shows this to be so.
We will be finding out because I expect my low average solar parameters will be the norm as we move forward (which is needed ) and I expect a global temperature response which will be down in response to this. It has started by the way.
What controls the climate ? The amount of energy coming into the earth versus leaving. The sun controls this through primary and secondary effects.
Solar if extreme enough is going to change the energy balance by influencing the terrestrial items that determine albedo through secondary effects. In addition the slight decrease in solar irradiance a primary effect will add to this along with an increase in MAJOR volcanic activity, another solar secondary effect. All of this will change the energy balance and thus the climate.
The geo magnetic field weakening compounding the solar effects.
The GHG effect I exclude not because it is not real but because shows it follows the temperature does not lead it so the strength of the GHG effect must be in response to the climate rather then the other way around.
Every single prolonged solar minimum has been associated with a global temperature decline to one degree or another overall without exception.
lsvalgaard August 27, 2016 at 6:31 pm
You still do not the difference between the IMF and the IMF. The cosmic rays in the solar susyem gyrate around the IMF not around the IMF, as I said, but which you objected to.
__________________________________________
Cosmic Ray History and its Implications for Galactic Magnetic
Fields
Ellen G. Zweibel1
http://cds.cern.ch/record/598725/files/0212559.pdf
Page 2
The leading theories of cosmic ray acceleration and confinement depend on the strength
of the magnetic field. In this paper we use this dependence to estimate the minimum magnetic
field at which a population of relativistic cosmic rays with energy density comparable
to the present Galactic population can be accelerated and confined. We find that a field
several orders of magnitude weaker than the present Galactic field is sufficent for both acceleration
and confinement, provided that the coherence length of the field exceeds the cosmic
ray gyroradius.
Note that we use the solar magnetic field to constrain the galactic field. Not the other way around. The interstellar magnetic field has no influence on the sun because of the super sine solar wind. Try to get it.
lsvalgaard August 27, 2016 at 7:23 am
Your bias is so strong that you get things wrong.
The GCRs gyrate around the Interplanetary Magnetic Field [IMF], not the Interstellar Magnetic Field.
Sigh.
—————————————————-
“”These particles gyrate around the IMF but the presence of irregularities
in the IMF scatters them away from a regular gyro motion.”””
Doc, I know the difference between the two acronyms:
IMF = Interplanetary Magnetic Field (solar)
ISMF = Intersterlllar Magnetic Field (galactic and other sources in ISM)
GCR are contained by the ISMF if the gyroradius is larger than the magnetic field such as the IMF, then they refer to gyrating around them?
Apparently the GCR are disruptive in the INTERPLANETARY space environment as well as the INTERSTELLAR environment. So also must be disruptive in the planetary atmospheric environment.
Don’t make me copy and paste the disruptions to the magnetic fields here…lol
But I will later, got to get some domestic stuff done.
Gotta leave this teaser though, before I go..
Amplification of magnetic fields
Upstream and downstream of shocks
Cosmic ray driven dynamo
Carla if you have the time tell us why you think the climate changes and how it might change going forward.
I am interested.
Cosmic rays in solar system
By: Tiva Sharifi
Earth Weather
In the lower atmosphere,
*Muons ionize the gas molecules.
*A positive ion is created
*The released electron is captured (creation negative ion or recombination)
*The ionization and recombination effect is balanced
the negative ions are more mobile which results in an electric field (100 V/m).
Thunderstorm
*Separation of positive and negative ions forms an electric field.
*Discharge (lightening) happens if the electric field is high enough.
*Cosmic rays have a direct influence on earth weather
C 14, the most famous cosmogenic radionuclide
*A correlation between solar activity, climate variables (especially temperature) and C activity.
low number of sunspots, higher activity of C 14 and colder climate.
*The weak solar field allows more GCR protons to reach the earth results in the higher content of C 14 .
https://www.google.com/url?sa=t&rct=j&q=&esrc=s&source=web&cd=4&cad=rja&uact=8&ved=0ahUKEwiT6v3-geLOAhXEGh4KHX0FA7oQFgg1MAM&url=http%3A%2F%2Fwww.tp.umu.se%2Fspace%2FProj_10%2FTiva_S-present-10.ppt&usg=AFQjCNEgE1s_CUupkQCLkyQLQfIQY8tVww&bvm=bv.131286987,d.dmo
Me thinks, I need to know more about the effects of GCR on Earth’s electric field and magnetosphere.
ren August 26, 2016 at 3:30 am
The strongest ionization is over the polar circles, and not over the equator.
——————————————-
Yes, I believe that is true due to the magnetic field cutoff. The magnetic fields around the polar regions physically are more vertical allowing unimpeded access at those locations, (open door) for energetic particles. There are also magnetic field null points around the planet. (open door)
Polar regions exibit strong variations in the pressure gradients due to several factors including the one you are usually showing us.
A sub study for someone might be to locate the weaker regions of Earth’s magnetic field, polar regions, null points and anomalies and compare to atmospheric pressure changes in and around those weaker regions
.
Bearing in mind solar wind streams, CME’s or Earth passing through a solar sector crossing of the HCS. Whether the Interplanetary Magnetic Field IMF is orientated towards the sun or away from the sun.
You still do not the difference between the IMF and the IMF. The cosmic rays in the solar susyem gyrate around the IMF not around the IMF, as I said, but which you objected to.
lsvalgaard August 27, 2016 at 6:31 pm
The cosmic rays in the solar susyem gyrate around the IMF not around the IMF, as I said, but which you objected to
—————————————————–
Not if the GCR gyroradius exceeds the field length.
Solar field lengths are puny compared to Galactic fields in LENGTH.
Containment provided that the field length is longer than the gyroradius of a GCR and that depends on energy level of the GCR.
See below…
Cosmic Ray History and its Implications for Galactic Magnetic
Fields
Ellen G. Zweibel1
http://cds.cern.ch/record/598725/files/0212559.pdf
Page 2
provided that the coherence length of the field exceeds the cosmic
ray gyroradius.
There is also reacceleration of GCR locally due to bumps or CIR corotating interaction regions in the heliocurrent sheet. They affect ionization in those regions, mess with magnetic fields too. Regardless of whether it is solar or not. They mess with galactic scale fields and Ol sol well.. toot toot
As for a toward or away solar field, only shifts the location position of incoming GCR within the polar regions of Earth. toot toot again..
It is only fairly recent that we started measuring the higher energy ranges of the GCR so not much history above certain threshold.
provided that the coherence length of the field exceeds the cosmic ray gyroradius.
You have no idea what you are talking about. The gyroradius depends [inversely] on the local magnetic field, so in the solar system [the heliosphere], the cosmic rays are gyrating around the local solar wind magnetic field, not the interstellar field. If the field changes rapidly, the gyration will be erratic and the particle will be accelerated. But this does not change the fact that the path of a cosmic ray within the heliosphere depends on the local [solar] magnetic field and not on the interstellar [galactic field]. As usual: the interstellar field or conditions have no influence whatsoever in side the heliosphere. I am amazed at the willingness with which you deceive yourself. Luckily, the rest of us are [hopefully] not so prone to your self-delusions.
http://hockeyschtick.blogspot.com/2016/08/bombshell-new-study-confirms-solar.html
This is in reference to this article which speaks strongly of a solar climate connection in addition to showing supportive data that being the sunspot integral climate correlation.
On last point which is the weakening geo magnetic field will compound this.
this is an old argument…..
what came first: the chicken or the egg
all cooling as observed by myself,
currently at ca. -0.015K/annum,
is apparently working its way from the higher latitudes down to the lower latitudes,
but it does that by forming more clouds…
namely, as the T differential between the equator and poles are rising, you will get more condensation at the lower latitudes. The lower latitudes receive comparatively much more radiation per m2 , hence the initial cooling effect is now amplified by the increase in cloud cover at the lower latitudes….
a natural consequence of all this is that there will be [somewhat] less moisture available to make clouds at the higher latitudes.
hence I predict a 1930’s type of drought for the great plains of America in a few years from now…..
to prove the point that this is indeed what is happening:
“A Weather Cycle as observed in the Nile Flood cycle, Max rain followed by Min rain, appears discernible with maximums at 1750, 1860, 1950 and minimums at 1670, 1800, 1900 and a minimum at 1990 predicted. The range in meters between a plentiful flood and a drought flood seems minor in the numbers but real in consequence….” end quote
[the quote is from Arnold’s paper in 1985 just before they started with the CO2 nonsense. The 1990 turned out to be 1995, as calculated from my results]
Still intriguing to me is the NASA study showing correlation between Nile River levels and aurorae boreales. Riddle me that one.
===============
Hi Kim
All I understand from nuclear fusion [on earth] is that they still battle to contain the energy…
apparently they cannot create a magnetic field strong enough to contain the explosion of energy.
It therefore makes sense to me to believe that the lower solar polar magnetic field strengths mean that more of the most energetic particles can escape from the sun forming said aurorae
[and also more ozone, peroxides and N-oxides – this is how your life is protected against the [current] very horrific sun.
Hence, earth is cooling when the sun “hots” up.
Would ‘arrive from the sun’ be more apt? You broach, for me, new thoughts on albedo.
=============
you could say: arrive from the sun
contrary to what Pam has said, in climate science: don’t trust anyone but yourself.
I even don’t trust the satellite data anymore [what versions are we on now?], as I think there is no detection material on earth that can withstand the sun’s most energetic particles [if not protected by an atmosphere]
I am sure you will find a steadily increasing albedo from 1995 onward but information on this is scarce. The latest data I saw only went up to 2007 and I am sure it was here on WUWT that I read about it.
let me know if you find anything out about that
Iooked again
found this report
http://phys.org/news/2016-05-variability-earth-years.html
note the upward trend since 2010
read the report and note that it mentions my concerns of nothing staying unchanged in space in the burning sun
so they already doubt their own data….
our best bet to finding a guide on cooling or warming is the ice…..
total ice NH and SH will be my standard
Start with the Sun
And move on out….
Space Station #5
Sammy Hagar (Montrose)
“The eruptions cause a reduction in cloud fraction of about 2 percent corresponding to roughly a billion tonnes of liquid water disappearing from the atmosphere.” Does this mean that the water leaves in the form of precipitation? If so, then there should be a measurable downstream (sic!) effect of rainfall correlating with solar activity.
heh, de Nile.
=========
Hallo Jan
ja, actually we do have more rainfall in Africa at the time of lower solar activity
https://wattsupwiththat.com/2016/08/25/svensmark-publishes-solar-activity-has-a-direct-impact-on-earths-cloud-cover/#comment-2287305
Upon reading the paper, the curious part to me was this.
They claimed to see a change in cloud water vapor from the Forbush Decreases (FDs). They list 26 of these, and give their intensity as a percentage of the change in ions from solar max to solar min. Here’s the curious part.
There is only one FD which is larger than the sunspot-related change from solar max to min. All the other FDs are smaller, with an average over all of them of 53% of the swing due to the ~11-year sunspot cycle.
So they’re trying to convince me that they can see a signal HALF THE SIZE of the solar sunspot-related signal in the clouds … but they cannot see a signal of twice that size?
Sorry, not buying it. If a signal half the size of the sunspot signal is detectable, surely a sunspot signal should be detectable. For example, they claim that the FDs make a significant change in aerosols. But since the sunspot signal is twice that size, we should see twice that change over an 11-year sunspot cycle … but as far as I know, we don’t.
w.
Take the time. These Furbeash are brief.
============
A pulse much more easily seen than a slow roll. Look, I’m not arguing we can see anything useful in the atmosphere. Willie Sutton goes to sea or was it he? Please, look in the oceans for the answers.
==============
you must look at the oceans, to find currents and flows and earthly forces [such as the turning of the iron core] that cause cycling on its own
but whichever way you look at it
at the end of the day it is the amount of energy coming through the atmosphere that heats the oceans…
here is the paradox
=> lower solar field strengths
=> more of the most energetic particles leaving the sun
=> more ozone, peroxides, N-oxides formed TOA
=> more UV deflected to space
=> less UV in the oceans
Oh, yeah. The quote from Hockeyschtick:
I’m sorry, but the “time integral” of any string of data depends on a tunable parameter, which is the zero point. By simply picking different zero points you can use the exact same data to show either an increase or a decrease.
This renders the claim that the integral “shows a significant increase in accumulated solar energy” totally meaningless. Using a different zero point, you could use the same data to show a significant decrease in solar energy.
As a result, the trend of the “time integral” is meaningless. Not slightly wrong. Not fixably wrong. Meaningless.
w.
The longer a hotter than average sun shines on the surface of the earth, the warmer will the average temperature be, compared to less radiation for less time. And even more so if there are fewer clouds blocking the incoming radiation, but more water vapor slowing the outgoing radiation.
Wrong Wilis.
Salvatore, thank you for your usual penetrating, insightful, and well researched and documented analysis of my purported errors …
w.
He just said you’re wrong! (scratches chin and busts out laughing) thanks Willis there’s beer everywhere now. I’m sick of this sht lol 😛
In a natural, teleconnected, multi-variable climate system composed of multiple dependent and independent relationships, confounding variables are at every corner. Most amateur climate investigators looking for a cause de jour, do not control for confounding variables in their conjecture. Some even throw them in yet propose that some other variable in the string is their pet cause, such as with those that use ocean parameters in addition to solar parameters. Why? Because ocean parameters go along way in making their prediction come true. The dead giveaway is when the conjecture includes something little causing something big by way of an ill-defined amplification device. Buyers beware.
Sure, amplification without runaway is a key, but look at the power of the ocean to amplify and the power of the oscillations to damp. Ill defined? Sure. Seller’s aware.
=============
Many clear-cut relationships appear meaningless to those who fail to grasp the abstract aspects of mathematics.
Salvatore Del Prete August 27, 2016 at 9:31 am
Carla if you have the time tell us why you think the climate changes and how it might change going forward.
I am interested
——————————————————————
You have a list of contributing factors SDP.
I don’t disagree completely with those.
So many contributing variables as to why the climate changes.
I do think any rise in any gas or energetic particles for whatever reason has an effect on heating and or cooling.
Like Pamela says, oceans are heat sinks or something like that. In ocean warming, undersea volcanoes, earthquakes, tectonic motions and giant black smokers are under rated as to their contribution to Ocean heat.
Earth Rotation speed in circulation processes including escaping heat to higher altitudes and out to space, tectonic motion, forward and back.
Hemispheric Polar vortex strength in downwelling cold, and its effect on driving cold air out of its respective hemisphere, pushing warmer air up into the opposite hemisphere. Northern hemisphere winter pushing colder air down and pushing warmer air even further southward.
Opposite for Southern hemisphere winter.
See example of the north ward extent of warmer air and what has contributed to driving it northward
https://earth.nullschool.net/#current/wind/isobaric/250hPa/overlay=temp/equirectangular=-97.54,-1.15,256/loc=-90.530,-0.357
Solar wind speed and density. CME’s, solar wind streams from coronal holes, heliocurrent sheet crossings anything that injects heated particles into the system, which inflates the atmosphere.
Fewer and fewer of the above solar particle injections mean more and more lowering of the Earth’s upper atmosphere. Radiation belt variations and its proximity to Earth at the equator.
Changes to Earth’s Ionospheric dynamo, electric field, equatorial electro jets EEJ, counter EEJ and magnetosphere.
Increasing and decreasing GCR effects on electric fields, generation of lightening, ionization rates and CCN cloud condensation nuclei..
And more that affects climate.
Location location location in the galaxy. Not going there today.
Prediction for the future.
More heat escape and dissipation of long term akkumulated heat in Earth’s atmosphere and Oceans, if
the solar cycle stays as is or declines further.
Increase in GCR and further shrinking of the heliosphere if solar output declines further.
Heliospheric northern hemisphere anomaly (more shrinkage and GCR penetration north) if the Northern solar polar field remains lower than the southern solar polar field.
Heliospheric reconnection occuring on the interstellar downwind side, in the heliotail of the solar system and Dr. S., will have to eat his hat. lol (refer to particle enhance of focusing cone.)
Planet will cool but we wont see an ice age. (from the original Linsky report on “Cloud Tripping the Milkyway”)
Might have left a few things out.
Spotted a new article on the Radiation Belts.
Bring it on in a minute or two or….
It is visible in the the zone Jetstream significant amount of ozone. This is a direct connection to the stratosphere and the troposphere above the polar circles.
http://www.ospo.noaa.gov/data/mirs/mirs_images/n19_temp_200mb_asc.png
Excellent and you do know what you are talking about.
Abstract
In this work we study links between low cloud anomalies (LCA) at middle latitudes of the Northern and Southern hemispheres and galactic cosmic ray (GCR) variations used as a proxy of solar variability on the decadal time scale. It was shown that these links are not direct, but realized through GCR/solar activity phenomena influence on the development of extratropical baric systems (cyclones and troughs) which form cloud field. The violation of a positive correlation between LCA and GCR intensity which was observed in the 1980s–1990s occurred simultaneously in the Northern and Southern hemispheres in the early 2000s and coincided with the sign reversal of GCR effects on troposphere circulation. It was suggested that a possible reason for the correlation reversal between cyclonic activity at middle latitudes and GCR fluxes is the change of the stratospheric polar vortex intensity which influences significantly the troposphere-stratosphere coupling. The evidences for a noticeable weakening of the polar vortices in the Arctic and Antarctic stratosphere in the early 2000s are provided. The results obtained suggest an important role of the polar vortex evolution as a reason for a temporal variability of solar activity effects on the lower atmosphere.
http://www.sciencedirect.com/science/article/pii/S1364682616300979
Hi Ren,
Seems that our thoughts about the polar regions being preferred locations for GCR entry has a glitch.
Note the comparison below between Pole and California for increases in GCR.
Cosmic Rays are Intensifying
For the past year, neutron monitors around the Arctic Circle have sensed an increasing intensity of cosmic rays. Polar latitudes are a good place to make such measurements, because Earth’s magnetic field funnels and concentrates cosmic radiation there. Turns out, Earth’s poles aren’t the only place cosmic rays are intensifying. Spaceweather.com and the students of Earth to Sky Calculus have been launching helium balloons to the stratosphere to measure radiation, and they find the same trend over California:
http://spaceweather.com/images2016/27jan16/cosmicrays_mar15_jan16.png?
In the plot, neutron monitor measurements from the University of Oulu Cosmic Ray Station are traced in red; gamma-ray/X-ray measurements over California are denoted in gray. The agreement between the two curves is remarkable. It means that the intensification of cosmic rays is making itself felt not only over the poles, but also over lower latitudes where Earth’s magnetic field provides a greater degree of protection against deep space radiation.
Cosmic rays, which are accelerated toward Earth by distant supernova explosions and other violent events, are an important form of space weather. They can seed clouds, trigger lightning, and penetrate commercial airplanes.
———————————————————————————————————————
Updated: Aug. 27, 2016 // Next Flight: Sept. 2, 2016
Approximately once a week, Spaceweather.com and the students of Earth to Sky Calculus fly space weather balloons to the stratosphere over California. These balloons are equipped with radiation sensors that detect cosmic rays, a surprisingly “down to Earth” form of space weather. Cosmic rays can seed clouds, trigger lightning, and penetrate commercial airplanes. Our latest measurements show that cosmic rays are intensifying, with an increase of almost 13% since 2105:
http://www.spaceweather.com/cosmicrays/stratosphere_14aug16.png?
Why are cosmic rays increasing? The main reason is the sun. Solar activity helps push deep space cosmic rays out of the solar system. Lately, however, solar activity has been low. More cosmic rays have been able to penetrate the inner solar system. As the current solar cycle ebbs, we can expect cosmic rays to continue intensifying for years to come.
http://www.spaceweather.com/
Aug. 15, 2016
NASA’s Van Allen Probes Catch Rare Glimpse of Supercharged Radiation Belt
http://www.nasa.gov/feature/goddard/2016/nasas-van-allen-probes-catch-rare-glimpse-of-supercharged-radiation-belt
…”””welling and shrinking in response to such events and solar radiation, the Van Allen belts are highly dynamic structures within our planet’s magnetosphere. Sometimes, changing conditions in near-Earth space can energize electrons in these ever-changing regions. Scientists don’t yet know whether energization events driven by interplanetary shocks are common. Regardless, the effects of interplanetary shocks are highly localized events – meaning if a spacecraft is not precisely in the right place when a shock hits, it won’t register the event at all. In this case, only one of the Van Allen Probes was in the proper position, deep within the magnetosphere – but it was able to send back key information.
GIF of accelerated electrons circulating in the Van Allen Radiation Belts
Artist concept of accelerated electrons circulating in Earth’s Van Allen radiation belts.
Credits: NASA’s Goddard Space Flight Center; Tom Bridgman, animator
The spacecraft measured a sudden pulse of electrons energized to extreme speeds – nearly as fast as the speed of light – as the shock slammed the outer radiation belt. This population of electrons was short-lived, and their energy dissipated within minutes. But five days later, long after other processes from the storm had died down, the Van Allen Probes detected an increased number of even higher energy electrons. Such an increase so much later is a testament to the unique energization processes following the storm.
“The shock injected – meaning it pushed – electrons from outer regions of the magnetosphere deep inside the belt, and in that process, the electrons gained energy,” said Shri Kanekal, the deputy mission scientist for the Van Allen Probes at Goddard and the leading author of a paper on these results.”””…
…”””Additionally, the degree of electron energization depends on the process that energizes them. One can liken the process of shock acceleration, as observed by the Van Allen Probe, to pushing a swing.
“Think of ‘pushing’ as the phenomenon that’s increasing the energy,” Kanekal said. “The more you push a swing, the higher it goes.” And the faster electrons will move after a shock.
In this case, those extra pushes likely led to the second peak in high-energy electrons. While electromagnetic waves from the shock lingered in the magnetosphere, they continued to raise the electrons’ energy. The stronger the storm, the longer such waves persist. Following the March 2015 storm, resulting electromagnetic waves lasted several days. The result: a peak in electron energy measured by the Van Allen Probe five days later.”””…
Question???
Sunspots have a preferred location on the solar surface, Hale boundary is it Dr. S.? Near the equator and near the Hale Boundary?
Does the preferred location on solar surface also prefer being on the downwind side (heliotail side) when sunspots begin forming?
The downwind/upwind situation has nothing to do with solar activity, because of the supersonic solar wind.
You willful ignorance is a sad reflection of the state of lack of scientific literacy
[Regrettably, but trimmed nonetheless. .mod]
Ignorance! just saying
Sparks August 28, 2016 at 8:43 p____________
This buds for you
“””Id love to spit some beechnut in that dudes eye.. “””
“””Cause were those ol boys raised on shot gun…”””
https://youtu.be/3cQNkIrg-Tk
Willful ignorance is a non sequitur. If ignorance is present it cannot be willful.
You just gave a good example of it. Not wanting to see the truth…
It could have been arbitrary.
Safe space and trigger warnings needed?? hahaha
Leif,
“You just gave a good example of it. Not wanting to see the truth…” Back at you. As Pontius Pilate said, what is “truth”? Willful offensiveness, however, is possible and quite common.
One always have to be on the offensive when confronted with people not wanted to see the truth or consider the evidence or simply nitpicking.
It is more challenging to show someone how stupid they are in a kind and gentle manner. Like I do.
They often don’t get it no matter how kind you are.
With this, I will agree.
Carla is a perfect example of this. See e.g. her latest comment.
And these people are not stupid. Often they are extremely clever, yet still as wrong as can be. The phenomenon is sometimes described as pathological science [ http://www.columbia.edu/cu/21stC/issue-3.4/turro.html ]. The lack of trying one’s best to find faults in one’s belief or trying to falsify one’s interpretation is a telling characteristic of this type of thinking. There are several [well-known] characters on this blog falling in this category. No amount of education, explanation, or guidance will change their self-delusion, regardless of how gentle or kind you are [rather the opposite, I’m afraid].
This gives evidence that we human beings are within our technological capability to control the earths water cycle through atmospheric ionization and one day end floods and droughts.
/sarcasm
Sparks August 29, 2016 at 1:31 pm
Safe space and trigger warnings needed?? hahaha
———————————————–
Chew on this for awhile Sparks.
Galactic Cosmic Rays come in a wide spectrum of energy levels.
kilo, mega, giga, tera, peta, exa, zetta and yotta.
In regions of interstellar space where two interstellar clouds are colliding the GCR also plays a role.
And if you think that they could not have an effect inside the heliosphere, read on.
At higher energy levels they are a major driver of astrophysical processes.
Cosmic ray propagation and interactions in the Galaxy
V.N.Zirakashvili
Nuclear Physics B Proceedings Supplement 00 (2014) 1–6
4. Galactic wind driven by cosmic rays
CR influence on the Galaxy is not reduced to generation of Alfvenic turbulence.
CR energy density is ´comparable with the gas and magnetic energy densities
in the Galactic disk. It is expected that the propagation region of CRs is significantly
broader than the Galactic disk. If so the dynamical effects of CRs will be stronger
in the Galactic halo where gas density and pressure are lower. It is possible
that CR pressure gradient drives outflow from the Galactic disk and
from the Galaxy – a so called Galactic wind [24, 25, 26, 27].
The expected geometry of the wind flow is shown in Fig.2. Galactic
wind flows along the surface S . The frozen magnetic field B is tangent to this surface.
At large distances from the Galaxy the field is almost azimuthal due to rotation
of the Galaxy. This azimuthal configuration results in the better confinement of
high-energy cosmic rays.
For illustration we show the results of the Galactic wind calculations [30] in Fig.3.
The damping of Alfven´ waves produced by CR streaming instability results in
the strong gas heating in the Galactic halo. At low heights this heating is balanced
by radiative cooling of the gas. However at large heights the gas number density
is low and the cooling is not effective.
As a result the gas temperature is of the order of one million degrees
at large heights. It is interesting that such a halo of the hot gas with a similar
density profile is indeed observed now via measurements of OVII line absorption
[28].
Damping of Alfven waves = gas heating
Large heights= hotter temperatures
Where else do we find this..
By the way, here is the firing order spark.
1 warning 2 left shoulder 3 right shoulder 4 complete the triangle
@Ulric
Any comment from you on this?
http://oi64.tinypic.com/5yxjyu.jpg
Turns out, Earth’s poles aren’t the only place cosmic rays are intensifying. Spaceweather.com and the students of Earth to Sky Calculus have been launching helium balloons to the stratosphere to measure radiation, and they find the same trend over California:
http://spaceweather.com/images2016/27jan16/cosmicrays_mar15_jan16.png
In the plot, neutron monitor measurements from the University of Oulu Cosmic Ray Station are traced in red; gamma-ray/X-ray measurements over California are denoted in gray. The agreement between the two curves is remarkable. It means that the intensification of cosmic rays is making itself felt not only over the poles, but also over lower latitudes where Earth’s magnetic field provides a greater degree of protection against deep space radiation.
And no one finds this peculiar in any way, concerning propagation of GCR and magnetic fields?
Hi Carla
I do want to point to the fact that this corresponds with the sun being VERY quiet during same period
And no one finds this peculiar in any way, concerning propagation of GCR and magnetic fields?
No, this is well-understood and not peculiar in any way.
Thanks to the Moderator that deleted Sparks post,
Sparks August 28, 2016 at 8:43 pm.
The thought of him holding me down, so that so and so could slap my ass was not well received on my end.
Carla, I apologize that this happened, some people have no filter, however, “Sparks” has been added to the WUWT filter, and he won’t be able to make such crass and ugly statements here again.
Thanks Anthony.
lsvalgaard August 30, 2016 at 7:59 am
And no one finds this peculiar in any way, concerning propagation of GCR and magnetic fields?
No, this is well-understood and not peculiar in any way
————————————————-
We expect more GCR penetration over the polar regions due to magnetic field cut off rigidity and vertical profile of the field in those regions. We expect more penetration of GCR over the S. Atlantic Anomaly and in magnetic field null point regions.
If it is not the energy range of the GCR, how can the penetration be equal at lower latitudes where the Earth’s magnetic field is stronger?
http://spaceweather.com/images2016/27jan16/cosmicrays_mar15_jan16.png
Carla,
I’m totally confused by why Earth’s magnetism is a point of discussion. The mechanics of the process as I understand it are:
GCRs from other stars / galaxies multiple light years away and are continuously headed towards our solar system. Many on those are aimed near the sun and left to their own momentum will go through the plane of the inner planets. But most GCRs are high speed charged particles / atomic nuclei. As those charged particles start to interact with the sun’s magnetic field (out past Pluto) their path starts to bend them away from the sun. (Standard physics of moving electric charges in a magnetic field).
When the sun in inactive, like now, the magnetic field at the distance of the outer planets (and beyond) is weak and the GCRs maintain momentum/course and some hit the earth.
When the sun is active, like in the middle of the 11-year cycle solar cycle, the GCRs are curved (pushed) away from the sun and less of them come within the range of the inner planets, thus less impact earth. This effect is easily seen in the GCR counters.
Note the scale of the curve is an arc with a radius of 10’s or 100’s of millions of miles.
If you’re proposing something related to earth’s magnetic field, then its news to me and worthy of a bigger explanation than 2 or 3 sentences.
Again, remember these are near lightspeed particles, so that have relativistic momentums. That means it either takes a huge amount of force to affect their path, or a huge amount of distance over which to work.
I have a very hard time believing earth’s magnetic field is strong enough to significantly effect charged particles moving at relativistic speeds.
earth’s magnetic field is strong enough to significantly effect charged particles moving at relativistic speeds.
For one, the Earth’s field is much stronger than the sun’s field. typically by a factor of a million. The curve of the ‘arc’ depends inversely on the field strength, so is a million times smaller near the Earth.
When the sun is active, like in the middle of the 11-year cycle solar cycle, the GCRs are curved (pushed) away from the sun and less of them come within the range of the inner planets, thus less impact earth.
It is not really the activity of the Sun that is the main reason for the modulation of cosmic rays. I showed 40 years ago [ http://www.leif.org/research/HCS-Nature-1976.pdf ] that the geometry of the Heliospheric Current Sheet is the major driver of the modulation:
http://www.leif.org/research/Cosmic-Ray-Modulation.png
See also slide 16 of http://www.leif.org/research/On-Becoming-a-Scientist.pdf
The heliospheric current sheet separates parts of the solar wind with oppositely directed magnetic field. It is that abrupt change of the direction that deflects the cosmic rays.
how can the penetration be equal at lower latitudes where the Earth’s magnetic field is stronger?
It is not. What is equal is the percentage change.
gregfreemyer August 30, 2016 at 9:24 am
..””If you’re proposing something related to earth’s magnetic field, then its news to me and worthy of a bigger explanation than 2 or 3 sentences.””..
——————————————————–
More on the Earth’s magnetic field weakening to follow.
This latest ‘Earth to Sky Calculus’ result, was released over on spaceweather.com yesterday I think.
http://www.spaceweather.com/cosmicrays/stratosphere_14aug16.png
Cosmic rays, which are accelerated toward Earth by distant supernova explosions and other violent events, are an important form of space weather. They can seed clouds, trigger lightning, and penetrate commercial airplanes. Furthermore, there are studies ( #1, #2, #3, #4) linking cosmic rays with cardiac arrhythmias and sudden cardiac death in the general population.
Why are cosmic rays intensifying? The main reason is the sun. Solar storm clouds such as coronal mass ejections (CMEs) sweep aside cosmic rays when they pass by Earth. During Solar Maximum, CMEs are abundant and cosmic rays are held at bay. Now, however, the solar cycle is swinging toward Solar Minimum, allowing cosmic rays to return. Another reason could be the weakening of Earth’s magnetic field, which helps protect us from deep-space radiation.
There’s a new section of our website where you can monitor cosmic rays in the atmosphere………….
My bold above for emphasis.
The main reason is the sun. Solar storm clouds such as coronal mass ejections (CMEs) sweep aside cosmic rays when they pass by Earth. During Solar Maximum, CMEs are abundant and cosmic rays are held at bay.
As I showed four decades ago, although solar stoms do have an effect, the main reason for the solar cycle variation of cosmic rays is not solar storms, but the changing geometry of the magnetic field in the heliosphere. http://www.leif.org/research/Cosmic-Ray-Modulation.png
Given the LHC magnets are 100,000 as powerful as the earth’s field and bend relativistic charged particles on a 4km radius arc, that leads me to assume the relativistic GCRs path curved by earth’s field would be on on 400,000 km radius arc.
Am I close? How far out does the earth’s magnetic field start bending the path of the GCRs?
About where you guessed it, but as the Earth’s field get stronger and stronger as the cosmic ray gets closer and closer, the bending rapidly increases and can become so strong that the particle is reflected away from the Earth. This is all well-known, essentially as described by Stoermer back in 1904 [before cosmic rays were even discovered].
Interesting times.
…””A new study by the European Space Agency’s constellation of Swarm satellites reveals that changes may be happening even faster than previously thought. In this map, blue depicts where Earth’s magnetic field is weak and red shows regions where it is strong:
http://wpc.50e6.edgecastcdn.net/8050E6/mmedia-http/download/public/videos/2016/05/030/orig-1605_030_AR_EN.mp4
Data from Swarm, combined with observations from the CHAMP and Ørsted satellites, show clearly that the field has weakened by about 3.5% at high latitudes over North America, while it has strengthened about 2% over Asia. The region where the field is at its weakest – the South Atlantic Anomaly – has moved steadily westward and weakened further by about 2%. These changes have occured over the relatively brief period between 1999 and mid-2016.
Earth’s magnetic field protects us from solar storms and cosmic rays. Less magnetism means more radiation can penetrate our planet’s atmosphere. Indeed, high altitude balloons launched by Spaceweather.com routinely detect increasing levels of cosmic rays over California. Perhaps the ebbing magnetic field over North America contributes to that trend…”’
http://news.spaceweather.com/earths-magnetic-field-is-changing/
——————————————————-
lsvalgaard August 30, 2016 at 10:50 am
… geometry of the Heliospheric Current Sheet is the major driver of the modulation:
The heliospheric current sheet separates parts of the solar wind with oppositely directed magnetic field. It is that abrupt change of the direction that deflects the cosmic rays.
——————————————————–
I think that there is more happening than that Dr. S., not saying you are wrong, just more stuff going on than that.
There is a range of energy levels involved that we always seem to overlook, too.
Something I have read recently about GCR electric fields and magnetic fields.
See if I can find it.
I think that there is more happening than that Dr. S., not saying you are wrong, just more stuff going on than that.
No, there is nothing else going on. The modulation of cosmic rays is well-understood and is as I have described.