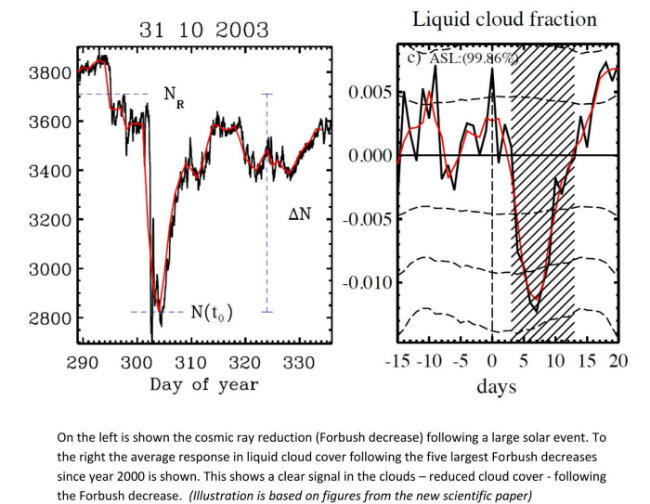
Solar variations affect the abundance of clouds in our atmosphere, a new study lead by DTU Space suggests. Large eruptions on the surface of the Sun can temporarily shield Earth from so-called cosmic rays which now appear to affect cloud formation. A team of scientists from the National Space Institute at the Technical University of Denmark (DTU Space) and the Racah Institute of Physics at the Hebrew University of Jerusalem has linked large solar eruptions to changes in Earth’s cloud cover in a study based on over 25 years of satellite observations.
The solar eruptions are known to shield Earth’s atmosphere from cosmic rays. However the new study, published in Journal of Geophysical Research: Space Physics, shows that the global cloud cover is simultaneously reduced, supporting the idea that cosmic rays are important for cloud formation. The eruptions cause a reduction in cloud fraction of about 2 percent corresponding to roughly a billion tonnes of liquid water disappearing from the atmosphere.
Since clouds are known to affect global temperatures on longer timescales, the present investigation represents an important step in the understanding of clouds and climate variability.
”Earth is under constant bombardment by particles from space called galactic cosmic rays. Violent eruptions at the Sun’s surface can blow these cosmic rays away from Earth for about a week. Our study has shown that when the cosmic rays are reduced in this way there is a corresponding reduction in Earth’s cloud cover. Since clouds are an important factor in controlling the temperature on Earth our results may have implications for climate change“, explains lead author on the study Jacob Svensmark of DTU.
Very energetic particles
“Since clouds are an important factor in controlling the temperature on Earth our results may have implications for climate change”
Galactic cosmic rays are very energetic particles originating mainly from super novae.
These particles generate electrically charged molecules – ions – in Earth’s atmosphere. Ions have been shown in the laboratory to enhance the formation of aerosols, which can serve as seeds for the formation of the cloud drops that make up a cloud. Whether this actually happens in the atmosphere, or only in the laboratory is a topic that has been investigated and debated for years.
When the large solar eruptions blow away the galactic cosmic rays before they reach Earth they cause a reduction in atmospheric ions of up to about 20 to -30 percent over the course of a week. So if ions affect cloud formation it should be possible to observe a decrease in cloud cover during events when the Sun blows away cosmic rays, and this is precisely what is done in this study.
The so-called ‘Forbush decreases’ of the cosmic rays have previously been linked to week-long changes in Earth’s cloud cover but the effect has been debated at length in the scientific literature.
The new study concludes that “there is a real impact of Forbush decreases on cloud microphysics” and that the results support the suggestion that “ions play a significant role in the life-cycle of clouds”.
Arriving at that conclusion was, however, a hard endeavor; Very few strong Forbush decreases occur and their effect on cloud formation is expected to be close to the limit of detection using global atmospheric observations measured by satellites and land based stations. Therefore it was of the greatest importance to select the strongest events for study since they had to have the most easily detected effect. Determining this strength required combining data from about 130 stations in combination with atmospheric modeling.
This new method resulted in a list of 26 events in the period of 1987-2007 ranked according to ionization. This ranked list was important for the detection of a signal, and may also shed some light on why previous studies have arrived at varied conclusions, since they have relied on events that were not necessarily ranked high on the list.
Possible long term effect
The effect from Forbush decreases on clouds is too brief to have any impact on long-term temperature changes.
However since clouds are affected by short term changes in galactic cosmic radiation, they may well also be affected by the slower change in Solar activity that happens on scales from tens to hundreds of years, and thus play a role in the radiation budget that determines the global temperature.
The Suns contribution to past and future climate change may thus be larger than merely the direct changes in radiation, concludes the scientists behind the new study.
Source: http://www.dtu.dk/english/News/Nyhed?id=b759b038-66d3-4328-bbdc-0b0a82371446
The full reference to the new paper is: J. Svensmark, M. B. Enghoff, N. J. Shaviv, and H. Svensmark, “The response of clouds and aerosols to cosmic ray decreases”, Journal of Geophysical Research – Space Physics, 2016, DOI: 10.1002/2016JA022689.
Click here or here to access the abstract and full scientific paper.
Related: (via the Hockey Schtick)
Solar physicist Dr. Leif Svalgaard has revised his reconstruction of sunspot observations over the past 400 years from 1611-2013. Plotting the “time integral” of sunspot numbers from Dr. Svalgaard’s data shows a significant increase in accumulated solar energy beginning during the 1700’s and continuing through and after the end of the Little Ice Age in ~1850. After a ~30 year hiatus, accumulated solar energy resumes a “hockey stick” rise for the remainder of the 20th century, followed by a decline beginning in 2004, all of which show remarkable correspondence to the HADCRU3 global temperature record:

“The most obvious way for warming to be caused naturally is for small, natural fluctuations in the circulation patterns of the atmosphere and ocean to result in a 1% or 2% decrease in global cloud cover. Clouds are the Earth’s sunshade, and if cloud cover changes for any reason, you have global warming — or global cooling.”
Wasn’t moshe crowing about his looking at the last Forbush Event. I wonder what he said then.
===============
They used ISCCP, which classifies clouds at 3 levels. I used AIRS which gives cloud cover at 26 pressure levels.
For the STRONGEST event ever ,, in 2003.. they found a 2% decrease in Cloud fraction over a couple
days.
Basically.. in 26 years of data they pick the most extreme events — 26 of them.. and the Most impactful
only shows a 2% decrease in CF.
The events I looked at were all after 2004.. so I could also look at CRN data ( temperature and solar irradiance )
I found nothing.
AIRS does go back to 2002, so I could go back and see if the singular event in oct 2003 shows up
Thanks, moshe for the follow-up. I got a safe bet; the effect is subtle. Sidebet on oceanic overturning rather than direct cloud effect for the climatic result.
==============
In a paper describing the experiment at CERN, Kirby showed this Figure [left-hand part]:
http://www.leif.org/research/Kirby-Flaw-GCR-14C.png
It was supposed to show how the cosmic ray flux [blue curve] over the past 2000 years tracks the temperature [the red curve from the 18O changes]. The match looks pretty good, but is totally fake. If the climate responds to the GCR flux it should respond to the ACTUAL flux. The actual flux depends strongly on the geomagnetic field. The right-hand part shows the actual, real GCR flux [red curve] and the flux from which the geomagnetic influence has been removed [to show the pure solar effect]. Using the real, actual flux removes the nice [spurious] correlation.
Leif needs to stop torturing the data to try to make it come out the way he wants it to come out.
This is to the point of ridiculous but it is entertaining but nothing more.
[You’re] wrong Leif on all counts.
You need to stop your unfounded and desperate ravings. If this were my blog you would be banned.
Yes I’m thinking about it, Salvatore has been pretty rude. It think for now we’ll just put his comments to a status of requiring approval.
But it’s not your blog…
(it’s anthony’s…)
Leif’s right-hand graph lacks any time-scale, but still shows strong high-frequency coherence between red and blue curves. Does this imply that the low-frequency coherence evident in the left-hand graph is largely an artifact of the geomagnetic field?
It, obviously cover the same time span as the left-hand part.
Does this imply that the low-frequency coherence evident in the left-hand graph is largely an artifact of the geomagnetic field?
It is an artifact of removing the influence of the geomagnetic field.
some of the high-frequency stuff is due to the influence of climate on the observed GCR flux.
OK, teaching moment; how does climate effect the observed GCR flux?
==========
By changing the atmospheric circulation.
Much gracious.
===========
lsvalgaard August 25, 2016 at 4:42 pm
By changing the atmospheric circulation.
HOW?
Sort of the wrong question. What the question should be is: if the circulation of the atmosphere changes what will be the effect on the observed GCR archives? The residence time for CO2 in the atmosphere and biosphere and oceans is long [perhaps 40-50 years] so to extract the solar signal we need to model the uptake of the reservoirs and that involves assumptions about the movement of air parcels with CO2. For 10Be where the residence time is much shorter [perhaps 2 years] the situation is easier, yet the problem there is that 10Be found in ice cores is not generated there, but at lower latitudes [lot more area down there] and is transported by atmospheric circulation to the polar regions and deposited there. So again, the climate plays a role. It is estimated that more than half of the GCR signal is of climatic origin. This is, of course, a bit controversial, so suffices it to say that there is considerable uncertainty on this issue. We badly need an ice core from Mars [or the Moon].
Hmmm, observed or proxied? Thanks for the further discussion and the admission of controversy.
===========
If the considerable low-frequency coherence is truly “an artifact of removing the influence of the geomagnetic field,” then by analytic logic the geomagnetic field must be unrelated to the climate [del 18O] signal. Yet we’re told here that changes in the atmospheric circulation, certainly an integral part of climate change, effect the observed GCR flux. Inasmuch as spurious coherence is hard to come by in a geophysical setting, this seems a circuitous, not a compelling, explanation.
Svalgaard writes: ” if the circulation of the atmosphere changes …”
Could you describe the change? What in the circulation is changing and in what sense would that influence the GCR archives? Thx
Please go on. This is a sensitive uncertainty.
==========
How do we validate the proxies, uncertain of past climate as we are?
=============
lsvalgaard
August 25, 2016 at 7:30 pm
Unfortunately, a Martian ice core retrieval isn’t in the cards any time soon. Will probably have to await a manned mission, at best in the 2030s.
http://www.cnbc.com/2016/04/02/nasas-bolden-mars-mission-is-closer-than-ever.html
As you probably know, Purdue scientists planned a robotic ice core mission back in the 1970s:
http://www.wired.com/2013/10/mars-polar-ice-sample-return-1977-1978/
G. I don’t see why that robot, updated, isn’t something all parties could get behind, perhaps even a private one. It seems key to me, to settle something important and uncertain.
==============
One has to laugh at those who are in denial of the data which shows in no uncertain terms the connection between solar and climate and the secondary GCR effects upon the climate.
Well done Leif.
“Large eruptions on the surface of the Sun can temporarily shield Earth from so-called cosmic rays which now appear to affect cloud formation.”
The direction of the Suns polarities [-n +s] “shield” Earth from so-called cosmic rays.
Leif speak for yourself . I am simply looking at the data which supports my views and not your views.
Now if future data should show that I am wrong I will accept that fact but for now the data is supporting my assertions. That is the reality for now.
I am simply looking at the data which supports my views
That is called confirmation bias: only looking at what supports your view.
wrong.
[actually, Dr. Svalgaard is correct here about confirmation bias -Anthony]
“Confirmation bias, also called confirmatory bias or myside bias, is the tendency to search for, interpret, favor, and recall information in a way that confirms one’s preexisting beliefs or hypotheses”
https://en.wikipedia.org/wiki/Confirmation_bias
Ain’t that the same definition that applies to you, lsvalgaard?
Study the data and make up your own mind.
I’m in the process of studying some people who have studied the data, lsvalgaard, and I just asked one of them a question ; )
Better stick with the data instead of playing armchair psychologist …
hmm . . I seem to be doing OK, thanks for the tip, though ; )
JK, I don’t think anyone on Earth has searched as hard as Leif has for a sun climate connection. That’s why he subjects himself to the abuse of the unwashed; he’s looking everywhere for one. Now I’ll heave meself out of this upholstery and get me hat.
==================
kim,
Either the potential for conformation bias i relevant to Lief . . or he is not a mere human, if you catch my drift. Therefore, it is hypocrisy for him to flatly accuse another of it, and not answer yes to my question, it seems to me.
If a person with . . problems accepting the potential for their own bias studies things for decades, it might be a futile effort to some extent anyway, I suggest.
Not necessarily, Anthony, not if you misread his meaning . . *I am simply looking at the data . . which supports my views and not your views.*
Readers, please consider carefully.
Salvatore Del Prete writes;
“Leif speak for yourself . I am simply looking at the data which supports my views and not your views.
Now if future data should show that I am wrong I will accept that fact but for now the data is supporting my assertions. That is the reality for now.”
And lsvalgaard generates a snipped quote and reaction to that;
” I am simply looking at the data which supports my views
That is called confirmation bias: only looking at what supports your view.”
….
I suggest a bit of caution is called for . . ’cause that ain’t fair, in my eyes.
You should be looking for information that discredits your findings. Good science is about proving yourself wrong.
Svensmark certainly provides clear evidence for the effect of Forbush events upon cloud cover on the high-frequency time-scales of weather systems. But the claimed “remarkable correspondence to the HADCRU3 global temperature record” of the time-integral of Leif’s SSN series simply doesn’t stand up under cross-spectrum analysis. General lack of coherence at these lower frequencies is evident even to the naked eye.
Yes it does.
Svensmark has provided experimental evidence on the behaviour of ions, nothing else.
And nothing new!
The time integral of solar activity plus ocean oscillations [which are also driven by solar activity] can explain 95% of climate change over the past 400 years.
Exactly that is what the data says.
I’ve got mechanism posted above which might explain the sun-oceanic cycle connection. It proposes a tiny effect from the sun but a long time to entrain the phenomenon in the oceanic basins.
==========
Do the warmer and cooler masses of water moving through the cycles synchronize occasionally with fluctuations in external inputs?
What the warmists here are are in a row about is there is a distinct possibility that there is a chink in their armor that co2 is the main driver for temperatures because there is no natural cause. This clearly shows that there may be a natural explanation for the last centuries temperature increase
On this particular occasion, Leif Svalgaard and Rud Istvan are both wrong. Well, disingenuous at best.
Leif says “the number of such decreases is very small [one per year on average] and each lasts only a few days, so the effect on climate is negligible . Rud says “26 FD events in 16 years, with a statistically weak effect lasting about a week. ~26 weeks out of 16 * 52 = 832. Nothing happening concerning GCR and clouds the other 97% of the time “.
The DTU article says “The effect from Forbush decreases on clouds is too brief to have any impact on long-term temperature changes.“. So for both Leif and Rud to dismiss the findings on the grounds that Forbush Decreases have very little effect on climate is ridiculous : the paper makes no such claim.
So what is going on, and what are the real findings of the paper? The answer is that something more subtle is going on. The key quote is “The Suns contribution to past and future climate change may thus be larger than merely the direct changes in radiation “. All of the “climate” models and all of the IPCC reports recognise no possible solar contribution to global temperature change other than by direct radiation. This Svensmark paper blows them out of the water. The challenge now is to work out just what the solar impact really is. We can be fairly confident that Leif and Rud are reasonably correct in pointing out that there is no measurable climate effect from the 11-year solar cycle. But that is now not good enough. There is clearly the possibility of other solar effects on climate, and it is up to the real scientists to find them or dismiss them.
The task is not easy, because the effects do appear to be quite subtle, and at all times it is necessary to recognise that Earth’s climate is a complex non-linear system. So linear ways of thinking may be inadequate.
I’ll throw in a possible “starter”. Leif dismisses the “integration of sunspot anomaly over time as “nonsensical”. If you try to treat it as a meaningful number, then he is probably right. But it is actually an interesting concept which throws up an interesting pattern – and no matter how you do it, you get to see a correlation with the global temperature over the last century. The integration is simply a way of making solar variations over time more easily visible. The integration itself is probably of little direct value, but the pattern it throws up is very interesting indeed and appears to be very relevant. And there could be a relationship to cloud cover too, thus adding to the possible value of this new Svensmark paper:. See https://www.newscientist.com/article/dn5048-earthshine-fall-heats-global-warming-debate/ New Scientist 27 May 2004 “A new study of earthshine, the sunlight reflected back onto the Moon from our planet, suggests that falling cloud cover could explain the warming of the Earth’s lower atmosphere seen over the last 20 years.“
It looks like the dots are all starting to join up!
the paper makes no such claim
So, let everybody here proclaim that this latest paper does not show a GCR/Climate link, since not even the authors claim that.
The paper clearly show solar /climate links.
Not according to Svensmark
Well, I’ve proposed above a link with the oceanic cycles, a matter of overturning perhaps rather than direct cloud effect.
Very much more subtle than much of what is being discussed here today, which almost seems quibbling.
===========
Leif dismisses the “integration of sunspot anomaly over time as “nonsensical”
It is nonsense because no matter which interval you choose to do the integral over, the integral will always start at zero and end at zero, thus never show any trend.
A new study of earthshine, the sunlight reflected back onto the Moon from our planet, suggests that falling cloud cover could explain the warming of the Earth’s lower atmosphere seen over the last 20 years.
Over the past 20 years [from 2004] solar activity has gone down, GCRs have gone up [which according to Svensmark should mean cooling] nad the Earth has warmed. Just the opposite of the Svensmark claim.
According to my studies solar activity should have had a net warming effect on global temperatures which it most likely did ,although ENSO had the biggest impacts.
over last 20 years to clarify
“Over the past 20 years [from 2004] solar activity has gone down, GCRs have gone up [which according to Svensmark should mean cooling] nad the Earth has warmed. Just the opposite of the Svensmark claim.”
Math is hard ( I’m not sure, but in my gut I feel that “from 2004” is about 12 years at the time of your post.
One thing I’m certain of is that adjustments to the temperature data set during that time have been upward while the changes to data from the 1930’s has been downward.
Is CO2 responsible for all of the periods that were warmer than the present? If not, explain what was..
20 years before 2004 plus the 12 years since.
SC21 & SC22 were two of the 4 biggest solar cycles of the 20th century. During that time period GCRs would then have been relatively low, hence WARMING. SC23 & SC24, on the other hand, were weaker thus GCRs would have been relatively high, hence NO WARMING…
*(granted, correlation does not necessarily mean causation)
Yet there WAS warming.
Thus, it is not “just the opposite of the svenmark claim”…
Svalgaard, ever heard of “the pause”? (good grief)…
The pause which means no cooling…
Right, but i hope you can agree that “warming” is different than “no warming”…
Leif
You said no cooling, what if it is just a part of the climate variation puzzle? I don’t think dr S is saying it is the main driver of climate, what I get is that you can’t just dismiss the sun as a variable in the equation. Yes, he hasn’t provide it is a variable but he I think has established that it is worth more study.
worth more study
The general issue of climate change is always worth more study. The specific Svensmark study smacks a bit of desperation, and we have probably not heard the last of this. When other people looked at FDs they didn’t find any effect. Replication of findings are important.
Leif – your two arguments are incorrect.
1. “It is nonsense because no matter which interval you choose to do the [sunspot] integral over, the integral will always start at zero and end at zero, thus never show any trend.“. Starting and ending at zero is unimportant, it’s the pattern you get between them that is of interest, and the integral is certainly not zero all the way. Consider this: scientists often use de-trended data to observe a pattern, and detrended data never shows any trend.
2. “Over the past 20 years [from 2004] solar activity has gone down, GCRs have gone up [which according to Svensmark should mean cooling] nad the Earth has warmed. Just the opposite of the Svensmark claim.“. I’m afraid your maths is a bit deficient here. Let me illustrate with an example: I turn a gas cooker up full, and place a large pot of cold water on it. I also immediately start slowly turning the cooker down and continue to do so for a considerable length of time yet at all times there is still a fair amount of flame For the entire life of the pot on the cooker, the gas activity is going down yet for the whole of that period the water temperature is going up.
In summary, that’s what the sunspot integral is about. It gives a pattern which represents variations in total solar input over time. You can’t read an absolute amount from it and you can’t read a trend from it because some parameters are unknown, but you can see relative highs and lows. As the example of the pot of water shows, the integral is a better way of looking at solar input than just sunspot nunber or TSI, because it is likely to bear a closer relationship to actual temperature.
In summary, that’s what the sunspot integral is about. It gives a pattern which represents variations in total solar input over time
The ordinary sunspot number gives an even better pattern. You see, the integral assumes that all that variation is retained, but it is not. What comes in must go out.
The integrals show that the ‘input’ decreased from 1880 to 1950 while in fact solar activity increased during that time:
http://www.leif.org/research/Sunspot-Group-Integrals.png
The red curve shows a decrease form 1790 to 1950, while solar activity actually increased over that time.
The integrals are junk.
Leif – If no variation was retained, you would use ordinary sunspot number. If all variation was retained then you would use an integral. Since land does not retain any variation for any meaningful time, the ordinary sunspot number should give the closer representation for the land. Since the oceans retain a lot of the variation for a reasonable time, an integral should give the closer representation for the oceans. If the oceans are thought to be dominant in global temperature over decade+ timescales, then it makes sense to look at integrals when investigating global temperature. It is still necessary to know what you are looking at, because no-one yet knows what parameters to use for the integral. It is all complicated further by Earth’s climate being complex and non-linear, so no one factor can necessarily be seen in any given set of Earth data.
Junk? I think you are too locked into your ideas. To my mind, “interesting” would be a better term to use, as it demands no commitment either way.
OK, there’s been a lot of discussion about the influence of GCR on Cloud formation… Can I ask what is the influence of GCR on other factors? eg. what happens when GCR’s hit (1) Ocean water particles, (2) Soil, (3) plants…. Anyone with information re’ this perchance?
“Over the past 20 years [from 2004] solar activity has gone down, GCRs have gone up”
But if the response is not time aligned but rather significantly lagged (e.g. by deep water circulation to the poles) then it’s not today’s direct effect that matters but rather what occurred twenty or thirty years ago.
MJ, you have a problem with my math derived from the paper? State it. Else explain the paper fact that the GCR detectible impact is about 3% of the observed time. Fail.
Rud, I have no problem with your maths as such. The problem is with what you applied the maths to. You applied it to the Forbush Decreases, yet the paper said explicitly: ““The effect from Forbush decreases on clouds is too brief to have any impact on long-term temperature changes.“. The point is that the paper’s findings are more subtle, and more finesse is needed to unserstand them and to test them in the real world.
Also another open question/s re’ GCR’s – (A) what change in wavelength/energy state do they undergo when they hit (1) cloud nuclei, (2) Ocean water molecules, (3) solid surfaces such as soil, plants… & then (B), dependent on (A) what happens then? Does remnant energy get re-radiated back out of the “System” (ie. into space) in whatever new form it may have (wavelength/energy state) and if so how much? eg. A major mechanism in Glasshouse/Greenhouse heating is that Sunlight radiation (“White light” containing a certain mix of radiation of different wavelengths) enters through the glass in one form, hits whatever is inside the Glasshouse, is partially absorbed, partially re-radiated, partially reflected depending on the wavelength/energy state, and partially changes state/wavelength (especially including the re-raditation of longer wave Infrared (aka “Heat”) which is trapped inside the system) and only a remnant is reflected back outside the system… Presumably some similar effect operates wrt forms of Radiation other than Sunlight? Would be interested if anyone has any info wrt GCR wrt this??
Despite the name, GCRs are not (electro-magnetic) radiation in nature. They are particles.
Thanks gregfreemyer, much appreciated…. So does the original question apply, wrt what happens when they hit Ocean, soil or other physical objects vs. ionizing atmospheric particles?? Or are the effects (presumably if any) too insignificant to be worth looking at?
My understanding is:
– GCRs are rare, but each particle is very energetic (near the speed of light), thus the need to conduct the CERN CLOUD experiment in conjunction with a particle accelerator.
– The energy density is exceedingly low, so the global incoming energy in insignificant.
– They interact with the upper atmosphere, so very few make it to the surface to interact with water/land.
– Each GCR collision in the upper atmosphere creates multiple byproducts that continue towards the surface at high (relativistic) speeds, those byproducts in turn have further collisions in a cascade effect.
– Some of the collisions kick electrons loose, thus the resulting accelerated atoms are ions rapidly moving towards the surface.
– Svensmark’s hypothesis is those ions act as a catalyst to magnify the effects of small aerosols growing to the point they become CCNs (cloud condensing nuclei) and thus increasing the rate of cloud formation.
-The CERN CLOUD experiment has verified this magnification (10-100x) in a non-sulfuric acid polluted atmosphere. Thus despite Svalgaard’s statements I believe that “GCRs impact climate” is close to proven in the pre-fossil fuel burning era (100’s of millions of years that ended around 1850). (I’ve tried to read all the comments in this post and I’ve seen no informed rebuttal to that statement.)
– The current paper focuses on finding support for Svensmark’s hypothesis in a sulfuric acid polluted atmosphere.
fyi: approx 75 years ago particle accelerators didn’t exist. particle physicists studied GCR collision byproducts in an effort to detect elementary particles other than electrons, neutrons, and protons. They succeeded. I believe they often used balloons to get their experiments higher into the atmosphere.
hardly a very likely scenario
maybe it is the GCR coming from the sun that did it…??
https://wattsupwiththat.com/2016/08/25/svensmark-publishes-solar-activity-has-a-direct-impact-on-earths-cloud-cover/#comment-2287555
My comment contained 90% factual information / well established science from 75 or so years ago plus the latest findings (May 20916) from the CERN CLOUD experiment. No hypothesis. So I have no idea what part of it you consider an unlikely scenario.
see my comment to toncul posted a few minutes ago
unless you can say that my results are not incompatible with GCR / Svensmark theory?
HenryP,
As I’ve noted in several of my comments to this blog post.
The argument MUST be bifurcated. That is the findings to date of the CERN CLOUD experiment.
===
For a non-sulfuric acid polluted atmosphere (ie. pre-industrialization):
CERN’s CLOUD experiment is finding good support for the mechanism Svensmark proposes. None of your posts that I’ve seen address the pre-industrial age, so there can be no conflict.
For the current industrial age with sulfuric acid pollution:
CERN has not yet found a mechanism by which GCRs are significant. Maybe Svensmark (or others) will succeed at showing his hypothesis is relevant to the industrial age, but for now his proposed mechanism is lacking in lab reproducibility as far as I know.
===
This Forbush Decrease correlation paper is interesting for spikes, but as others have said there is no 20th century data to show clouds/climate are affected meaningfully by GCR levels. After all GCR intensity follows the 11-year solar cycle, so satellite measurements of global cloud coverage should have no trouble finding the same cycle. They don’t.
fyi: one of your comments said:
=> lower solar field strengths
=> more of the most energetic particles leaving the sun
GCRs don’t come from the sun (if that is what you’re implying). They are believed to come from exploding stars as I recall.
Dear gregfreemyer – once again, very much appreciated!
The SLAC site used to have a good treatment of GCRs and CCNs, but the thought police took it down.
Now it’s up to college students to conduct actual observational science instead of playing government-funded, politically-motivated computer games:
http://www.jes2s.com/may2014/cosmic_rays.html
JESS, April 2014 Volume 3, Issue 2
Correlation Between the Percent Cloud Cover and the Cosmic Ray Flux
S. Seth Roffé1*, Liza Baskin2, and John Valente2
Student1, Teacher2: Marine Academy of Science and Technology, Highlands, NJ
*Corresponding author: ssroffe@gmail.com
PDF
Abstract
Cosmic rays are constantly bombarding the upper atmosphere, decaying into an array of particles in a shower called the hadronic shower. The very last particle that decays from a cosmic ray is the muon. Cosmic rays can be indirectly detected by using a detector that utilizes scintillator panels and photomultiplier tubes to detect the muons. The purpose of the experiment was to determine a correlation between the amount of cosmic rays detected and the percentage of cloud cover. The amount of cosmic rays detected was divided into five categories: one counter event, two counter events, three counter events, four counter events, and the total amount of muon triggers. Data was taken in Sandy Hook, New Jersey. There was a statistically significant (p < 0.01) positive correlation between one counter event, four counter events, the total amount of muon triggers, and percent cloud cover. There was a statistically significant (p < 0.05) positive correlation between two counter events and three counter events, and percent cloud cover. The findings of this study suggest that there is a relationship between cosmic rays and the climate and thus may affect climate change.
One bright day in the middle of the night,
Two dead boys got up to fight.
Back to back they faced each other,
drew their swords and shot each other.
A deaf policeman heard the noise
and ran to save the two dead boys.
If you don’t believe this lie is true,
ask the blind man, he saw it, too.
Remarkably apt.
=========
Kim, that PB Shelley knew a thing or two about ‘Clouds’ –
I am the daughter of Earth and Water,
And the nursling of the Sky;
I pass through the pores of the ocean and shores;
I change, but I cannot die.
For after the rain when with never a stain
The pavilion of Heaven is bare,
And the winds and sunbeams with their convex gleams
Build up the blue dome of air,
I silently laugh at my own cenotaph,
And out of the caverns of rain,
Like a child from the womb, like a ghost from the tomb,
I arise and unbuild it again.
Heh, I had trouble with the second to last line, and then I thought of a cumulonimbus.
==============
The night was dark and stormy,
The Billy Goat was blind,
He backed into a Barbed Wire Fence
And hurt his…. Never Mind….
Since LSE trend is not determined by values at interval end-points alone, this is a stunning analytic miscomprehension of the behavior of integrated data.
Are you confusing “Integral” with “integrated”?? and I thought all the stupid went home for the night lol
Nope, still here. Explain this please. I’ll try.
==========
Shut up Kim lol
heh, I’ve learned enough for one day. Gotta go hear Roy ‘In Dreams’.
===========
Sparks, Integral has multiple meanings in math.
ie. The integral of 2x is x^2. The integral portion of 3 1/4 sunspots is 3 sunspots. My assumption (like the others) that the first definition is somehow meant, but I totally don’t understand the graph.
For the analytically challenged, here’s an elementary demonstration of the issue:
DATA: 0, 1, 2, 3
Centered DATA: -1.5, -0.5, 0.5, 1.5
Running SUM: -1.5, -2.0 -1.5, 0
Clearly, the integrated, centered data (represented by the running sum) terminates at zero, but has a non-zero trend through the data interval.
Both the PDO and AMO have cycles that are curiously close to the suns 11 year cycle, what more proof does one need that the SUN and it varying magnetic field is a major player in earths climate?
http://woodfortrees.org/plot/sidc-ssn/from:1900/fourier/magnitude/normalise/to:100/plot/esrl-amo/from:1900/fourier/magnitude/normalise/to:100/plot/jisao-pdo/from:1900/fourier/magnitude/normalise/to:100
Many do not believe at looking the data or if they do and the data does not agree with what they think it should be they will then go to any lengths to dismiss the data. This is what we clearly witnessed today.
Try to explain the phase shift on this one…
http://www.woodfortrees.org/graph/esrl-amo/from:1880/mean:13/plot/sidc-ssn/from:1880/normalise
ulriclyons August 25, 2016 at 6:26 pm
Try to explain the phase shift on this one…
http://www.woodfortrees.org/graph/esrl-amo/from:1880/mean:13/plot/sidc-ssn/from:1880/normalise
________________________________
Wow…have you ever checked to see how many volcanoes and tectonic shifts are going on under dare?
But wow what a phase shift..
On another note..
The rise in solar cycle over the last hundred years had a kumulative effect on temperature rise. Been akkumulating for years. We shouldn’t expect the temperature to drop fast over a single low amplitude solar cycle now should we…
Or expect immediate cloud effects.
GCR and clouds still interesting. Have to get back to this. GCR have a Gyro radius around the interstellar magnetic field, an electron volt intensity and a density gradient.
. GCR have a Gyro radius around the interstellar magnetic field
Not when in the Heliosphere or near the Earth, so not relevant for the topic.
Yes, Carla, too many people posting assertions on this site fail to acknowledge the doubtless significant (& just as hard to quantify) role of “phase lag” in many of the processes involved… The complexity of the systems we are trying to understand is so great (as no doubt are the “Unknowns that we don’t even know that we don’t know :-)) that anyone asserting “Black & White” statements immediately raises my internal “Skeptometer”!
“You need to stop your unfounded and desperate ravings. If this were my blog you would be banned”.Maybe time to put Mosh = English lit degree and Leif = ROM ect on the list LOL
I think Leif’s native language isn’t English and he is still able to construct and engage in discussion, Mosh is an alien immigrant from the planet “freezmaballsoff” who wants to assure everyone that we’ll be nice ‘n warm.
You are right about that, but I actually do speak some 7 languages. Among them English for some 65 years… Probably longer than most commenters here.
[The mods bet most of our English writers can misspell your name faster than you can though. 8<) .mod]
Just playing devil’s advocate, but isn’t HADCRUT basically the same spuriously adjusted garbage as GISS and BEST? If so, we constantly rail against them for being unscientific junk, yet we’re okay with them when they seem to agree with GCR impact on cloud formation? I’m sorry, but I don’t think we can have it both ways.
Now if the correlation holds against RSS and UAH, then we might actually have something.
http://www.woodfortrees.org/graph/plot/uah/from:1978/plot/hadcrut4gl/from:1978/scale:0.9/offset:-0.25
“Just playing devil’s advocate, but isn’t HADCRUT basically the same spuriously adjusted garbage as GISS and BEST? If so, we constantly rail against them for being unscientific junk, yet we’re okay with them when they seem to agree with GCR impact on cloud formation? I’m sorry, but I don’t think we can have it both ways.”
I think you hit the nail right on the head. Comparing your data to bastardized NASA and NOAA surface termperature charts is ridiculous. If you get a match, what do you have? Answer: Garbage.
‘I speak some 7 languages’. I know a guy who can speak 10 languages…..but he can’t say an intelligent word in any of them.
You can tell a man by the acquaintances he keeps.You are in good and fitting company it seems.
Scientific Fact!! I’m going to bed good night folks.
Any mention of the type(s) of clouds that are reduced – cirrus, ocean stratus, tropical cumulus, etc? I imagine that the data is too coarse to allow that type of analysis but it’s an important question. Thanks.
[Your] plot doesn’t show what you suggest it shows.
Also, to be correct, you should average the same way both temperature and the other quantity whatever it is.
Also what is important is solar irradiance.
ISR 341.00 W/m^2
Reflected by
Clouds and atmosphere 79.00 W/m^2
Surface 23.00 W/m^2
Net Q/A Into ToT 239.00 W/m^2 (Top of Troposphere, 15 km, 6.8 C/km lapse rate)
Balancing Q/A Out of ToT 239.00 W/m^2
Lapse dT to 15 km 102.00 C
Surface 288.00 K
ToT Temo 186.00 K
U = Q/A / dT
U 2.34
Cloud albedo increases 10%
Clouds and atmosphere 86.90 W/m^2
Surface 23.00 W/m^2
Net Q/A Into ToT 231.10 W/m^2
Balancing Q/A Out of ToT 231.10 W/m^2
dT = Q/A / U
dT 98.63 C
ToT Temp 186.00 K
Surface Temp 284.63 K
Surface Temp Change: -3.37 C
Not esoteric enough?
“The eruptions cause a reduction in cloud fraction of about 2 percent corresponding to roughly a billion tonnes of liquid water disappearing from the atmosphere.”
The water in the atmosphere would not disappear. It would just remain in vapor phase. Something that is invisible can’t disappear.
I believe that’s why it says “liquid water” disappearing. Gaseous water has very different properties in regards to up and down radiation.
I don’t think this paper is meaningless at all.
It “seems” to me that all of the discussion and debate on the blog is treating the GCR/Cloud – Temperature relationship as if there is no OCEAN out there modifying things. A “small” change in clouds may not show up very significantly, if at all with regards to immediate temperature changes that can be plotted in graphs and analyzed in order to generate a statistic, but that does not mean that there is no contribution to ocean heat content, which over time begins to impact longer term temperature trends.
The Forbush events are just the mechanism acting in extreme. Further, there is NO CLAIM that I see that GCRs are “THE only mechanism” .. or even the main mechanism of slight [0.1C changes over 10 years] in “global temperarture”.
Finally, several have made reference to the signal doesn’t rise above the noise. Well, heck, neither do the Temperature Reconstructions. Thus, the comparisons and analyses are “junk” being compared to “junk”!!! For that matter, I don’t believe we can measure …. repeat “measure” the global temperature at a level that reaches any certainty at all. We have several temp products, and they don’t even agree at levels that rise above the noise.
That all said, …. the jury is still out on the impact the sun has on changes in the climate. This paper does not prove it, but there is also no evidence …. claimed or otherwise, that eliminates it from “reality” … only from mathmatical models, witch goes back to comparing “junk” to more “junk”.
Like
Dr. Deanster – I agree re oceans. It is pointless looking for climate signals in surface atmosphere over land, because land does not hold heat. You can see that from inland locations where the temperature can drop 10-20 deg C overnight (and it’s clearly because the land is losing its heat overnight, not because cold air is coming in from somewhere else).
Looking a little further at oceans: Clouds interfere with both inward and outward radiation. Their effect on total net radiation at the ocean surface is about zero, but they decrease the proportion of inward radiation that is SW. My understanding is that SW penetrates quite well into the ocean but LW does not, so the effect of clouds over the ocean is likely to be net cooling. (I’m not sure what the equation at the surface for LW looks like, but I don’t think it invalidates that statement). So on say decadal or higher timescales there is scope for a changing cloud cover to influence global temperature. Jacob Svensmark’s paper now shows us that solar activity can influence cloud cover. The implication is clear. Solar activity may influence climate in other ways than just direct TSI.
IPCC AR5 credits clouds with -20 W/m^2 RF. That’s net cooling.
That’s right, the Oceans temperature is the main climate driver, and the Suns output over long time scales changes the ocean temperature as well as circulation patterns. The last two solar cycles have seen substantially reduced activity and the North Atlantic seems to have responded to this trend. The Southern Oceans however are much larger and have a longer term thermal inertia.
Hmmm…solar enthusiasts seem unruffled by and give a pass to the word “…may…” in the conclusion statement. So would that mean that CO2 proponents who bring forth research that also includes “…may…” in their conclusion will now get a pass as well?
The present study brings nothing new to the table and provides no evidence for their conclusion, only speculation. Yawn.
The word “may” is only allowed when it is convenient for “skeptics.”
Alinsky 101: blame others for that which you do yourself
Looks pretty conclusive to anybody with open eyes.
You and Leif finked out.
How about other sources of cloud seeding?
Like dust?
From the article;
“The eruptions cause a reduction in cloud fraction of about 2 percent corresponding to roughly a billion tonnes of liquid water disappearing from the atmosphere.”
That indicates that cosmic rays are an influence on cloud formation, but not necessarily a large one.
Also from the article;
“The effect from Forbush decreases on clouds is too brief to have any impact on long-term temperature changes.”
Also from the article: “The effect from Forbush decreases on clouds is too brief to have any impact on long-term temperature changes.”
Also known as ‘climate’
True
Yes, the fact remains that total global cloud cover has reduced long term during the satellite data era, whatever the cause, and that must have played a part in the surface temperature trend in the region of the planet where insolation is greatest (mostly oceans) and consequentially the global average surface temperature trend:
http://www.climate4you.com/images/HadCRUT3%20and%20TropicalCloudCoverISCCP.gif
Tropical (15oN-15oS) total cloud cover (green) according to the International Satellite Cloud Climatology Project (ISCCP)
Yes, the fact remains that total global cloud cover has reduced long term during the satellite data era,
As solar activity has decreased and therefore cosmic ray flux has increased, Svensmark’s hypothesis predicts an increase in cloud cover [and a decrease in temperature]. As your graph shows, observations show just the opposite. This, in my book, shows that the hypothesis is a failure.
Understanding clouds, oceanic heat uptake and oceanic circulation in 3D is the key to the understanding of the climate of a water world.
Interesting, Chris… During a period of relatively high solar activity (SC22) clouds decrease. And during a period of relatively low solar activity (SC23) clouds stay constant. It would be interesting to see the data for SC24.
Yup, Richard; someone’s going to put it together. I’ve my eye on Bob.
=========
Or it’s a plot of tropical deforestation.
Leif, that argument of yours is incorrect. See my earlier comment
https://wattsupwiththat.com/2016/08/25/svensmark-publishes-solar-activity-has-a-direct-impact-on-earths-cloud-cover/comment-page-1/#comment-2286685
A true pioneer in science. I emailed Dr Svensmark YEARS ago to turn him on to WUWT and his millions of admirers here. I was graciously surprised to find a lovely and classy reply to my email with his warm apprecialtion towards the crew here @ur momisugly WUWT and especially Mr Watts.
GO TEAM! Here is to blinding us all with SCIENCE!
(Three cheers for the good guys!)
Thank you all so much!
Sincerely,
Your brother always,
Tom
I haven’t made it through all the comments, but I saw no references to Sulfuric Acid?
My understanding of the recent CERN CLOUD experiment is that we need to evaluate GCRs impact on climate in a bifurcated way:
– Previous to sulfuric acid pollution from fossil fuel burning
– 20th century conditions with sulfuric acid pollution from fossil fuel burning.
Without sulfuric acid pollution, and in the absence of GCRs, they have not found a significant source of CCNs and thus a low level of clouds coverage would be expected during low GCR conditions. During high GCR conditions the biogenic vapors are magnified into CCNs 10-100x and thus cloud coverage is significantly increased..] Thus in pre-industrial times climate was likely strongly driven by GCRs.
As I understand it, per the CLOUD experiment results: in the 20th century, the sulfuric acid pollution interacted with the biogenic vapors to generate sufficient CCNs even in the absence of GCRs. Thus in the 20th centruy, GCRs were likely a minor driver of climate at best.
The question I haven’t seen addressed is what is happening with sulfuric acid pollution. Is it dropping sufficiently to make GCRs once again significant to climate?
Is the 21st century pause caused because of drops in sulfuric acid pollution?
Was the 20th century warming driven primarily by sulfuric acid polution and not CO2?
See my comment. There are very large sources of biological ccns. Turpenes, isoprenes, and dimethylsulfide from conifers, nonconifers, and marine alge respectively. Globally much greater than either GCR or SO2.
ristvan,
I think you’re relying on the findings of CERN CLOUD papers “Ion-induced nucleation of pure biogenic particles” and “The role of low-volatility organic compounds in initial particle growth in the atmosphere”
http://www.nature.com/nature/journal/v533/n7604/full/nature17953.html
http://www.nature.com/nature/journal/v533/n7604/full/nature18271.html
Those are also the paper I was talking about.
The first paper studies biogenic vapors in the ABSENCE of sulfuric acid.
The second paper is similar, but it focus on an atmosphere WITH sulfuric acid.
RE: The pre-industrial era without sulfuric acid pollution
The paper “Ion-induced nucleation of pure biogenic particles” references Ions, but it clearly states the ions in question are a related to GCRs, so the paper could have just as easily been titled “GCR–induced nucleation of pure biogenic particles”.
From the abstract:
“Here we present evidence for the formation of aerosol particles from highly oxidized biogenic vapours in the absence of sulfuric acid in a large chamber under atmospheric conditions.”
If that is the only sentence of the abstract you read, then your logic works.
But the end of the abstract says:
“We find that ions from Galactic cosmic rays increase the nucleation rate by one to two orders of magnitude compared with neutral nucleation. Our experimental findings are supported by quantum chemical calculations of the cluster binding energies of representative HOMs. Ion-induced nucleation of pure organic particles constitutes a potentially widespread source of aerosol particles in terrestrial environments with low sulfuric acid pollution.”
So there finding is that in the pre-industrial age when sulfuric acid pollution was non-existent the process went
– Biological sources (including trees) put out biogenic vapors
– GCR induced activity increases their effectiveness at forming aerosols by a factor between 10 and 100.
– The aerosols in turn are the building blocks of clouds
Thus the best experiment related to CCNs (the CERN CLOUD experiment) contradicts your statements. In fact that paper seems to strongly support the Svensmark hypothesis that GCRs affect climate in the pre-industrial era (going back half a billion years to when trees evolved?
RE: The 20th century where sulfuric acid pollution was a reality
The paper “The role of low-volatility organic compounds in initial particle growth in the atmosphere” shows that the CLOUD experimenters varied the density of sulfuric acid and the density of HOMs (organic compounds). They repeated the experiment both with and without GCR induced ions present.
They found that over a range of 4 orders of magnitude, the density of sulfuric acid had no impact. They did find the density of HOMs did impact growth rates of CCNs, and thus the more organic vapors present the more cloud formation should take place.
They found that GCR induced ions had no effect in these experiments with typical 20th century sulfuric acid pollution levels present.
========
Thus my first comment still holds.
Per the CLOUD results the Svensmark hypothesis needs to be evaluated in the absence of sulfuric acid pollution, and in the presence of that pollution.
It seems very likely that Svensmark’s hypothesis will be proven true in the absence of sulfuric acid pollution.
For the 20th century situation where sulfuric acid pollution is present there was no support for Svensmark’s hypothesis.
But in the latest Svensmark paper he find support EXCLUSIVELY in wet clouds. How does that relate to the CLOUD experiment results? Did the test the same situation, or did the CLOUD experiment only address non-wet clouds?
Hoping for knowledgeable answers,
Thanks