A brief summary of the new paper published in Science Direct
Summary by Ralph Ellis
Why do ice ages occur? Surprisingly, even after many decades of paleoclimatic research we simply do not know for sure. Most scientists will agree that ice age cycles have something to do with precession: the slow wobble of the axis of the Earth. The ancient Egyptians and Greeks knew of precession and called it the Great Year, because it gives warm and cool seasons over its approximate 23,000-year cycle. But there is a problem with invoking the Great Year as the regulator of ice ages, because we should really get an interglacial warming every 23,000 years or so. And we don’t – they only happen every fourth or fifth Great Year.
But why should the global climate give a selective response to orbital warming and cooling? (Called ‘forcing’ in the climate trade.) This is one of the great unknowns of modern science. Many suggestions have been made, from interstellar dust blocking sunlight to the weight of the ice sheets depressing the lithosphere and warming the ice. And yet all of these theories share one thing in common – they stretch credulity. The only thing that is certain, is that the science is not settled in this area of climate research.
But a new peer-reviewed theory by independent researcher Ralph Ellis may have unlocked this perennial conundrum of paleoclimatology.*1 And considering the myriad implications that flow from this theory, its mechanism is nevertheless very simple to understand. What we need is a selective feedback system that can act either in concert with or in opposition to, the warming and cooling provided by the ~23,000-year Great Year. At present it is claimed that this feedback agent is CO2, because CO2 is a warming agent and its concentrations do indeed rise and fall with the ice ages. But there is a big problem with this assertion, because when CO2 concentrations reach a minimum in the depths of the ice age, the world warms. And when CO2 concentrations reach a maximum during the warm interglacial period, the world cools. And yet this is the very opposite of what should happen if CO2 was the primary warming feedback agent.
This is where the new theory by Ralph Ellis shifts the paradigm, and the primary character in this new climatic drama is albedo – the reflectivity of the Earth. Obviously polar ice sheets are highly reflective, they have a high albedo, and reflect up to 90% of the incident sunlight during the all-important northern summer. The cooling effect from this high albedo allows the polar ice sheets to slowly grow, year after year, and slowly reflect more and more incident sunlight in the process. And this ice-albedo reflection mechanism is so strong, it can even resist the next Great Summer when northern sunlight (insolation) is once again at a maximum, which is why some Great Summers produce no global warming whatsoever.

But if albedo is so strong that it can shrug off the increased sunlight of a Great Summer, then how does the climate system generate an interglacial warming? The answer is that ice-sheet albedo has a very prominent Achilles heel – dust. If dust gets on ice sheets their albedo is reduced considerably and they can melt very quickly. And surprising as it may seem this is exactly what happens, because every interglacial warming period is preceded by about 10,000 years of intense dust storms. And we know that this dust settles on polar ice-sheets, because the ice-cores taken from Greenland and Antarctica still contain that dust. And in Greenland, the majority of this dust appears to have originated from the Gobi Desert. But rather than being a shifting-sand desert most of the Gobi is currently pastoral steppe grasslands, where the herds of the Mongolian nomads graze. So how and why does this large steppe plateau become a true sand desert?
It has been claimed that desertification at the ice age maximum was caused by a cooling and drying of the climate. But there are many strands of evidence that conflict with this argument, and point towards a cooling of just 3ºc in tropical and extra-tropical regions, combined with only slight reductions in precipitation.*2 And much of the western Gobi was actually much wetter during the glacial maximum era.*3 The answer to this problem is CO2 concentrations, which reduced during the ice ages as the seas cooled and absorbed more atmospheric CO2. They eventually reached as low as 190 ppm, which is dangerously low for much of the world’s plant-life. Most plants suffer severe stress at 190 ppm CO2 and die at 150 ppm, because CO2 is a primary plant-food. And the fact that vegetation was suffering from CO2 starvation during the depths of the ice age was confirmed recently by a study of ancient trees preserved in the La Brea tar pits in southern California.*4
And so now we have the entire ice age forcing and feedback mechanism, laid out and plain for all to see. It begins when a Great Summer turns into a Great Winter, which reduces the sun-strength in the northern hemisphere and allows ice sheets to grow. This is a slow process that takes tens of thousands of years, and appears destined to turn the world into a complete snowball. However, the high albedo polar ice sheets have an Achilles heel – dust. As the ice sheets grow and the seas cool, CO2 also reduces. The concentration finally reaches the critical 190 ppm level where world flora begins to die, especially at higher altitude, and the Gobi steppe-lands turn into a true sand desert. This turns northern China into the equivalent of 1930s Dust Bowl America, and the ensuing dust storms dump thousands of tonnes of dust onto the northern ice sheets each year. And so when the next Great Summer comes along, the dusty polar ice sheets can warm and melt and the next interglacial is born. So CO2 can indeed cause global warming but its effect is much more pronounced at low concentrations, rather than high concentrations.

*1 Academia.edu link:
Modulation of Ice Ages via Precession and Dust-Albedo Feedbacks https://www.academia.edu/20051643/Modulation_of_Ice_Ages_via_Precession_and_Dust-Albedo_Feedbacks
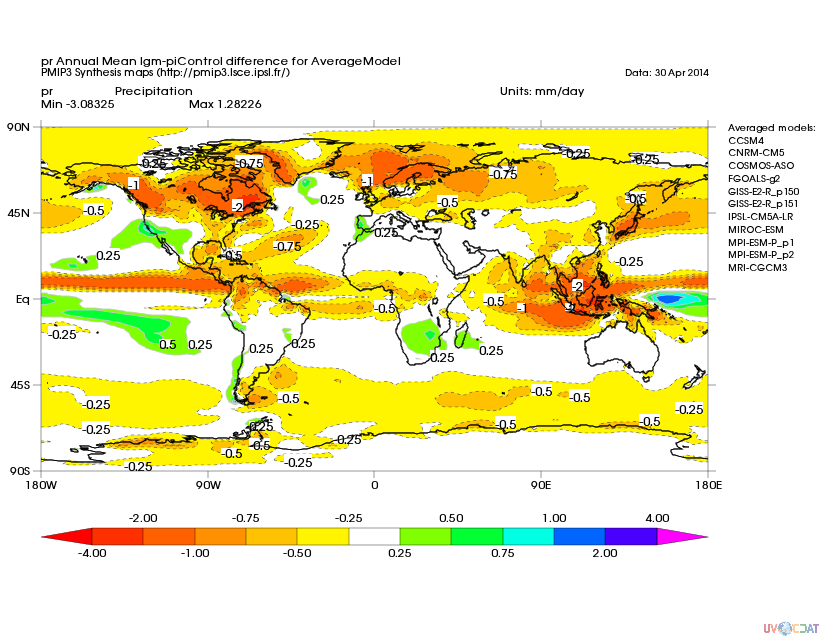
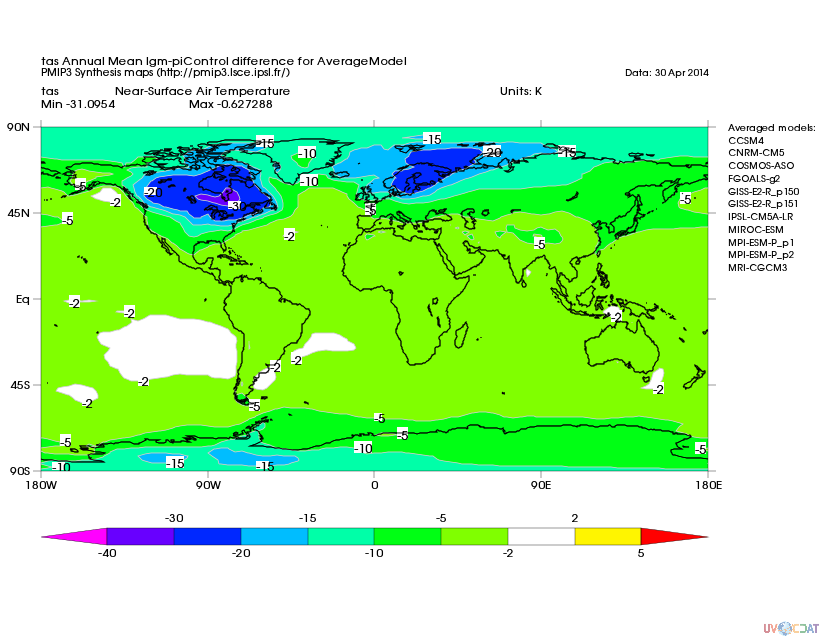
*2 PMIP (2015)
Paleoclimate Modeling Intercomparison Project (PMIP) http://pmip3.lsce.ipsl.fr/
The following map is an average of eleven precipitation models: http://pmip3.lsce.ipsl.fr/share/database/maps/lgm/pr_ann_piControl_diff_lgm_AverageModel.png The following map is an average of eleven temperature models: http://pmip3.lsce.ipsl.fr/share/database/maps/lgm/tas_ann_piControl_diff_lgm_AverageModel.png
*3 Yu, G. Xue, B et al (2003) LGM lake records from China and an analysis of climate dynamics using a modeling approach. Global and Planetary Change 38-3 p223-256 Sept 2003. doi: 10.1016/S0921-8181(02)00257-6
*4 Ward, J. et al (2004) Carbon starvation in glacial trees recovered from the La Brea tar pits in southern California. Well-preserved wood samples from the tar pits date from the Holocene to 55 kyr ago. http://www.pnas.org/content/102/3/690.full
Figs Laskar, J. Joutel, F. Boudin, F. et al (2004)
The Institut de mecanique celeste et de calcul des ephemerides. http://vo.imcce.fr/insola/earth/online/earth/online/index.php
Epica3 data (2007, 2008, 2015):
For Epica3 dating methodology please see:
Parrenin, F. Barnola, J. Beer, J. Blunier, T. Castellano, E. Chappellaz, J. Dreyfus, G. Fischer, H. Fujita, S.
The EDC3 chronology for the Epica Dome C ice core
http://www.clim-past.net/3/485/2007/cp-3-485-2007.pdf
I second the welcoming comments upthread.
“Why do ice ages occur? …we simply do not know for sure.”; well said, and bears repeating. If I may expand: The largest climate variation that our species has experienced is not understood, in the sense that we don’t have all the major pieces of the puzzle. Any claim to full understanding of climate changes of lesser scope is thus ambitious. This paper, in integrating some of the pieces, is a step along the critical-path (whether exactly right or not).
The observed lack of general glaciation in E Siberia and Beringia has always puzzled me. The explanation proposed here of “too dusty” offers a simple, unforced mechanism, so I take that observation as significant supporting evidence.
The Gentle Reader should grasp the timescale here; many of the datapoints in 2nd Fig (this post) are 1 kyr averages (eg ice volume). On the glacial-cycle scale, “a thousand years is but an instant…”, and ocean and atmosphere are both well-mixed. Only features that can persist largely unchanged over several kyr need apply.
One mystery is the periods of rapid and fairly uniform nett land-ice accumulation or melt (see ice-vol in 2nd Fig). These rates are fairly consistent across cycles, with melt-rate about double growth. Identical ice-sheets with identical dust-distributions across cycles is implausible, so while this paper offers a very credible *means* of deglaciation (ie driving force of absorbed insolation), *mechanism* (regulating rate) appears still lacking.
ralfellis and javier upthread divert into a controversy unhelpful because too narrowly focused on the surface. Consider the system: An ice-sheet sub-cooled to -20C with dust distributed in depth. Ice is nearly transparent/translucent to light (recall natural-light images of research under Antarctic sea-ice), and has a thermal conductivity of the order of glass. Blowing warm dry air over this is inefficient (try the experiment, noting that warm wet air is another matter entirely). Surely the key here is *near-surface embedded dust*; this will absorb and trap the Sun’s heat efficiently, first warming the surrounding bulk ice by conduction, then partially melting it, exposing deeper dust…
More on mechanism: The melt rate can be expressed as a persistent nett heat imbalance. My BoE indicates about +4 W-m-2 (5 if I include the sub-cooling). The insolation and albedo values in the paper show that this is relatively minor, and the rate could be (maybe) 10x observed. Why not? There appears to be (yet) another “missing piece”.