Preface
This web page was written in 2016 during the 200th anniversary of the Year without a Summer. It probably has a lot of company, it certainly does with many earlier books and web pages, including my own NH-centric perspective of the events that year. Like most of those other sources, the emphasis is on events. Here, the emphasis is on the weather that spring and summer and how that led to the events described in those other sources.
Tomorrow, 200 years ago, New England was hit by a cold wave that brought two snowstorms and a killing frost that killed much of the young crops.
If you aren’t interested in the full details, the “Executive Summary” is:
- The proximate cause of the cold weather in 1816 is the explosion of Mt Tambora in April 1815. This may have been the largest volcanic explosion in recorded human history and lofted a lot of sulfuric acid aerosols into the stratosphere. However, 1816 is just one of several cold years blamed on volcanoes, solar activity, and other causes.
- There were warm days, even a few hot days. There were even some warm months mixed in with the cold ones, so the result was that the annual average temperature wasn’t very far from average. In this and other cases, small deviations can add up to a major impact on the length of the growing season, number of growing degree days, etc.
- I think the weather pattern was most affected by high latitude cooling and the polar jet stream (the storm track) shifting southward. South of the storm track there was less cooling, but they were still affected by weather systems from the north. There are signs that the jet stream had a “meridional” flow which allows polar air to surge south and tropical air to surge north.The effect of volcanic aerosols is poorly documented, likely because its poorly understood. Pretty much all of the sources talk about the amount of aerosol and the effect on global temperatures. However, I think the effects vary with latitude and that had a major effect on temperatures at different latitudes and the intensity of of various weather events.
- What set 1816 apart from other years were two freeze events. If frosts in June and August hadn’t happened, the harvest would have been very different, and few people would write about the weather of 1816. There was plenty of other cold weather in 1816, so this essay is way too long and needs this executive summary
- A claim that snow or frosts occurred in every month of the year does not hold for parts of New Hampshire in July. There may have been such events in western Connecticut or Massachusetts, or even Virginia, but some descriptions may be exaggerated. It doesn’t affect the outcome of the year, as most everything that made it through July was killed in August.
- 1816 set into motion changes in New Hampshire that probably would have happened later, but traces of them still exist today.
Major Information Sources
The majority of of the information here comes from a wonderfully detailed weather journal kept by William Plumer, mainly about conditions at his farm in Epping NH from 1796 to 1823. After he stopped recording daily data, He tallied 71 pages of totals and averages, and 4 pages of an index with entries from acorns to eclipses, sun spots, and wrens.
Plumer started recording temperatures three times daily on Jan. 13, 1809 at 6:00 AM, 1:00 PM, and 9:00 PM. (See the section on time, below.)
During 1816, Plumer was our governor, so he has several comments from Concord and from travelers and news sources that came to the Governor’s office.
My rendition of Plumer’s journal is from a scan of a microfilmed copy that is quite readable. It is no longer at the NCEI drop box, I’ll put it on my web site.
The NH Historical Society has some miscellaneous information, one that led me to Plumer’s Journal, and also the original of a journal by Adino Brackett, a farmer in Lancaster, in northern NH.
They also have a journal from Sanbornton that I haven’t had time to read.
A recent book, 1816 for short, more formally as The Year without Summer: 1816 and the Volcano that Darkened the World and Changed History was written by father/son and historian/meteorologist Willam K. and Nicholas P. Klingaman. While the book is global in scope, it spends the majority of time focused on New England and Europe, especially Switzerland.
Some of that is due to the information available, but much reflects that those regions were most impacted by the weather that year.
A surprising gem is a 1924 paper by Willis I. Milham of Williams College, Williamstown Mass., published in the journal Monthly Weather Review. The Year 1816 – The Causes of Abnormalities is split into three parts. The first looks at temperature data, especially at Williamstown, and delves into what made 1816 so memorable. It compares the averages from between 1816 and 1838 to 1816 by monthly averages and extremes.
Part 2 explores what may have made 1816 so cold, and also the periods 1812-1817 and 1835-1838. The main culprits considered are volcanic eruptions, notably Tambora, and solar changes coupled to the sunspot cycle.
Part 3 looks at the more general problem of why any month or year is abnormal, ideas considered include the “obvious” volcanoes and sunspots, but stretches to include the solar “constant,” (i.e. the quantity and quality of the ether waves sent), magnetic and electric fields, and charged particles – all topics debated today, except that we no longer rely on luminiferous ether to explain how sunlight reaches Earth. We’ve also gotten away from studying changes in the Solar Constant, but now call it Total Solar Irradiance.
Weather Patterns
In 1816, very little was understood about the low and high pressure systems and the fronts that separate air masses. That wasn’t worked out until after World War I. It wasn’t until World War II that the jet streams were discovered. So for most of the time since 1816, we have not had the concepts needed to describe what drove the weather then.
Don’t assume we know all the answers yet! Of all the factors that drive weather, the one we know least well is the effect of aerosols in general. Volcanic aerosols, specifically sulfuric acid droplets are better understood, but deserve more study, especially with respect to latitude and solar height above the horizon.
The most recent large high-sulfur explosive eruption was Mt Pinatubo in 1991, so we haven’t had a chance to study one in detail for 25 years.
Let’s suppose that aerosols reflect more sunlight passing through the atmosphere than they block the infrared radiation that cools Earth. This makes sense, as the shorter wavelengths of visible light interact better with the relatively large aerosol particles than do long infrared wavelengths. This means that the high sun at low latitudes will have less light scattered than sunlight at high latitudes which comes in at a lower angle.
The Earth’s blackbody radiation can always use the short path through the atmosphere, though it will also use the longer paths, which will scatter some light back to the ground.
In the tropics, the Intratropical Convergence Zone has kept the tropics from warming while the rest of the planet warmed from the late 1970s to the end of the century. It should maintain steady temperatures there in the aftermath of volcanic eruptions.
The cold polar air will be strong enough to push further south than normal, displacing the polar jet stream southward.
In the book 1816, meteorologist Nicholas Klingaman shows evidence that the jet stream often had a meridional flow. This is when the jet stream meanders north and south, which opens paths for both cold air to flow south and warm air to flow north. It also slows down the progression of weather systems as they flow from west to east.
Did all this happen? Possibly, but I don’t think all the reconstructive work that could have been done to create weather maps for then has been done. There are several things in the New Hampshire record that suggests all these patterns were active in 1816, I’ll point some out as we go by.
Time, and time again
William Plumer’s temperature records were logged at 6:00 AM, 1:00 PM, and 9:00 PM each day. That sounds simple enough, and it turns out that several people in that era logged temperature data at those times or close to it.
However, it’s not so simple – time zones and daylight time didn’t exist, so I’ll assume he used “apparent solar time.” This is the time displayed by a typical, well designed and installed sundial. Noon is when the sun appears to be due south. The best sundials include adjustments for the Equation of Time which is the difference between apparent solar time and mean (as in averaged) solar time. The discrepancy comes about due to the tilt of the Earth and the eccentricity of the Earth’s orbit. The US Naval Observatory has a good discussion about these topics. During the summer, the value of the equation of time varies by about +/- 5 minutes, something we can mostly ignore. Daylight time was predated by Standard time and timezones, neither existed in 1816. In simplistic terms, the difference between “mean civil time,” the time we use, and mean solar time is a constant. The “center” of the Eastern US timezone is 75°W longitude. On days when the Equation of Time is zero, noon occurs on that meridian. A time zone is approximately 15° of longitude wide, so every degree east from there noon is four minutes earlier. Epping is close to 71°W longitude, so noon EST is 16 minutes earlier than at the center of the timezone, or 11:45 AM. We’ll want to convert Plumer’s observation times to EDT, so we add an hour to that and get 12:45PM. So, Plumer’s observations times correspond to our 6:45 AM, 1:45 PM, and 9:45 PM.
Monthly Chronologies and New Hampshire Weather Lore
I won’t say too much about about the daily conditions, my web site has web pages that go into more detail about the typical and atypical near coastal NH weather.
The graphics here need a little explanation. The vertical bars give an idea of how the temperature changed during the three records for each day. The blue box usually goes up from the 0645 reading to the 1345 reading, the red box goes down from the 1345 reading to the 2145 reading. The blue line connects the morning measurements and the red line connects the afternoon measurements. Remember these are rarely the low and high temperatures for the day! These show how the temperature trends during the month.
When the bars are short, local weather is often cloudy with an east wind bringing in maritime air from the Atlantic. The temperature is very close to the sea temperature, and varies from cold in the winter to chilly in the summer.
When the morning box starts low and increases more than 15-20 degrees by 1345, we pretty much always have a large high pressure system to our west or over us and light winds led to strong radiational cooling overnight. The low temperature occurs soon after sunrise. Sunlight quickly heats the temperature inversion, then the temperature climbs less quickly as air mixes with the air column.
Finally, the green line is modern data – it’s the average temperature at my home near Concord, computed in a way that was popular with three reading days like we have from Epping. It’s the average of the three temperatures, but with the 2145 reading counted twice. I haven’t plotted the average of the Epping data, but you can deduce that visually by averaging the midpoint of a blue bar and bottom of its pink bar. I’m mostly using the modern data to give you an idea of where the extremely cold and warm periods are.

April was a good example of everything New England can dish out for ordinary weather. A few days near the 60s early in the month were welcome, but came with our familiar roller coaster weather. April 1st featured a thunderstorm, fairly rare for the date, that brought damaging lighting strikes. The 12th brought Plumer six inches of snow. After that the weather settled down for a couple weeks with chilly temperatures but steady warming. The 79 near the end of the month was probably thanks to a high pressure system moving off the coast that allowed air from the southern states to flow north. The next day a mild cold front brought things closer to average.

May should show overall warming. Instead, the 1345 temperature never reached that 79 in late April. Plumer notes “froze water in the night” between his entries for the 14th and 15th. (Sometimes it’s ambiguous which day his overnight notes apply.) Then logs the bit more terse “froze in the night” for the night of the 17th. He logs “frost in the night” on the 24th, 29th, and 30th. Plumer planted new crops between April 11th and May 24th. This seems remarkably early, but I suspect farmers often tempted fate. The cost of an early crop loss is much less than a late one since you get a second chance if you can afford the seed.
Up in Lancaster, Adino Brackett also planted crops early in the month but apparently was following the calendar, writing on May 19th “this is no indication of the state of the season which has been uniformly cold. It has snowed repeatedly this month & almost every day has been foul.” He wrote that during a 3 inch snow storm.
Some interesting weather: The big temperature fall between the 1st and 2nd was from a cold front and NW wind, the cold on the 4th and 5th was from NE and E wind off the Atlantic. The warm day on the 13th was a reprieve from several days of NW wind, then probably a storm that went inland on the 14th, then a return to NW winds for four more days.
The warm day on the 22nd was the end of a four day stretch of SW wind, but clouds and a little rain kept things cool. Then a powerful cold front (the 0645 temperature was the highest of the three) that “recovered” into a three day rain storm with NE winds. This has elements of a meridional jet stream with slow movement of weather systems, but still able to let cold air blow in from the north.
The month ended with another warm day with strong west winds and yet another cold front.

June brought one of the key events of the year. Lesser events include the roller coaster days at the start of the month thanks to NW winds on the 2nd and SE winds on the 4th interrupting the warmer SW flow of other days. The region experienced the only heatwave of the summer between the 23rd and the 25th with 1345 temperatures of 90, 93, and 94. At 4 PM on the 23rd, the thermometer reported 100! Waltham MA reported 99 and Salem MA 101. We rarely hit temperatures like that in normal years, so this is good evidence that the southern air mass was closer to average than the northern air.
And the northern air mass was behaving as though winter was not a distant memory. In Epping, the morning of the 6th started at 61 F. Five hours later it was 50 F, and the evening reading was down to 39 F. Plumer says merely “A little snow fell at Concord.” On the 7th and 8th, Plumer notes the wind was “NW strong” with morning temperatures just under 40 F. Given the wind, I wouldn’t expect a frost, and Plumer didn’t note one, though he does note “little snow at Concord” on the 8th. On the 9th and 10th he does note water froze on the 9th, and on the 10th “At Concord water froze in this night ¼ of an inch thick. For the last 5 days fire has been necessary in the parlor of the Council chamber.” (The governor presides over the Executive Council. In return the five councilors, elected from five districts in the state, approve contracts and in general keep the governor from causing too much mischief.) The cold lifted on 12th, but chilly weather was soon to return.
Other notes in Plumer’s journal mentioned two inches of snow in Williamstown and that it was cool in Europe too, with snow in England on the 6th.
Meanwhile, Adino Brackett was in Concord through the end of the month. His wife, Mary, wrote from Lancaster “snow three days in succession … corn entirely killed … trees wear the appearance of October … it is our duty to submit to this calamity with … resignation as well to all others.”
What were the weather patterns behind this destructive event? In 1816 they had no idea, except the usual “punishment from God” catchall. In 1924, Milham did much better with “All this can only be interpreted in terms of an extensive area of high pressure which was ushered in by strong northwest winds and snow squalls, and dominated the weather for six full days.” My biggest quibble is that high pressure systems don’t really get ushered in on NW winds, but help cause those winds, especially if there is a strong low pressure system off the coast heading into the Canadian maritimes.
In 2016, NH’s main television station ran a retrospective report on 1816, one of the first media reports of the year. It claims that in June “a nor’easter dropped 5 to 10 inches of snow.”
While a nor’easter is the most reliable way to place a low for strong winds, they come up the Atlantic coast, and I think in June, even a cold June, one will bring up enough warm air so that the event would have started out warm and then chill down. Besides, nor’easters generally influence a large enough area so that it’s unlikely there could be two separate storms. Note that Plumer reported snow on the 6th and 8th, but not the 7th.
Klingaman and Klingaman have a much better handle on things, and refer to a strong low-pressure system in the Great Lakes on the 5th. This suggests that we were dealing with an “Alberta Clipper,” a type of winter storm that is generally starved for moisture, moves quickly, but often “bombs out” (bombogenesis is a real Weather Service term) when it reaches the Atlantic. The small size of the storms makes it easier to accept two of them a couple days apart. Also, as the first storm bombs, the moist air it’s feeding on will be pulled around the expanding first storm and help feed the second. That means the second storm can pull down more northerly, colder air and produce more snow further west than most clippers.
This appears to be what happened. While Plumer reported small snowfalls, Klingaman includes “As darkness fell on June 7, another storm brought more snow. This time Vermont scored a direct hit. Accompanied by bitterly cold winds, snow and sleet began falling Friday night…. The town of Cabot received between a foot and eighteen inches of snow….”
The Green Mountains in Vermont often extract a lot of moisture from storm systems that pass over, so it’s conceivable that Vermont extracted that moisture and left drier air for New Hampshire.
Oh – one other thing. While all this was going on, a hurricane was working its way across Florida! Hurricanes generally need warm waters to start and grow. Call this another sign that the water and air in the tropical Atlantic was was not as affected as the northerly airmass.

July, as is often the case, had the most boring weather of the summer. The storm track is generally well into Canada and New England spends a lot of time in the moist tropical feed from the Gulf of Mexico.
Weather at Gov. Plumer’s farm was dry. In his summary for the month, he notes “Of rain there fell one inch 3 10ths & 1 20th.” I.e. 1.35″. This is about a third of July’s normal rainfall. Most of the rain fell late in the month, on the 20th and 28th. Before then Plumer’s comments includes words like dust and parched.
Meanwhile, in Europe “Note in the first week of this month the fall of rain in Holland and Germany was unusually great. The dykes were broken and the inundation did great damage.”
All this speaks of an extensive blocking pattern in the atmosphere forcing weather into a rut.
Up north in Lancaster, the soil moisture must have been much better, as Adino Brackett logged mid-month “… we have had fine weather every day[?] since about the 25th of June. Vegetables grow remarkably fast.”
On August 9th he wrote “Through the whole of July the weather continued very warm and growing. It seems as though old times had returned.”
There is a claim that there was frost or snow every month of the year in New England. While there is no hint of a frost in these reports, Klingaman and Klingaman report “On Monday July 8th, frost struck crops from Maine to Virginia. In Franconia, New Hampshire, the cold snap destroyed the bean crop. … The morning of July 9th brought even colder temperatures and hard frosts across New Hampshire, much of Vermont, and western Massachusetts.”
Let’s just assume this frost was limited to low lands and depressions where radiational cooling could bring its effects. Oh, just one more thing, Plumer reported wind conditions as “NW high” every day between the 6th and 9th. The wind could still be undercut by a night-time temperature inversion, and allow a weak temperature inversion to bring its extra cooling. I may research these days further, this seems to be the most confusing event of the summer.

In his early August entry, Adino Brackett also logged “Finished haying … Last night we had a frost, which on the hay looked quite white.”
In looking back, after his comment about old times returning, he continued with “But on the first day of August a great change took place.”
Unfortunately, he doesn’t explain what happened, nor can we see any of this in Plumer’s record, at least in the morning temperature. The dip in the afternoon temperature on the 9th is associated with northeast winds and some rain, so that’s simply Atlantic maritime air and sheds little light on Lancaster weather. About all we can assume is that a Canadian outbreak made it part way into New Hampshire for the 9th and maybe earlier. Apparently it had little impact on crops.
In modern times, July and early August have the most consistent hot and humid weather of the summer. By the middle of August the first relief arrives with a Canadian high pressure system. The dew point drops from the low 70s to the 50s and that combines with the longer nights to bring good sleeping weather and a pleasantly chilly morning or two. However, we don’t expect frost in either half of the month.
In my notes from Brackett’s journal, I don’t have other comments about August, there may be some that I didn’t note because his early September weather is more dramatic.
Meanwhile, August starts out well in Epping. It’s not nearly as dry as it was in July, and in the middle of the month southwest winds bring warmth greater than my modern average. Again, southerly air just doesn’t show much sign of volcanic cooling. On the morning of the 20th, a cold Canadian air mass blows in and sets a new theme for the rest of the month. The morning temperature reading on the 20th was 72, the next days brought 45 and 38 – hardly “pleasantly chilly”. The center of the high probably passed Epping before dawn on the 22nd, but sunrise is so close to 0645 then that must be close to the low temperature for the day.
Coincidentally, Plumer traveled northwest to Hanover for a week’s worth of dealing with Dartmouth College. For his entry on the 21st, he wrote “A hard frost that in many places of vast extent killed Indian corn (particularly on river lands), potato vines, pumpkins, cucumbers etc. We shall have but a small crop of corn – that which is not killed is chilled. On Connecticut River the night fogg [Plumer’s spelling] prevents early frost.” (The Connecticut River is the boundary between Vermont and New Hampshire – Hanover is in the valley, well north of Concord, but well south of Lancaster.)
From his return trip on the 30th: “Found the Indian corn from Hanover to Concord that stood on prime land entirely killed by the late frosts & the stalks & leaves dry. [Unclear – I think the damage included potato tops, beans and pumpkin vines.] The prospect of the latter harvest is small, but grain of every kind abundant. Apples few till I reached Salisbury [???]. Nary about 2 thirds in quantity & 3 4ths in quality of a common crop. People busy in gathering it in.”
The end of August marks the end of meteorological summer. The frost events of June and August are ultimately the key events that mark 1816 as the Year without a Summer. They stand out clearly in a temperature plot of the full summer:

Let’s go one month further into this eventful year. Perhaps I’ll write web pages about the weather beyond the fall harvest and into 1817.

September is a month of changes. The average temperature drops some 10 degrees, the days are shortening very quickly, the first frost is likely in the north, and not a surprise in the south.
Once again, Lancaster experiences an event that simply didn’t happen in Epping. On the 4th, Adino Brackett laments “This morning a dreary appearance was exhibited. Almost every vegetable was killed by the frost last night. … So severe a frost so early in the year I have never known.”
Klingaman and Klingaman talk about a cold wave starting on the 10th with frost and snow in Vermont, frozen corn and apples in Sutton NH (a few towns away from Concord). It looks like by the time the air made it to Epping, it had moderated so there was no frost. Perhaps it didn’t get that far, Plumer refers to northeast wind, so the cool weather may reflect an Atlantic source rather than Canada.
A more intense frost covered the region at the end of month. By then there was little left to damage. In Plumer’s monthly summary, he notes “On the 26th at sunrise at Hanover NH the thermometer was at 23, on the 27th at 20, on the 28th at 20, & on the 29th at 25.”
He also notes “Of rain there fell 3 10ths of an inch.” The regional drought brought fires, I suspect first distant forest fires in Canada but during September many fires in New England. Klingaman and Klingaman write of farmers’ brush clearing fires getting out of control and burning woods, barns, and cattle. Even offshore, it caused shipwrecks as ships couldn’t see other ships or lighthouses. Several of Plumer’s comments, especially in the second half of the month refer to dense smoke.
Beyond New England
Several other events and trends were happening in New England that interacted with the Year without a Summer and may have lingering effects today. Consider:
- The looming energy crisis.
Today New Hampshire has the greatest tree cover of the United States. In 2012, NH was 89% tree covered, followed by Maine’s 83% and Vermont’s 82%. (In terms of forest land, Maine leads New Hampshire.) In 1816, trees were fuel. They were also in the way. Extensive logging continued through the 19th century, culminating in large fires and the formation of the Appalachian Mountain Club to restore and protect the White Mountains.
- The solving of the Indian “problem.”
The Indians had a different view of the situation, but this made travel and living in the midwest safer.
- The opening of the Erie Canal in 1825 and, later, the railroads
The canal created an inexpensive route between Buffalo and New York City. Its success brought competition from railroads. However, the canal created opportunities that people were glad to take.
- No stones in the farm land.
If you want stones or granite, New Hampshire is still a great place to be. We have miles of old stone walls that were built up at the edge of 19th pastures that are once again mature forests.
1816 was a trigger that led many farming families to abandon the hardscrabble farm here for the promise of more reliable farming conditions in the midwest. Some people found that the weather was just as harsh, and sometimes harsher, but with a lower risk of tropical storms and no direct hits by nor’easters, few people moved back. And the first crop of the year wasn’t stones lifted by winter frost!
While some sources say the westward migration began in 1817, many people moved west in 1816. Once their crops were lost, there was little reason to stay in New England. Klingaman and Klingaman note in October that “at least several thousand refugees had passed through Zanesville [Ohio] in the past several weeks.”
Beyond the Weather
There are a couple interesting things in William Plumer’s journal. One is that he logs the times of things like “Moon fulled 11h.20m.am.” This can’t be an observation, as the full moon is up all night long. Willis Milham, referring to the Williamstown record, wrote “It is interesting to note that solar spots and a change in the phase of the moon were being carefully observed. It was apparently considered at the time that these two things were the chief causes of abnormal weather.”
My sense is that Plumer followed the moon phases out of farming interests, but I think Milham and I are engaging in pure speculation.
Plumer also reported on sun spots and occurrences of the Aurora Borealis. He was clearly fascinated with the latter and has some thoughts about its cause that we’d consider bizarre today, like thinking it arises from clouds something like how wisps of steam arise from a warm pond on a cold morning.
May 1816 was the peak of what we call Solar Cycle 6. It and the predecessor were very weak cycles, and make up the “Dalton Minimum.” There is some speculation that we may be entering a very similar period. The current cycle, 24, is not as weak, but some astrophysicists expect the next cycle to be similar to the old cycles. There is some evidence that we may be entering a period similar to the Maunder Minimum where we had very few spots for some 70 years.
I think some of Plumer’s sun spot observations were “naked eye” observations, relying on sunset, stratus clouds, or puddles to reflect most of the light, e.g. on July 9th “A spot in the sun visible in the morning, in the center large and black.” On July 10th: “At 7 O’Clock P.M. saw 2 spots in the sun near the west limb of it.” Others refer to good equipment, Sept. summary: “On the 29th at Salem Ma thru a telescope 20 spots were visible on the sun.”
His reports of sun spots are matter-of-fact entries, much like his reports of bird species returning in the spring, if he does connect them to weather, it likely isn’t in 1816 section.
URLs of Interest
The book Historical Climate Variability and Impacts in North America has a section on synoptic maps for the June cold spell.
American Weather Stories is a scan of this book from 1976 by Patrick Hughes of NOAA. A good account of “The Year Without a Summer” is on pages 46-54.
The Last Word
This is the final entry in Adino Brackett’s journal. It doesn’t match the rest of his notes through the year, so I think it was written by his wife. She may have suffered from depression most of that year, the weather certainly offered no help:
This past summer and fall have been so cold and miserable that I have from despair kept no account of the weather. It could have been nothing but a repeatation [sic] of frost and drought.
Ric it is clear that you are a bit confused when you write: “I think the weather pattern was most affected by high latitude cooling and the polar jet stream (the storm track) shifting southward. South of the storm track there was less cooling, but they were still affected by weather systems from the north. There are signs that the jet stream had a “meridional” flow which allows polar air to surge south and tropical air to surge north.” After all we now know that AGW causes polar vortexes. They couldn’t have existed before current generations.
Look at the last glaciation, same pattern as the polar vortex, nothing new, and certainly not the fantasy AGW.
WOW I thought this post was sarcasm. Apparently not
Mark….my same thought
It was sarcasm
If it isn’t then he should come visit Western Canada. Just because these weather patterns don’t always push South enough to catch a nickname doesn’t mean they didn’t exist long before his experience.
“It was sarcasm”
Good thing you returned with that, Thom . . I thought I was going to see a series of “[snipped]” comments following ; )
Ric Werme…..
“Did all this happen? Possibly, but I don’t think all the reconstructive work that [ has could be ] done to create weather maps for then has been done.”
Extra word in there ??
Geez, how could I have missed that one? that [could have been] done ….
Thanks, fixed.
Thank you for another awesome post..That must have taken a lot of time !!
we know what happen in the first few days of June 2016: Germany and France, incessant rain and floods. We also know what happen in June 1815 at the time of Battle of Waterloo, time of Dalton minimum.
“The area around Waterloo experienced heavy rains on June 17 and the morning of the 18th. Some military strategists suggest that the soaked ground might have delayed the battle and would have given the Prussian army the time to join forces with Wellington. One must remember that even Victor Hugo spoke of the influence of weather on the battle’s outcome. In chapter 3 of Les Misérables, the commentator says, “If it had not rained in the night between the 17th and the 18th of June, 1815, the fate of Europe would have been different. A few drops of water, more or less, decided the downfall of Napoleon. All that Providence required in order to make Waterloo the end of Austerlitz was a little more rain, and a cloud traversing the sky out of season sufficed to make a world crumble.”
Private William Wheeler of the 51st Kings Infantry “…[a]nd as it began to rain the road soon became very heavy…the rain increased, the thunder and lightning approached nearer, and with it came the enemy…the rain beating with violence, the guns roaring, repeated bright flashes of lightning attended with tremendous volleys of Thunder that shook the very earth…”
Private John Lewis of the 95th Rifles “…the rain fell so hard that the oldest soldiers there never saw the like…”
(Regina Jeffers)
“and left drier air for be mucNew Hampshire.” ??
(not trying to be a pest, just trying to help make it even better than it already is . ) ;o)
Now that one I changed late last night, changing depleted to drier. I may have thought I was typing in a search window but was actually typing in the document. Sigh.
Not a pest, I hate typos and appreciate the correction.
Besides, it’s nice to see someone is reading the whole 5,000+ words!
It appears that increased sulphuric acid and volcanic aerosols find their way to the polar regions via the Brewer Dobson circulation in the stratosphere.
Whilst present trhey absorb energy so that the stratosphere warms.
The warmer stratosphere above the poles pushes the tropopause down which facilitates cold air flowing outward more often and for longer hence the more meridional flows.
The process mimics that which I aver occurs when the sun changes its level of activity but in that instance it is the effect on the ozone balance in the stratosphere that matters.
Full explanation here:
http://joannenova.com.au/2015/01/is-the-sun-driving-ozone-and-changing-the-climate/
In the Northeast Kingdom of Vermont these temperatures are not unusual. In the the last 15 years we have experienced similar temperatures in the months of June, August and September.
See the National Weather Service’s Burlington NOW data for Sutton 2NE, East Haven, and Island Pond.
http://w2.weather.gov/climate/xmacis.php?wfo=btv
Under “Product” check monthly summarized data; under “Year Range” use 2000-2015 (or whatever range you want); under “Variable” choose min temp; under “Summary” choose daily min. Of the three reporting stations Sutton2 is the coldest and Island Pond is the warmest. They are all reasonably well-sited rural stations with limited UHI effects.
East Haven temperatures lie in the middle with the June mean minimum temperature being 34F, the August mean minimum is 39F and the September mean minimum is 27F. Length and continuity of record is a problem and the Sutton2 records are the longest reaching back to 1949.
The minimum mean for Sutton2NE for June is 31F, August is 35F and September is 26F. Colder temperatures are normal and our growing season is short. My wife still has our tomatoes and other cold sensitive plants in a cold frame.
In Kirby our tomatoes are outside in raised beds … and hoping
Temperatures are predicted to drop into the 40’s Wednesday, Thursday and Friday night this week but that will be down in Burke. Last year they were in the 20’s on Ridge Road the third week of June.
The record lows for your area are mainly from the 1940s to the 1960s. I wonder if that will change in the near future? …http://www.intellicast.com/Local/History.aspx?location=USCT0061
That is odd. Most of the high records are also from that time period, as well.
It is interesting how he describes the weather as cold and dry. Lack of warmth inducing drought?
More likely, the southward push of the storm track (or the appropriate kinks in meridonal flow) leaves Continental Polar air (cold and dry) in the region. Before digging into Plumer’s log, most of the articles on the year talked about strong cold fronts and thunderstorms. Dry periods always get less press until they’re extreme, and we didn’t get that dry.
..Antarctica is the largest desert on the planet…
Global warming? Snow falls in Siberia to mark official start of summer
http://siberiantimes.com/ecology/others/news/n0674-global-warming-snow-falls-in-siberia-to-mark-official-start-of-summer/
The Siberian stereotype says its always cold here, but this is a fallacy. Usually. Elsewhere, for example in Chita, the temperature is 24C, and in many regions there are growing risks for forest fires.
But as these pictures show, in some areas of western Siberia, the thermometers have plunged to around zero. Residents of Surgut, Noyabrsk, Novy Urengoy and other cities woke on 1 June, the first day of summer, to find it looked more like Chirstmas.
In some areas there were even snow drifts. In Noyabrsk, the local administration restarted heating supplies to homes.
http://siberiantimes.com/upload/information_system_40/4/3/8/item_4387/information_items_4387.jpg
Maybe you mention next time where e.g. Novy Urengoy is located: 66°05′N 76°41′E, where the polar region starts… Snow at the beginning of June ist quite normal there, they often have below -56 °C in the winter.
That is what google is for! I didn’t expect to have to give you a whole education to read this report. The report did say The Siberian stereotype says its always cold here, but this is a fallacy.
It is on a similar latitude to
City Province/State Country
Alta Finnmark Norway
Utsjoki Lapland Finland
Kirkenes Finnmark Norway
Tromsø Troms Norway
Tuktoyaktuk Northwest Territories Canada
Norilsk Krasnoyarsk Krai Russia
Murmansk Murmansk Oblast Russia
Harstad Troms Norway
Narvik Nordland Norway
Kiruna Norrbotten Sweden
Verkhoyansk Sakha Republic Russia
Bodø Nordland Norway
Gällivare Norrbotten Sweden
Kemijärvi Lapland Finland
Rovaniemi Lapland Finland
Ísafjörður Westfjords Iceland
Kuusamo Northern Ostrobothnia Finland
Tornio Lapland Finland
Boden Norrbotten Sweden
Haparanda Norrbotten Sweden
Kemi Lapland Finland
Akureyri Northeastern Region Iceland
Luleå Norrbotten Sweden
Pudasjärvi Northern Ostrobothnia Finland
Piteå Norrbotten Sweden
Oulu Northern Ostrobothnia Finland
Fairbanks Alaska United States
Skellefteå Västerbotten Sweden
Anadyr Chukotka Autonomous Okrug Russia
Arkhangelsk Arkhangelsk Oblast Russia
Nome Alaska United States
Nuuk (Godthåb) Greenland Denmark
Reykjavík Capital Region Iceland
Umeå Västerbotten Sweden
Iqaluit Nunavut Canada
Stjørdal Nord-Trøndelag Norway
Trondheim Sør-Trøndelag Norway
Örnsköldsvik Västernorrland Sweden
Östersund Jämtland Sweden
Vaasa Ostrobothnia Finland
Kuopio Northern Savonia Finland
Yellowknife Northwest Territories Canada
Sundsvall Västernorrland Sweden
Jyväskylä Central Finland Finland
Yakutsk Sakha Republic Russia
Tórshavn Faroe Islands Denmark
Tampere Pirkanmaa Finland
Anchorage Alaska United States
Lillehammer Oppland Norway
Lahti Päijänne Tavastia Finland
Qaqortoq Greenland Denmark
Whitehorse Yukon Canada
Turku Southwest Finland Finland
Bergen Hordaland Norway
Vantaa Uusimaa Finland
Lerwick Shetland United Kingdom
Espoo Uusimaa Finland
Helsinki Uusimaa Finland
Over the course of a year, the temperature typically varies from -31°C to 21°C and is rarely below -40°C or above 26°C.


Fraction of Time Spent in Various Temperature Bands
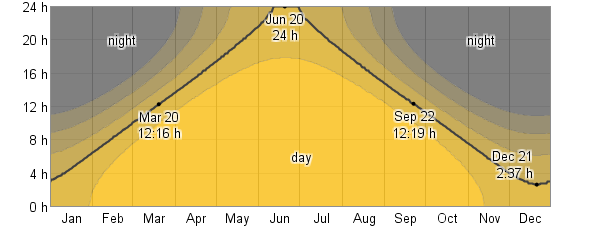
Daily Hours of Daylight and Twilight
Probability of Precipitation at Some Point in the Day
Warm Season Precipitation
Cold Season Precipitation
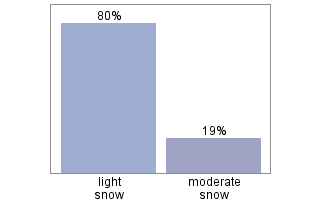
Probability of Snow Fall Being Reported in a Given Day
As you can see Bindidon “Snow at the beginning of June ist quite normal there” is twaddle and it is in fact quite unusual.
Many thanks for “A Quantum of Arrogance”, EricHa! Your hint to my education level sounds nice to me.
Due to climate change, it is evident to me that average winter temperatures have beautifully increased during the last decades in Novy Urengoy. That’s not good for them: permafrost grounds get weaker and weaker (I know by accident a person having worked there, who drastically complained about just that).
Nevertheless, let me please show you this:
http://www.wetteronline.de/wetterdaten/novy-urengoy?diagram=true&iid=23358&ireq=true&month=03¶id=TXLD&period=12&year=2014
Of course, it’s in german, but such facts need no translation, n’est-ce pas?
Unluckily for me, the website’s backtrack for this region stops at 2011. Otherwise I would have had the opportunity to show you how often temperatures below 50 °C were reached there in the last 50 years.
40 years ago, my university teacher had stuck a short note on his door; it might be helpful to you.
Think before writing! It may be an experience.
Looks to me that snowfall is reported about one year in four or more on June 1st, from your own graph.
One in four is hardly abnormal.
dindidon “A Quantum of Arrogance”
Pot? Kettle? Black?
bindidon “Snow at the beginning of June ist quite normal there”
No it is not! There is a 25% chance of seeing snow falling in June.
bindidon “they often have below -56 °C in the winter”
No they don’t! From your link on a single occasion it got to -48C. Was that even a cherry-pick or just bolox?
dindidon “Think before writing! It may be an experience.”
You obviously didn’t take your professors advice before opening your arrogant gob! If you are condescendingly giving advice then make sure you have your facts right. Got it?
menicholas “Looks to me that snowfall is reported about one year in four or more on June 1st, from your own graph.
One in four is hardly abnormal.”
There is a huge difference between snow fall reported and it laying.
I am looking at the buildings, which I suspect are apartments. What a bleak and stultifying place to live! By comparison, many of us live in the lap of luxury. I am relieved not to have the snow.
I’ve lived in places like that in the UK. The difference being that the Russian ones are probably a bit larger.
Great job trying to make sense of chaos.
Ric, I’m pretty sure that daily records of high and low temperatures were recorded in the 19th century for Lower Canada (Quebec). They were taken in different locations at different times, but in 1816, they were recorded at Montreal. I recall looking at the 1816 temps and seeing a 100 day frost free period. I’m sure that I either bookmarked or downloaded the data, but I’m not finding it. I’ll email you if I ever find it.
However while looking for it, I came across this. http://www.google.com/url?url=http://journals.ametsoc.org/doi/pdf/10.1175/1520-0477(1986)067%253C0524%253AECWOAT%253E2.0.CO%253B2&rct=j&q=&esrc=s&sa=U&ved=0ahUKEwii-ovjm5HNAhVFzz4KHSbcBCwQFggaMAA&sig2=MVxbLPE7feKkVf_W1TCc3w&usg=AFQjCNEdiGxlzuQr3nFjqqaOH4QgM0ZbxA I can usually extract addresses from the Google wrappers, but not this time. The pdf contains quite a bit of data on temperatures at Montreal and Quebec City in 1816. Might be of interest to you. Bottom line — It did snow in Quebec in early June and the rest of the Summer was cool, but the first Autumn frosts weren’t until late September
That’s a welcome find. When it comes to Canadian weather info, I’m pretty useless, even when it’s in an AMS journal.
I’m interested, but not surprised, to read that the July and August cold waves “were apparently much less severe there than in parts of New England.” I mention in my post that the July event is very confusing. I’m not sure what to make about August. Wind, radiational cooling, advection from Alberta to New England, advection from the east coast to Montreal could all be involved or could play nearly no part.
However, it does help affirm that sticking to New Hampshire, whose weather I know well, was the right limit for this post!
Inadequate research leads to ill-informed comments.
Please look at the Publication that emerged from the detailed two day conference held in Ottawa Canada in 1992 on the eruption of Tambora in 1815. Included in a pocket on the back cover where two maps reconstructing the general temperate and precipitation patterns created by the event.
https://books.google.ca/books/about/The_Year_Without_a_Summer.html?id=0SZRAAAAMAAJ&redir_esc=y
I know what we discussed and how the maps were created because I worked with Dick Harington and Cynthia Wilson in organizing and running the event including the workshop to create the maps. They showed extreme meridional flow that reflect and account for the sea ice changes and severe drought in central Canada from 1816 – 1819, among other things.
On November 20, 1817 the President of the Royal Society proposed a letter to the British Admiralty:
“It will without doubt have come to your Lordship’s knowledge that a considerable change of climate inexplicable at present to us must have taken place in the Circumpolar Regions, by which the severity of the cold that has for centuries past inclosed (sic) the seas in the high northern latitudes in an impenetrable barrier of ice has been during the last two years greatly abated.
Mr. Scoresby, a very intelligent young man who commands a whaling vessel from Whitby observed last year that 2000 square leagues of ice with which the Greenland Seas between the latitudes of 74° and 80°N have been hitherto covered, has in the last two years entirely disappeared.”
It is also clear that the cooling caused by the volcanic dust also exacerbated a cooling trend already occurring because of the Dalton Minimum.
I think I found a reference to that conference in my wanderings. Your URL doesn’t produce any useful information, at least not here in the US.
My search finds a link that I have visited, so yeah, I did find it. Check out this link – https://archive.org/details/yearwithoutsumme1992hari – it appears to have a full scan with a cutesy user interface.
I don’t see the weather maps from the pocket. I might look in some of the other manuscripts for other maps.
However, there appears to be little New Hampshire-centric information for me.
I can’t look further at the moment, it’s time to make dinner.
No. There is no evidence for that. The only evidence we have is that SC25 could be similar to SC24, and thus no Grand Minimum of any kind is expected. All the rest is speculation.
…”All the rest is speculation.” ! Just like CAGW is .?..( along with exaggeration and straight out B.S. )
On the contrary; astronomers have been saying for at least three cycles, “This cycle will be much like the last one”…and been proven wrong each cycle.
Akatsukami, Dr. Leif Svalgaard correctly predicted a low activity SC24, and has predicted a similar SC25. His scientific prediction based on solar magnetic activity agrees with my analysis that no Grand Minimum should be expected at this time of the 1000-year solar cycle. We could be wrong, but there is no evidence at this time hinting that we are. There is absolutely no evidence that we should expect a Solar Grand Minimum.
http://i1039.photobucket.com/albums/a475/Knownuthing/Scafetta2c_zpsit66xrpm.png
I tried to reply to this earlier, but WordPress decided it was time to log me out and discard the reply. Sigh.
I should have swapped my use of speculation (wrt something similar to the Dalton Minimum) and evidence. The Penn and Livingstone data that first hinted at the possibility of explaining and repeating Maunder have leveled off, so I currently expect a repeat of Dalton to be more likely. Nothing is certain except that we are in the golden age of solar physics.
Ric, first, thanks for all the work you’ve put into this.
However, there are so few records from the time from New England that it is not clear what happened. But we do have records from Europe, a number of them.
Here’s the oddity … the summer temperatures in 1816 in Europe are generally indistinguishable from other years.
See my post “Missing the Missing Summer“. It shows actual temperature records from around Europe. I challenge anyone to identify the year of the missing summer without reference to the legend.
Were there weather perturbations after the eruption of Tambora? Yes … but they were neither as widespread nor as strong as popularly believed.
w.
The period in question was predominantly agricultural. Serious disturbances of normal cropping patterns are very well documented. This fact, regardless of statistical measurements, would have warranted the name that was attributed to this time by the people who experienced it. Weather is highly variable in most places. How many years are given a name?
I just have read your post written in 2012, and I could find this comment:
https://wattsupwiththat.com/2012/04/15/missing-the-missing-summer/#comment-956711
That looked to me a bit like a ping-pong play over years 🙂
But one thing matters me a bit more: why is this event so unknown that nearly nobody refers to it?
http://www.pnas.org/content/110/42/16742.full
Do you know more about it?
If I understand your 2012 post, the idea of a long sequence of huge eruptions in the 13th and 14th century having possibly been the LIA’s origin (rather than Maunder’s minimum) then is from your point-of-view a falsifiable blind-alley, right?
I have not forgotten then 2012 post, I was one of the major commenters on it and two or three people mentioned my original 1816 web page that I wrote to support a Geocache for the Reuben Whitten monument. (Today I got to see the interior of Whitten’s house.)
I reread that post a few weeks ago and decided it had very little overlap with this one, which is why I didn’t mention it.
Then and now you put forth the claim that decadal plots of daily or monthly temperatures did not make 1816 stand out. My claims, based on various articles about that year, as I was writing for geocachers and WUWT didn’t exist at the time, were that events like killing frosts were more important and were well enough documented.
My approach was to look at the killing frosts. Every year we run the risk of the Apple crop getting wiped out by frost during blossoming. Forsythia is one of my favorite weather-sensitive plants. In the cold winters in the 1970s the buds under snow always survived, the buds above often froze or dessicated. This year a couple days of sub-zero weather in February hit just as the Forsythia had decided this was the year without a winter were about to bloom. 95% kill on my bush!
While working on this over the last few months, I’ve found a few sources that noted 1816 wasn’t that much colder than other years and that other years like 1812 were colder. However, that’s not the point – if you’re a hardscrabble farmer who spends more time moving rocks than Indian corn. Frost is more important than colder than average weather, and two of the frosts in 1816 were ill timed. One would have been okay, two caused a historic disaster.
An aside – but I believe the winter of 1812/13 was a harsh winter and had an effect on the disagreement between the Canadians/British and the Americans given the very cold winter and deep snows making marching a problem. I must go back and re-read your article to see if your references included the 1812 to 1816 time frame. Wondering if it was a period of cold winters as well.
Deep snow and a recorded temperature of minus 27 on March 5th, 1813
http://www.warof1812.ca/march.htm
Nasty cold and deep snow in that region by you appears to be fairly frequent. I recall reading about similar problems for the US militia marching north along Lake Champlain as well as the trials and tribulations of its namesake, Samuel de Champlain who first came to “Canada” in 1603. Those were very tough people.
The early explorers kept logs and I am constantly amazed that they survived, but they had the requisite skills for their time.
Ric, you say:
Do you have a link to this data? I hate speculating based on partial information …
w.
I should have done that last night, sorry. I’m about to head out to “Sunday June 5th First Frost Ice Cream Social at 2PM” in Ashland NH, home to Reuben Whitten and the granite monument to the 40 “bushils” of wheat he shared with neighbors. http://www.reubenwhitten.org/
I’ll put it up when I get back.
Damp and chilly day here, rather fitting.
In the meantime, read Willis Milham’s 1924 paper. The first part is the most relevant, the other two are more interested for seeing 1924 thinking.
Okay, I’m back! I put two new files up, get to them via http://wermenh.com/1816/index.html . I want to keep the link PlumerJournal.pdf out of search engine spiders for a bit, the Chinese burn a lot of bandwidth downloading a big .pdf that hasn’t changed in probably more than a decade, and I’d rather they not add another 50 MB to their daily graze.
Good starting points:
.pdf page 210: January 1816
.pdf page 373: Appendix – has monthly, seasonal, annual, and whole journal averages.
BTW, there’s there’s no decimal fractions in it at all. It makes it easy to see when an average covers 13 years. E.g. 56 3/13ths degrees!
The other file is a spreadsheet with April -September 1816 temps, sun, wind, notes, and other stuff. One sample got clobbered by an ink drop, filled via semi-intelligent guess.
Western European and the CET temperatures correlate well.
When the noise is filtered it can be clearly seen there were three periods of low temperatures, late 1600s, early 1800s and early 1900s .
Solar activity was also low in the late 1600s, early 1800s and early 1900s.
There is a bit more to it than just occasional coincidence.
http://www.vukcevic.talktalk.net/GCs0.gif
The above graph shows a clear case of association between changes in the solar activity and the world longest and most reliable temperature records all the way from the time of Maunder minimum as far as 1950s.
Not any effort of the ‘solar refuseniks’ can change the above facts.
Two nor’easters can hit the US eastern seaboard two days apart from each other. This happened on January 13th and 15th 1978.
From http://docs.lib.noaa.gov/rescue/dwm/1978/19780109-19780115.djvu
I see a storm near Tallahasee FL on Jan 13. It was over New Orleans on the 12th. On the 14th it was near New York City. On the 15th it was near the St Lawerence Seaway with no second storm ready to follow.
I spent a lot of time in 2003 refreshing stressed memories about the three major storms in the winter of 1978. I documented the results in http://wermenh.com/blizz78a.html , an addendum page to my single storm page about the [northeast] Blizzard of ’78.
Jan 20th: non-blizzard that set a record for most snow in 24 hours at Boston’s
Logan Airport. My car died when I parked it in a snowpile and snow got on the timing belt causing it to skip several teeth.
Jan 26th: rain in New York and New England, “Blizzard of ’78” in Michgan, Indiana, and Ohio.
Feb 6th: Blizzard of ’78 in New England, broke the record set two weeks before.
I remember claiming there were only two storms that winter….
A couple of days ago I picked up a copy of the history of the Mennonites in the Waterloo area. It mentions the terrible year of 1816 and notes that it lives in their memory of horrors, passed on by word of mouth. There was a hard frost every month of that year. They kept planting and planting hoping to get a crop of something, not nothing. But they lost the entire year. They survived for 18 months on gruel.
TonyB has large collection of the contemporary weather records, his insight equals or surpasses that of many if not most of the climate scientists. Tony if you are about your comments would be appreciated
I think this is his site:
http://climatereason.com/Articles/
This was a year without summer in Western Europe too.
Anomalies for De Bilt from the 1800-1829 means
jan feb march april may june july august sept oct nov dec
1,41 -1,40 -0,54 -0,02 -1,86 -2,12 -1,16 -2,05 -1,17 0,22 -2,16 -0,14
source http://projects.knmi.nl/klimatologie/daggegevens/antieke_wrn/index.html
and http://projects.knmi.nl/klimatologie/daggegevens/antieke_wrn/labrijn_ea.zip
Jan Buisman’s “Extreem Weer” ( https://www.amazon.co.uk/Extreem-weer-weergaloze-zinderende-watersnoden/dp/905194358X/ ) on page 257 shows a map with the anomolies for the summer of 1816 compared whith the 1971-2000 normals ranging from -1,5 C to -3,0 C (France)
Russia above normal ca 1,0 C
Wind mainly between west and north , and very wet. (see Waterloo)
There are a couple interesting things in William Plumer’s journal. One is that he logs the times of things like “Moon fulled 11h.20m.am.” This can’t be an observation, as the full moon is up all night long.
Maybe he had an almanac. The full moon on 6 Sep 1816 occurred around about 1120 local time in northern New Hampshire.
http://ssd.jpl.nasa.gov/horizons.cgi
From the article: “In the book 1816, meteorologist Nicholas Klingaman shows evidence that the jet stream often had a meridional flow. This is when the jet stream meanders north and south, which opens paths for both cold air to flow south and warm air to flow north. It also slows down the progression of weather systems as they flow from west to east.”
Isn’t this what happens every year?
During the winter, the jetstreams flow west to east fairly quickly, and in a fairly straight line (compared to meridional flow), and then when spring and summer roll around, the jetstream starts getting more “meridional”, making big loops north and south, instead of moving due west to east.
Ric, thanks for such a very interesting and detailed article.
Thank you!
My apologies to all non-US folks for having no Celcius temperatures. There were just too many to convert and would have cluttered up some already cluttered prose. Besides, with the emphasis on freezes, it doesn’t take a thermometer to explain why there’s ice in the horse trough.
There are in our life many many harder things we’ll have to deal with! Don’t worry Ric, we all manage to understand.
After all, better somebody tells us something trustworthy in Fahrenheit than unbelievables in Celsius!
A very interesting article linking weather with climate.
l think the reason for the frosts turning up during the summer months was due to the way blocking highs over North America and Russia became linked across the Arctic. So allowing a set up of cold arctic air not only to flow down across NE America but also down across China as well.
Attention Moderator
I just got a new computer its still me
michael duhancik
Ric, thanks for the fascinating journal. He paints a vivid picture of the times.
I think that the author must be taking temperatures out in the sun. I say this because on page 328 he describes the August frost. At 9 pm the evening before the frost the temperature was 58°F (14.4°C). During that night, there was what he describes as “a hard frost that in many places of vast extents killed indian corn (particularly on fine lands), potatoe vines, pumpkins, cucumbers, etc. We shall have but a small crop of corn—that which was not killed was chilled.”
But despite that, at 6 AM (which on that date and latitude is less than an hour after sunrise, he records the air temperature as 45°F (7.2°C).
If there has been a hard frost, seems to me it would be unusual for the air temperature to jump that fast so soon after sunrise.
But that is a minor point. I can only admire the perseverance and the detail of his diary.
All the best,
w.
Interesting topic. We live in an area of the Canadian prairie above the 50th parallel where killing frost can have dire consequences for farmers on the year’s bottom line.
The damage that frost can cause is sometimes unrelated to the level of air temperature. When the temperature dips, plants under stress from drought for example are more likely to suffer damage than plants growing under lush conditions. The strength of the wind during the drop in temperature can affect the amount of damaged crop. There have been instances of crop damage from frost where the air temperature did not dip below freezing and yet the cold wind, usually from the north, did its worst. Cloud cover or the lack thereof at the time of frost also affects the amount of damage that will occur.
Rick, good points. I was on a weather Email list where one member generally posted a morning temperature reading at 2 meters above ground and also a near-ground reading from his garden. After good radiational cooling the garden temperature was often a surprising several degrees cooler.
Several years ago I read an account from someone who had to fix a combine late one night in an Illinois field. He was amazed that he could identify the inversion pretty much to the inch. From ground level to the inversion there was no wind. An inch above that was typical prairie wind blowing like it was daytime.
I’d like to document such an inversion’s development with one foot resolution. Sadly, not very high on the list of things to do. I bet there’s some interesting process involving the ground cover as the inversion begins to assert itself.
On the day Plumer introduces the thermometer, Jan 13, 1809, (.pdf page 66), Plumer notes “The thermometer hangs in the shade in a small entry facing the east.” So yeah, there is a big concern about the morning temperature data during spring and summer, despite the shaded location claim.
One thing that is not clear is what Plumer did when he was at the state house, or in August’s case, on the road to/from Hanover, well north of Concord. My guess is he didn’t risk bringing the thermometer, but left it in Epping and either his wife or “his man” recorded the data as part of the farm chores. Fancifully, I like to think of people reacting to a grandfather’s clock in the parlor. I haven’t seen any reference as to how he set the clock, there was probably no factory whistle nearby, so I’d guess it’s from an accurate but highly decorated sun dial.
BTW, from some days with an east wind near freezing, comments about frost or snow led me to conclude the thermometer is quite accurate on cloudy days.
On the road, we have the dichotomy of the thermometer in Epping, fairly near the coast, at 200′ altitude, and Plumer traveling to Dartmouth. Hanover, next to the Connecticut River is around 400′, but between there and Concord there is a lot of terrain around 800′, so that could be good for a few degrees cooler than Epping.
Sunrise at Epping on the 21st was a few minutes before 0600, so there are 45 minutes of sunlight before the temperature reading. However, it takes a while before the sun can warm up anything but an east facing surface. On a day at home with very good radiational cooling in late August, sunrise is around 0600, the temperature only climbed some half a degree by 0645, so not much effect, as I noted in the post above. In June there can be a big rise by 0645.
My suspicion is that a reinforcing cold front or cold air advection or what you will, simply hadn’t made it to Epping yet. On the 22nd, the morning temperature had dropped to 38, and it’s a lot easier to go from there to hard frost in hillside valleys between Hanover and Concord.
BTW, you read Plumer’s text as “fine lands.” I did too, but on review changed it to “river lands.”
I forgot to mention one other factor when frost strikes.
Oddly enough the temperature differential between overnight lows and morning highs the following day can affect the amount of damage that will occur. I believe it has something to do with the plant’s ability to harden up during the frost and stay hardened through to the midmorning. If the morning starts out sunny and warm the plant goes into regular growth mode when it should be hunkering down for the onslaught of changes that have happened to it through the night.
Hi Rick, – Soluble sugar (& proline) build up in plant cells (& apoplast) when it acclimates to low temperature & the plant then can “super-cool” down at a rate that avoids damage if any internal ice nucleation. The ratio of more sugar may key into your next morning prediction; although the super-cooling protected the chloroplasts it also slows their ability to fix CO2 as fast as before that frost.
Come daylight the photosynthetic rate is slower (CO2 fixation inhibited) & yet the warmer it is the more enzymatic activity is occurring; but now under light there is excitation energy (photosynthetic electrons) that need shuttling. I propose that the fate of all that extra sugar the plant had overnight is not a steady state & , in your scenario, can impact how effectively the leaves deal with daylight burden of electrons to transport along. Those plants that suffer ( under your dynamic) are not effectively dissipating these electrons & that then leads to a version of photo-inhibition incurring damage that negatively impacts the subsystem PS II.
High levels of soluble sugar down-regulate genes for photo-synthesis; one result is NADP+ is not as well recycled so some more electrons get shuttled in a way that generate reactive oxygen molecules under normally benign light. Proline should be considered as protective of the syndrome photo-oxidative stress & quite possibly those plants of the same age which you do not observe suffering in your scenario are capable of producing more proline.
http://berkeleyearth.lbl.gov/regions/new-hampshire
1816 april 38.5, may 49.8, june 58.3
or 1.6C-3C below the 1951-1980 average.
The cool thing about finding old records that we didnt have when predicting the temperatures for new hampshire is we can check..
basically we predict new hampshire based on surrounding data..
You’re missing the main point of the post. 1816 is the Year without a Summer because of two freeze events. The BEST data is irrelevant except maybe for computing Growing Degree Days (which get trumped by freezes.)
I don’t care about your point.
I care about more data.
19th century data appears to be commonly two or three temperatures recorded per day, and a daily average computed either by the average of those three or by giving the evening temperature twice the weight because (I assume) it’s closer to the average. Later after max/min thermometers were invented people shifted to computing the average by taking the average of the two most extreme temperatures of the day. I think those 19th century guys may have had the better methodology.
How does BEST handle that data and the transition to recording extremes?
We only use synoptic data as last resort. These are 4 recordings a day.
My grandmother was born in 1890 and died when she was almost 105. She was born on a farm near Moncton Ont which in turn is near Stafford. She claimed that one year they basically got no crops on the farm and she called it the year without summer. Not sure there is any evidence or not.