Guest essay by David Archibald
A few years ago, Professor Humlum, Professor Solheim and myself mounted a meteorological expedition to Svalbard on the island of Spitzbergen, with the attendance of some others. The expedition was armed and sustainable, as reported in WUWT here. In that report, it was noted that “the fall in temperature of the Atlantic Ocean to the west of Norway from the peak in 2006 has been just as fast as the rise from 1990. When will the cooling stop and at what level?” Well, the cooling hasn’t stopped and the rate of temperature fall has steepened up. Meteorologist Paul Dorian has described the implications of this on his site Vencore Weather.
This is the current state of the heat content of the North Atlantic water column from Professor Humlum’s site climate4you. Firstly the location of the area measured:

The heat content updated to December 2015:

From its peak a decade ago, the temperature of this water column has fallen 1.0°C despite the fluctuations in the temperature of the air column above it. The rate of temperature decline has steepened up such that the levels of the 1970s cooling period will be reached by 2018.
Europe has just experienced snowfalls in late April. That is not so unusual. Three years ago there was snow in Europe in late May as far south as northern Spain and Italy. Snow in May will just become more usual to the point of being unremarkable. The North Atlantic’s heat content is no longer getting any help from the Sun with the F10.7 flux spending more time below 100, the breakover between heating and cooling, than above it:

As to the mechanism of the cooling of the North Atlantic water column when the atmosphere above it has yet to follow, perhaps a solar explanation is too simplistic. The scientific premise of the movie The Day After Tomorrow is that global warming will cause a slowing of the Gulf Stream and in turn that will cause severe cooling. Unless we can get up-to-date data on the Gulf Stream that disproves that theory, can it be dismissed out of hand? Counter-intuitive though it might seem, it may be that the cooling of the North Atlantic water column is the only evidence that provides proof of the AGW theory. Perhaps it is time to question some long-held beliefs.
David Archibald is the author of Twilight of Abundance.
NOTE by Anthony: published refutations of “slowing of the Gulf Stream” has been discussed here and also here on WUWT, I see no merit to the claim that it is happening.
So global warming will cause warming until it is disproved by cooling but cooling proves global warming (if you consider a movie plot)
R
O
F
L
Yes, when “Because science” is not a strong enough argument, well then break out the big gun: “Because Hollywood”.
It all comes down to “because observations”.
Eventually.
I will remind you that warmistas do not like to do research that involves going outside.
It tends to be hot and cold and wet and dry and snowy and rainy and not very air-condition out there.
David Archibald, Professor Humlum’s graph is not representative of the North Atlantic as a whole. The coordinates of 30-65N, 60W-0 represent only a portion of the extratropical North Atlantic. Some might say Professor Humlum cherry-picked the coordinates, considering the increase of subsurface temperatures west of 60W from 2007 to 2015. See the following trend map for that period.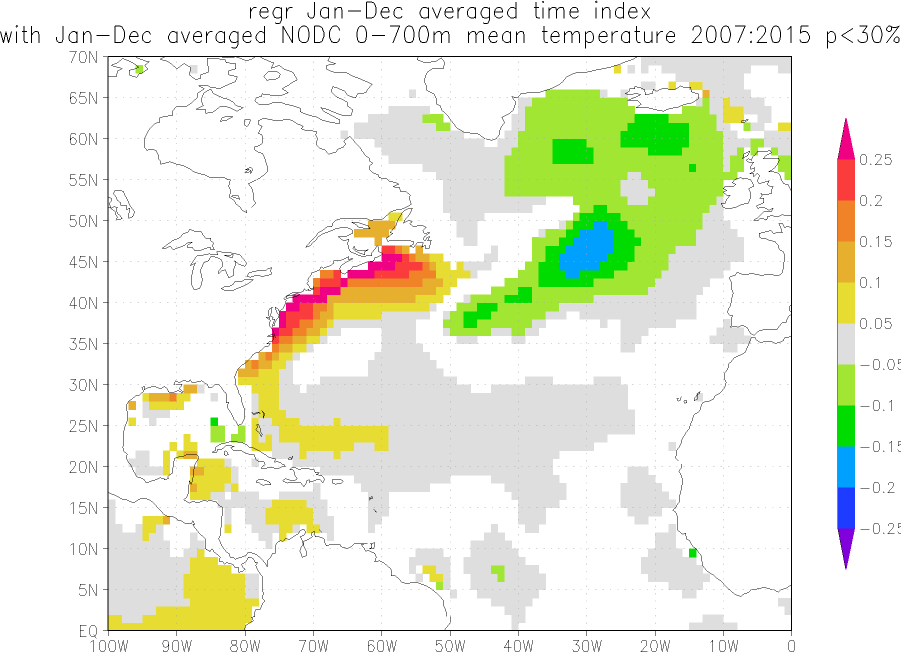


For the depths of 0-700 meters and for the coordinates typically used for the North Atlantic (0-70N, 80W-0, used by NOAA for their AMO data), there has been a slight decline in the NODC-based subsurface temperatures since 2004, roughly
-0.05-0.1 deg C based on a linear trend (not shown).Also, for the ARGO era, starting in 2005, the NODC-based data to 2000 meters for the North Atlantic (0-70N, 80W-0) show a slight increase (not decrease) in subsurface temperatures.
Cheers.
PS: Your headline reads Atlantic, not North Atlantic. For the Atlantic as a whole (60S-70N, 70W-20E), the NODC subsurface temperature data indicate a flattening of the warming since the early 2000s, not a decline, for the depths of 0-700 meters:
Thank you Bob. Your comments put the issue in the proper perspective.
Many thanks.
What is really interesting is to overlay temperature and currents at different levels. Have been working on that to see how the “Blob” formed and dispersed. So many gyres, sub-gyres and dispersion so as to make it very difficult except for someone good at fractals. The surface currents and temperatures are quicker than the deeper ones.
My bias as a skeptic of CAGW is to hope for a linear drop in the AMO to further bolster the clear failure of the IPCC models and their proclivity to over predict warming by up to 300%. However I must agree that to expect a pure decadal linear trend in positive and negative ocean events is countered by the observations.
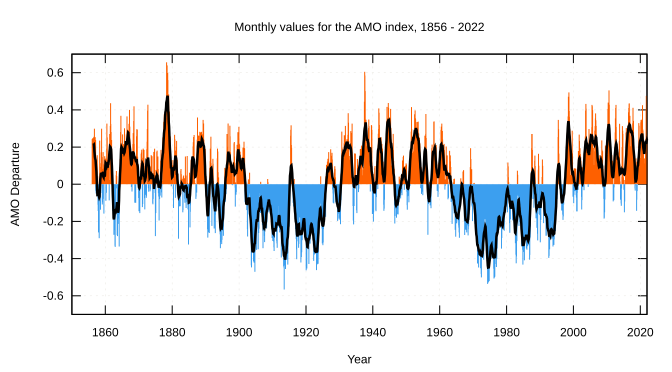
Look at this AMO chart. Notice the sharp counter to trend movements in each cycle, up and down. Looking at the current AMO downtrend, there is no reason to expect a consistent linear down trend either. Bob Tisdale’s different Atlantic charts confirm this. The PDO likewise does not follow a smooth sine wave, and has not remained in negative mode as most appear to think.
However their are many reasons to expect a cooling trend to follow the pause other then the short term spike of the recent El Nino.
Look at the AMO chart again and notice that the main cooling (The .4 degrees that used to exist on GMT graphics) does not come until after the peak of the down cycle. Likewise the 1940s warming blip (late erased as outlined in the climategate emails) did not max out until after the peak of the up cycle. So, given some time for the PDO and AMO to synchronize in a cooler mode, plus the low solar activity and the vanishing blop, I would expect to see a clear drop in GMT.
When following Oldenborgh et al. (2009) http://dspace.library.uu.nl/bitstream/handle/1874/43930/os-5-293-2009.pdf?sequence=2 one should use the area 25…60N; 70W…7.5E . for the AMO index. In the paper they justify this choice with the prevention of ElNino- Teleconnections in the tropical atlantic: “inclusion of the tropical Atlantic would confuse the issue.” This makes sense to me… And the OHC 700 of this area is very similiar to this one: .
.
The correct data: 25…60N; 70W…7.5W
sorry
“Counter-intuitive though it might seem, it may be that the cooling of the North Atlantic water column is the only evidence that provides proof of the AGW theory.”
Sorry but I can’t see how this even remotely even relates to CO2/CAGW theory.
1958: CO2 @ur momisugly 315ppm. Anomaly at roughly 0.0C
1990: CO2 @ur momisugly 355ppm. Anomaly still at roughly 0.0C, but rise in anomaly starts
2006: CO2 @ur momisugly 385ppm. Anomaly peaks at +1.1C
2015: CO2 @ur momisugly >400ppm. Anomaly back down to 0.0C and heading down.
If an 85 ppm change in a trace gas can shut off the Gulfstream we’ve got problems. So I predict the headline will be: “CO2 Shutting Down Gulfstream! Polar Bears and Harp Seal Pups Hardest Hit “
Chilemike: Which temperature anomaly is now back to 1958 levels?
But really isn’t this the next logical step in CAGW Theory? They’re too invested to throw in the towel if it actually cools a bit, so it follows that if they can make bad models that show catastrophic warming they can also make bad models that show catastrophic cooling, too. After all, it’s what they do for a living, so soon CO2 will be causing the next ice age.
Global cooling was their original scare tactic.
Weather too normal – CO2 responsible!
Won’t somebody think of the children!!!
I’m convinced, at least with the first chart. But then I was already convinced. It’s too bad ocean cycles don’t move faster to stop the Climate Con game.
Nothing personal either to the author or Bob Tisdale but you have to believe the ocean heat content data to even have this argument. Sorry OHC is probably the least trustworthy data out there. IMHO it’s right up there with “ocean acidity” data. This is liars poker.
+1
It looks more like a 1947-style hiccup than the AMO turning:
http://tinypic.com/r/2j9s9l/9
– I could be wrong though 🙂
Here is the same chart with a fitted sine wave:
http://tinypic.com/r/nnl5b4/9
looks as if we are still near the top of the AMO cycle (if the past behavior anything to go by).
David, thanks for your work. I fear I saw no support for this strange claim:
Say what? You are claiming that if the F10.7 flux is below 100 the sun doesn’t heat the earth, it cools it???
Regards,
w.
Willis, as per Tallbloke above, sea level falls when the flux is below 100 and rises when it is above 100. That is due to thermal expansion and contraction, and thus heat content. I thank Tallbloke for a very succinct explanation of a simple subject. Now comes the real reason which relates to how the piece was structured. I needed something solar to bridge over to the idiotic movie so I that I could end up saying that the cooling of the North Atlantic is the only physical evidence of AGW. Never pass up an opportunity to put the boot into the warmers. I hate what they have done to science – the corruption of the Royal Society for chrissakes! We are going back to the Dark Ages and we don’t have thorium molten salt reactors yet. With respect to the Sun, there is progress underway. I have a co-authored paper coming out in August showing that the solar cycle is due to the interaction of Jupiter and Saturn with the effect of Neptune and Uranus being additive or subtractive from time to time. This is what I set out to do ten years ago and soon I can go to my rest with respect to climate.
Anyone who reveals his own bias towards published researchers such as you have with this comment, “Never pass up an opportunity to put the boot into the warmers…” should have his work scrutinized for bias.
One of the easiest ways to demonstrate bias in your research is the fact that you refer to Tallbloke’s conjecture that flux anomaly has the energy necessary to expand or contract a very large body of water. It does not have that kind of energy.
My advice is for you to spend more time finding other holes in your own conjecture instead of putting “the boot into the warmers”. That is what a real scientist does. No stone is left unturned in an effort to disprove their own theory. In my opinion, neither side does a very good job of this. So rise above the rabble. I challenge you to post other weaknesses in your theory right here and now.
archibaldperth May 2, 2016 at 4:32 pm Edit
I don’t believe that for one minute. Citation? I note that Tallbloke didn’t provide one either, but then that seems to be a habit of far too many “It’s the sun, stupid” folks …
w.
The point is not that the oceans warm or cool as a direct result of changes in solar flux but rather that solar flux variations are a proxy for another aspect of the sun’s influence that does affect Ocean Heat Content.
Such as global cloudiness via changes in jet stream behaviour arising from upper atmospheric chemistry changing the gradient of tropopause height between equator and poles.
Stephen Wilde May 3, 2016 at 2:57 am
Actually, the point is that neither you, nor Archibald, nor Tallbloke have provided a scrap of observational support for the claim that sunspot related variations (e.g. TSI, cosmic rays, solar wind, global cloudiness, etc) are affecting the ocean temperatures.
Certainly the second graph in the head post above doesn’t show a solar component, or there would be six peaks in the temperature corresponding to the six sunspot cycle peaks since 1955. Since such peaks do not exist in Figure 2, clearly the sun isn’t the reason for the changes shown there.
w.
WUWT is a journal of record. Pioneering research started last decade:
https://wattsupwiththat.com/2009/04/07/archibald-on-sea-level-rise-and-solar-cycles/
https://wattsupwiththat.com/2012/02/03/quantifying-sea-level-fall/
https://wattsupwiththat.com/2012/04/22/back-testing-the-solar-sea-level-relationship/
Perhaps you want something with more equations? Nir Shaviv described the oceans as a calorimeter in this paper:
http://www.sciencebits.com/newver/files/articles/CalorimeterFinal.pdf
Peak oil was a bit delayed by the US shale oil boom. But this generation has seen peak sea level as we enter the TSI flux abyss of Solar Cycle 25 and the end of the Modern Warm Period.
Thanks, David, but I didn’t ask you to shower me with studies. Here’s what I questioned:
I asked for a citation to that, not for a history of your failed attempts to establish a solar connection.
Please stop handwaving and provide ONE citation to the above claim. I’m not about to dig through miles of your cryptic prose trying to find it.
w.
I have tried very hard to please you, Willis, very hard. But I have fallen short yet again. If only your standards weren’t so high! My bad!
archibaldperth May 4, 2016 at 7:55 pm
I asked for one simple link to a claim you made. Stop pretending my standards are too high. If you can’t provide one pissant link to a claim you made, your standards are too low.
w.
Why can’t we just toss some floats and make most of the cooling go away?
Like a real grown-up climate scientist. (sarc)
http://earthobservatory.nasa.gov/Features/OceanCooling/page3.php
Didn’t NASA drop buoys and detect a slight increase in the AMOC
Was that only the upper warmer layers?
Potsdam said it is slowing down (sinister down) using temperature, never left the office
They found an increase of about 0.001C. Which is fascinating since it’s about 2 orders of magnitude below the sensitivity limits of the equipment they were using.
“… about 2 orders of magnitude below the sensitivity limits of the equipment they were using.”
Which means, the 0.001 figure is far more likely to be incorrect, than to be correct . . and that, in my book, is a form of lying.
re “Counter-intuitive though it might seem, it may be that the cooling of the North Atlantic water column is the only evidence that provides proof of the AGW theory.“.
This is not “the only evidence that provides proof of the AGW theory”. There are absolutely masses of bits of data that are consistent with AGW theory, just like this one [assuming this one is correct, I haven’t checked it]. For example, the Arctic is warming, the stratosphere is cooling, and there was recently a big storm in Fiji. But bits of supporting data don’t prove a theory. A necessary condition to establish (not prove) a theory is absence of contra evidence. So for AGW theory, you need to look also at the non-warming of the Antarctic, the failure of the tropical troposphere to warm faster than the surface, and the dwindling storm rate outside Fiji.
For AGW theory, there is so much contra evidence that in any rational assessment it has already failed.
[NB. I used the words “AGW theory” as used in the original article. But “CAGW hypothesis” would be more accurate.]
This is related to the cycle of the polar vortex (weakness) and lower pressure drop over the North Atlantic.
http://geo.phys.spbu.ru/materials_of_a_conference_2012/STP2012/Veretenenko_%20et_all_Geocosmos2012proceedings.pdf
Doesn’t everyone know that “the missing heat” is hiding in the oceans? This article has simply exposed more data that need adjusting.
There really isn’t any surface on the ocean to re-radiate infrared into the atmosphere for CO2 to trap and re-radiate, water is fairly effective at taking care of transport of any heat input into the atmosphere on its own. This means that a combination of particulate interception and upper layer re-radiation of infra-red by CO2 and water vapor blocks the energy from getting to the ocean’s liquid mass and the heat input goes down. Since heat travels up we’ll always have warmer water right at the surface but this would explain the FlopENSO.
Storm’s a commin. Big one.
It is still high pressure over the Arctic Circle.
http://www.cpc.ncep.noaa.gov/products/stratosphere/strat-trop/gif_files/time_pres_HGT_ANOM_ALL_NH_2016.png
This is a huge stretch, IMO. Most modeling is warming the N atlantic again in the coming 2 years as there is alot of back and forth in the transitional phases as the AMO does shift. As far as “help” from the sun.. why do people not understand that we have had 200 years of strong sunspot activity that if you wish to buy the whole solar cycle activity, would have to have a stored response in the form of warmer oceans. The initial response of low solar, may be reduced easterlies in the tropical Pacific due to less radiation ( there is a remarkable link to el ninos and around the time of solar mins) and more el nino, releasing stored heat that Trenberth thinks is from GHG’s but I think would be the natural by product of high solar. I think we are putting to many eggs in one basket. Plummeting heat content. One would hope so, it couldnt get much warmer
Joe Bastardi May 2, 2016 at 5:00 pm
Thanks, Joe. Citation? I’ve never found an El Niño/solar link, but that doesn’t mean one doesn’t exist.
w.
Joe, as an example, the R^2 of the relationship between monthly sunspots and monthly Nino3.4 index, at the lag that gives maximum correlation (24 months), is a pathetic 0.003, with a p-value of 0.30 … like I said, I’ve never found a significant correlation between El Nino and sunspots at any lag.
w.
Mr. Bastardi
Thanks for the comment, I’m sure that great majority by far, appreciates and value your contributions. Solar variability and consequently the climate change aren’t going away any time soon, whether we like it or not.
“…the temperature of this water column has fallen 1.0°C despite the fluctuations in the temperature of the air column above it.”
If I understand John Christy (UAH) correctly, he has argued that this is why NOAA using night sea air temperatures to adjust the SST upwards to break the dreaded “Pause” is totally unsupported by temperature buoys measuring both air and water temperatures. There is a disconnect between the two.
The scientific premise of the movie The Day After Tomorrow is that global warming will cause a slowing of the Gulf Stream and in turn that will cause severe cooling.
The slowdown in the gulf stream is not “caused” by global warming. It is caused by the chaotic oscillatory dynamics of ocean circulation. The AMO is simply the oscillatory speedup and slowdown of the gulf stream.
Weather is of the atmosphere, climate is of the ocean. In regard to the gulf stream slowdown, the phrase “don’t believe anything till you hear the official denial” has never been more apropos.
Menicholas May 2, 2016 at 3:45 pm
The source of most of the coldness in the world is most likely my ex.
Cold does not come from anywhere…my eye!
+10000
Please no Day After Tomorrow, fantasy.
The cooling which we are currently observing has happened before and occurs cyclically. This is a holistic problem. There is only one solution that explains all of the observations.
The Atlantic ocean cooling due to the increase in surface winds which causes increased evaporation cooling and due to the increased low level cloud cover, both of which are caused by the interruption to the solar cycle.
http://www.geo.vu.nl/~renh/pdf/Renssen-etal-QI-2000.pdf
http://www.americanscientist.org/issues/id.999,y.0,no.,content.true,page.1,css.print/issue.aspx
http://www.atmos.washington.edu/~david/Gulf.pdf
Climate science is chock full of urban legends. Urban legend theories are theories (mechanisms) which are repeated when there is obvious data and logic that supports the assertion that the theories in question are completely incorrect, not part of the solution.
Solar cycle changes are the cause of past cyclic climate change and were the cause of the warming in the last 150 years.
1. The discrete thermal halone ocean conveyor theory has been proven incorrect by ocean float data. The discrete thermal halone conveyor started with a picture that Wally Broeker without proof. Ocean float data shows only 8% of the flow in the North Atlantic fallows the Broeker conveyor path. Therefore changes in the fresh water flow cannot interrupt the North Atlantic drift current and changes in the North Atlantic drift current do not affect ocean current flow in the Southern Hemisphere.
2. Basic analysis shows the heat transferred by the North Atlantic drift current is three times less than heat is transfer from summer warming of the North Atlantic current. A complete interruption to the North Atlantic drift current therefore cannot cause the cyclic warming and cooling of Europe and Greenland Ice sheet.
3. The warming in the Southern Hemisphere is simultaneous with the warming in the North hemisphere. If ocean currents where the cause of the warming there would be roughly a 1000 year lag.
4. When the Southern hemisphere, the Greenland Ice Sheet, and the Northern hemisphere warm, the Antarctic ice cools. This phenomena is called confusingly the Polar see-saw (see Svensmark’s attached paper). The Antarctic ice sheet cools as the albedo of that ice sheet is greater than the albedo of clouds. Therefore an increase in cloud cover over the Antarctic causes warming of that ice sheet rather than cooling. The albedo of the Greenland ice sheet is low than the Antarctic ice sheet and the Greenland ice sheet is not isolated by a polar vortex and hence unlike the Antarctic ice sheet follows the temperature of the surround ocean.
http://www.sciencedaily.com/releases/2009/05/090513130942.htm
http://www.americanscientist.org/issues/pub/the-source-of-europes-mild-climate
http://arxiv.org/abs/physics/0612145v1
WA
The Atlantic ocean cooling due to the increase in surface winds which causes increased evaporation cooling and due to the increased low level cloud cover, both of which are caused by the interruption to the solar cycle.
Why the atmosphere-centric view of ocean heat? How can the ocean be dependent on atmospheric processes alone for changes in heat? 99% of climate heat is in the ocean. Ocean circulation changes, both in terms of equator to pole heat transport and deep vertical mixing, are more than enough to generate changes in heat distribution.
It takes decades or centuries for heat exchange processes at the ocean surface to make any difference at mid or lower ocean depths.
Remember – atmosphere is about weather. Climate is about the ocean.
One or two mentions of sunspot cycles.
The SC4 for April 2016 in the ‘classic’ numbers has fallen to sunspot count of 27, currently graph only available here
SSN graph
see subset graph to the bottom right.
For ‘new’ Svalgaard numbers plot you need to look elsewhere.
SC24 started late, some of us (included myself, December 2003, published Jan 2004) forecast low values which proved to be correct.
Subsequently one or two pundits were forecasting the long SC24, but as graph shows it is more likely to be a short one. On number of occasions Dr. S. warned that the SC4 is not conforming to what is expected, he even wrote a paper on the subject, and he could well be right.
vukcevic May 3, 2016 at 2:14 am
Vuk, without a link to the forecast that’s just unsubstantiated boasting … I have asked you over and over to link to to the claims that you make, and over and over you think you can get away with just opening your mouth and letting something come out.
I don’t plan to stop calling you on this BS, so unless you want to be embarrassed over and over again, how ’bout you join this party we call SCIENCE and start making a habit of backing your claims up with something more than your empty words?
w.
Mr. Eschenbach
If you click on the link, and look at the graph, there is a link to the CERN website, for you to follow.
I’ve just got Mr. Tisdale concerned about the N. Atlantic ‘oscillations’ closely linked to solar and volcanic activity, in addition to Dr. Svalgaard’s and occasionally your concerns, it’s no surprise that the solar ‘gnats’ have become endangered type of a fruit fly around here.
Enjoy your sailing, looking forward to the your Pacific stories.
Calm seas and bon voyage.
Thanks, Vuk, but why would I want a link to the CERN website? I specifically asked for a link to your forecast, not to CERN.
w.
Mr. Eschenbach
CERN server has my paper dated 8 Jan 2004 (link to it is on my graph)
there you will find the equations. I’ve been through this with Dr. Svalgaard many times since about 2008, and if you expect me to go through it again for your benefit forget it. You kindly qualified it as ‘BS’ and I have no objections to your vies and opinions.
I am off to the south of France, day after tomorrow early morning, and while there I take rest from bloging, in meanwhile I’m concentrating on getting some writing done on
http://www.vukcevic.talktalk.net/NAM.pdf
Have a nice time over there.
Bye.
.
vukcevic May 3, 2016 at 5:05 am
Thanks, Vuk. I went to the page you linked to, but what I found was a graph that says “Vukcevic Formula 2003”. Unfortunately, the page was put up in 2011. It also is not on the CERN server, so I have no clue what you are referring to.
JUST GIVE ME THE DAMN LINKTO YOUR FORECAST ITSELF!!! I’m sick of dicking around digging through your rubbish looking for some gem. If you have a link to a contemporaneous report of your prediction, fine. If not, don’t bother me. I’m not interested in one published in 2011.
This is why I generally don’t answer your posts. You are most unwilling to link to whatever your latest rant is about. Much against my better judgement I tried to follow your three-stage path to your purported forecast … my mistake. Won’t happen again.
w.
You originally commented on ‘this graph’.
I refereed to ‘this graph’.
CERN link is on ‘this graph’.
and this graph is ‘this graph’.
http://www.vukcevic.talktalk.net/SSN.htm
I hope you got it
Here is the CERN server link , which appeared on the my SSN graph with a link monthly posted on WUWT for number of years
http://cds.cern.ch/record/704882?1
and here is part of screen shot from the CERN web page
http://www.vukcevic.talktalk.net/CERN.gif
which clearly displays my name Vukcevic, M.A and the date 8 Jan 2004
I refuse to answer any more easy questions, go ahead ask something more difficult.
Mr. Eschenbach throws mud at my name and I’m trying to help him ?!
Can it get more ridiculous ?
I suppose not, but it is a good laugh.
vukcevic May 3, 2016 at 2:51 pm Edit
I went to the page you refer to and there was nothing about CERN on that page that I can find … so thank you for finally DOING WHAT YOU SHOULD HAVE DONE FROM THE START and providing the actual link to your paper.
Look, jerkwagon, you provided a link that went nowhere, you were too arrogant or too lazy or something to actually link to the document, and now you want to whine about me accurately describing your actions?
Next time, just provide the link and you won’t get your stupidity pointed out. You STILL haven’t provided a link to your actual document … for those who don’t want to go around Vuk’s merry-go-round, the paper is here.
Here’s your whizbang result:
Part of the time it predicts half the number of sunspots that actually occurred … part of the time it predicts twice the number … and most of the time it has the timing wrong. If you call that a success, I’m glad you’re not my weatherman …
w.
This just gets better. Vuk posted up a graphic containing what he said was a 2003 forecast here. Since that page was published in 2011, I asked for a citation to his original forecast, and after many requests, he sent me to a paper at CERN.
Here’s the beauty part. The formula in his CERN paper is
where Ax is the year.
But in his 2011 publication, the formula is similar but very different, viz:
I’ve put the changes in bold.
So no, Vuk, that is NOT a “2003 forecast” as you claim. Your 2003 claim was similar, but far from the same.
w.
Mr. Eschenbach
Number of points you should have known before rushing into tirades:
You need to understand that sunspot time line is not the same as the polar field time line
Read Dr. Svalgaard, he is an expert on both, what you linked to is the polar fields, and what you are talking about is the sunspot formula, two very different things !
The next thing you failed to understand, there are two formulae, one describes periodicity the other amplitude, the projected SC peaks are at or near cross-sections of two, you just looked at one half.
Dr Svalgaard and people who looked at it understood this important point and it is always shown very clearly on the sunspot graph
http://www.vukcevic.talktalk.net/SSN.htm
Dr Svalgaard at least knew what he was talking about, not sure you do, but that is not of my concern.
People (see Wikipedia entries) who looked at and thought it had some value are:
Dr. Joan Feynman NASA-JPL astrophysist (sister of Richard, with whom I still occasionally correspond) – advised on overcoming publishing problems in 2003.
Professor Dr. Antony Hewish radio astronomer, Nobel Prize for Physics 1974 – neutral, since no mechanism of any kind can be validated at any time in the future.
Professor Dr. Eric Priest – Royal Society, Solar Physics Hale Prize 2002 (not even Dr. Svalgaard has one of these) – positive, at my behalf entered into correspondence on the subject with the NASA’s solar scientist Dr. Hathaway.
Dr. David Hathaway, NASA – on balance negative, on account of proposed mechanism, but at the time he was predicting for the SC24 to be the strongest ever cycle.
After all of the above, why I should take seriously whatever you come up with, but I had a laugh or two. You wouldn’t have been sent on a merry go round, if you had some sense to read what was written in first place, and what you were commenting on, despite the inappropriate language you used.
Mr. Eschenbach
I enjoy creating, some of it is good, some not so good, but the aim is to contribute, taking away or destroying is not my obsession. Despite all the fun, I have no intention to continue with the subject, regardless of what you may come up with next. Calm seas and a fare well to you and your sailing friends.
m.a.vukcevic
Vuk, I made two simple points. You have strenuously avoided both of them.
1. Your claim of a 2003 prediction was bogus. The citation you gave for it showed a very different formula, on a page created in 2011.
2. Your fit of your formula to the data was horrible. I’ll show it again, since you seem to want to ignore it:
Rather than respond to either of those evidence-based criticisms of particular claims, you went off on a rant about how various people thought your ideas were wonderful, and that there were many things I don’t understand … so what?? Seriously, do you think that is relevant???
Your opinion of me is meaningless. How much I do or don’t understand is meaningless. How many people think you are Mr. Wizard is meaningless. Those issues are all designed to distract people from the two gaping holes in your claims that I pointed out above.
You tried to pull a fast one, Vuk, and claim that you made a prediction in 2003 that you did not make. How about you deal with that instead of whining about me and what an idiot I am. I may be an idiot, but I’m not misleading people with bogus prediction claims and models that hardly fit the data at all. Start by talking about that and you might convince some people. Until then, you’re just dragging red herrings across the trail to try to send the conversation somewhere, anywhere except to points 1 and 2 above …
w.
This is for benefit any other readers still left around.
Mr. Eschenbach has confused two different things , he needs to learn difference between sunspot count and instrumental measured data for the polar magnetic field, next he needs to learn something about their relationship. Reading Dr. Svalgaard’s papers is recommended, than he might understand what the formulae mean.
He made his judgement about me from the date when my web-page was created in 2011.. I had web-pages on NTL.com and vukcevic.co.uk, long before. Just to show how wrong he is here is a screen-shot from now defunct web-blog SC24.com darted July 2009
http://www.vukcevic.talktalk.net/19July2009.gif
included is the start of an email from Dr. J. Feynman (sister of Richard) well known JPL Nasa’s solar scientist, author on numerous papers, note the date 16/06/2003
No scientist of her stature would bother to write an extensive email if she thought the formulae I devised were ‘junk’.
Mr. Eschenbach can comment on anything he likes, but before rushing and accusing people, it is advisable to check the facts. Someone else might consider apologising, but I don’t expect it on this occasion.
The above is an attempt not only to discredit my early work, but to discredit me as a person and consequently whatever has followed that early work. The direct link between solar activity and climate change is demonstrated in my post further below, but no way anyone can challenge that.
Attempts to write out solar influence on the climate change are doomed to failure !
I am off for 2-3 weeks, and when I go away I just don’t bother about blogs.
vukcevic May 4, 2016 at 9:53 am
Vuk, you’re hilarious. Your new reference to a 2009 version of your forecast that you gave us complete with a graphic has a THIRD version of your formula. Obviously, you’ve successively retuned it as you went along, while falsely claiming that it is a 2003 formula … but you still have not responded to either of my two points above.
Not only that, but instead of responding to my two points, again you’re whining about how confused I am … SO WHAT? My knowledge and actions are not the issue here, yours are.
w.
Learn about the relation between sunspot count and polar field. If you know what you are talking about, you would realise that only two important numbers there are the orbital periods 11.862 and 19.859 .Everything else are normalising factors, of no great consequence, but since you are trying to throw mud, you busy yourself with trivia. On occasions it may have been a typing error, as polar field graphs are regularly updated (between 20 and 30 times a year, dependant on the Stanford data) and formula is rewritten on the graphic. When you learn what it means, we can have meaningful discussion, but all what you said up to this moment is inconsequential and waist of your time. I have not invented anything, just described how solar system was arranged during the last 3-4 billion years ago. Substance and not trivia is fundamental to science,
Plot graphs in your comment of May 3, 2016 at 9:20 pm, and you will see where you went wrong, it is actually funny, you even put some numbers into bold to show they are different.
OF COURSE THEY ARE DIFFERENT, you had no idea what you were talking about !
Do yourself a favour, read Svalgaard on polar field observed intensity relationship to the sunspot count, stop wasting your time.
Now back to the more important matter of the N. Atlantic
Number of well informed contributors to this website maintain that solar activity effect on the climate change amounts to about 0.1 C. I am not so well informed, and not easily convinced by anyone’s views, I go and do my own thing and form my view.
N. Atlantic SST is available from 1850s onwards, but there are uncertainties regarding the earlier data.
Central England temperature has far more accurate data and goes back to 1660.
Dr. Svalgaard & co tell us that the sunspot group number GSN is a more reliable metrix than simple SSN. Despite some reservation towards Svalgaard’s ‘new’ GSN numbers they will be used in this short analysis.
To ascertain any effect of the solar activity on the longer term climate change I compared rate of change in the average GSN to the CET. For averaging I used a low pass filter since it gives more accurate results than a moving average.
Since the ‘new’ sunspot date has lost most of its up-trend and the rate of change by its nature tends to eliminate trend, I de-trended the CET data to obtain a more fair comparison as shown in this graph.
http://www.vukcevic.talktalk.net/G&C.gif
(click on the graph to enlarge)
Data used are
GSN: http://sidc.oma.be/silso/DATA/GN_y_tot_V2.0.txt
CET: http://hadobs.metoffice.com/hadcet/cetml1659on.dat
for the LPF response see the graphic inset.
From the graph above we can see that the solar effect varies from time to time, with respect to our dear sun, despite being the beginning and the end of it all, there are other factors, one of them being volcanic eruptions.
Strongest solar effect was just after coming out of the Maunder minimum and amounts to almost 1C, while the average is more likely to be around 0.5C. These values are based on highly smoothed data by the LPF, in reality the value could be somewhat greater. So much for the 0.1C limit to the solar influence.
I do not consider ‘global temperature anomaly’ index as having much value in relation to the real world I happen to live in, you are welcome to disagree, but I’m sticking to what I think to be right.