I don’t know if this is a real measurement, and that the Total Solar Irradiance (TSI) measured by the SORCE project is real, or if we are seeing another sensor failure situation like what happened with NSIDC and the sea-ice measurements done by DMSP F17 satellite.
Yesterday this graph of TSI plotted by SORCE was brought to my attention by WUWT reader Stephen Shochat:

The value on April 11th was about 1360.45 watts/m² by far the lowest in three months
I emailed our resident solar physicist, Dr. Leif Svalgaard, but got no reply, he may be traveling or may have thought it not noteworthy. Today I checked the graph again, thinking perhaps a correction might have been made if there was a calibration or instrument error, there was none, and the TSI value decreased further, to about 1360.25 watts/m²

A look at the sun itself suggests it may simply be due to a very, very, large sunspot rotating through the Earth-View. My guess is we’ll see a rebound in TSI once it crosses the horizon. Occam’s Razor.
If nothing else, this demonstrates that sunspots can have quite a large, if only temporary, forcing on TSI and Earth’s received energy budget.
More at the WUWT solar reference page
The sunspot is facing Earth less directly as it rotates toward the edge of the sun’s visible disk. The sunspot is not growing fast like it was before. Yet TSI continues to drop. I think the cause of the drop is at least in part something other than the sunspot.
TSI is reported with a week delay, so you should compare with where the spot was a week ago [at the center of the disk]
“TSI is reported with a week delay”
Fotomat had an overnight developing service (this was before 1 HR service); what gives with the week delay?
LASP policy. Allows them to check the data thoroughly. Here are the last few lines of the current report:
20160409.500 2457488.000 2457487.965474 0.2715 1360.9434 5.843e-01 6.800e-03 7.954e-02 5.896e-01 1356.1807 5.822e-01 6.800e-03 2.687e-01 6.412e-01 0
20160410.500 2457489.000 2457488.993635 0.2759 1360.6810 5.841e-01 6.800e-03 7.974e-02 5.896e-01 1355.1360 5.818e-01 6.800e-03 2.760e-01 6.439e-01 0
20160411.500 2457490.000 2457489.985838 0.2760 1360.4077 5.842e-01 6.800e-03 1.018e-01 5.930e-01 1354.1137 5.815e-01 6.800e-03 2.934e-01 6.513e-01 0
20160412.500 2457491.000 2457490.926913 0.2769 1360.2437 5.841e-01 6.800e-03 4.848e-02 5.861e-01 1353.2436 5.811e-01 6.800e-03 2.328e-01 6.260e-01 0
Note the last entry is April 12th.
And here is the Sun on that day
http://cesar.kso.ac.at/main/cesar_start.php?date=2016-04-12
Thanks Leif.
Aren’t sunspots cold compared to the rest of the Sun? And if we have an already cold sun.
This would seem to indicate that TSI (watts per square meter) is not the correct measure if we are looking for the Sun’s effect on climate.
We know that as solar activity increases that sunspots increase. Yet sunspots reduces TSI. Which means that with increased solar activity we should get more sunspots and reduced TSI.
And there are schools of thought that increased sunspots are associated with warming on earth, which contradicts that radiation for the Sun is the cause of climatic warming. If increased solar activity causes warming, then it must be some other properly of the sun other than watts per square meter that is affecting climate.
ferdberple, apparently sunspots have areas around them which have intense solar activity. A fellow named paul further down thread has a link to the abdussamatov graph which shows both sunspots and tsi over time. Higher sunspot activity generally means higher tsi…
Well not to worry; we are still well ahead of Kevin Trenberth’s 341.5 W/m^2 number, so the sun can do a lot of dying yet before we need to be concerned.
g
OMG! The Sun is going out!! No, it is too good a day to try channeling alarmists 🙂
“The sun is failing! The sun is failing!”
The next cry of the climate ‘chicken littles’.
Na, there ain’t no money in that is there?
Only a well-funded study could tell for sure … get that grant-funding proposal in early …
Only if they could claim it was our fault. They’re not interested in any problem unless they can use it as a lever. You know, so they can stop us heating our homes, eating meat, breathing. That sort of thing.
At this rate, the sun will be out within 10 years
randomness in the solar cycle
https://www.researchgate.net/publication/288826889_THE_HURST_EXPONENT_OF_SUNSPOT_COUNTS_A_NOTE
My first thought – for what it’s worth – was the big sunspot too. Dr Svaalgaard will put us right!
Sounds like it’s ‘worse than we thought’ and ‘unprecedented’.
Unexpectedly ?
Yes, it is simply due to the large spot. There have been several such dips caused by large spots:
http://www.leif.org/research/TSI-SORCE-Cycle-24.png
But there is something different with Cycle 24:
http://www.leif.org/research/Non-Conforming-SC24.pdf
WP is playing tricks with me [and showing an old graph]. Click on the graph to see the actual one.
Leif, thanks for the graph. It certainly shows plenty of downward spikes in TSI and some that are lower than the current one (I clicked on the graph to see the latest copy).
I’ve noticed that WP caches images to links when the link is first posted. It then displays the cached image even if the image at the link has been changed. I haven’t found a way to get it to refresh the image other than by changing the name of the link.
Leif,
I read through the PDF, and it looks really interesting. The acronyms and assumed knowledge are way above my knowledge… could you expand that PDF a bit into a WUWT article?
Thanks!
This is work in progress, so perhaps when I’m a bit further along.
+1
+1
Yes, please do!
And in answer to your question at the last slide: I would love to help but probably wouldn’t be of any use besides bringing coffee.
Many thanks Leif, especially for the Non-conforming SC24 pdf. Very interesting, I do trust the necessary resource will be made available for further investigation.
Dr. Isvalgaard
Is not cycle 24 the only one on record in which the second peak in the Sunspot count is higher than the first? I know that double peaks are not uncommon in the record but does not the fact that the second peak this time was slightly higher than the first indicate something we have not observed before is happening?
No, it is not uncommon for the second peak to be higher than the first peak. Here are some examples:
http://www.leif.org/research/Second-Peak-Higher-Than-First.png
thanks for that link leif . science in progress right there. you could address the divergence from forecast issue very easily with any one of numerous climate science algorithms 😉 . fortunately for science that does not appear to be your style.
Yes, thanks for the slide show and thanks for the candor.
==========
The TSI chart in WUWT reference page https://wattsupwiththat.com/reference-pages/solar/ clearly shows multiple past dips to ~1360 in the SORCE record (see Total Solar Irradiance (TSI)).
Interesting pdf. Is this SC24 trend related to the past Livingston work on decreasing sunspot magnetic field strength resulting in some of the spots being no longer visible?
Could be
What a great time to be a solar physicist!
Kudos Dr. Isvalgaard.
Note that a value of 1360 IS low for the past three months, it isn’t all that uncommon over the course of the project. If you look at a longer term graph, it isn’t all that unusual.
http://lasp.colorado.edu/data/sorce/total_solar_irradiance_plots/images/tim_level3_tsi_24hour_640x480.png
Look where we are heading to. http://www.oarval.org/Abdussamatov-25Nov2013-Image1av.gif
Yes, paul, this is do or die time for “solar warmists”. (as well, perhaps, “the last leif falling” for the opposing camp) It looks like everything is poised for the bottom to fall out with the global temperature record. Regardless of what happens, there should be much to learn about the sun’s role in global warming in the near future…
We live in interesting times! I do think the sun is the main driver of our climate, but I fear for a proof of that with a little ice age.
No, that ‘prediction is already falsified:
http://www.leif.org/research/Abdussa3.png
What’s falsified? It seems the record what indicate, very recently, that falling TSI matches falling temps. Looking at the chart from 2004 till now, when the TSI was at a continued low point from about 2007 to 2009 it was particularly cold in some places. Further, a better match is the Solar Layman alpha graph. No one that lived through the 1970s would possibly say the world was warming. Let’s try having a solar min for 70 years, instead of 1.
That’s about 1 degree astronomical, right? Maybe you don’t remember, but I do. Food reserves were way down before that big upswing at the end of the 1970s. We are feeding more people and we haven’t come close to an event like that since.
TSI did not follow Abdussa’s curve down, but is significantly higher than he predicted, so there is no evidence for his postulated sharp drop, and in addition, temperatures have not dropped at all.
Interesting conversation, but I disagree. Temps have dropped but probably not this year. It is certainly cooler than some years in the 1990’s.
At some point TSI is currently lower by 6 w/m^2. I was somewhat shocked to see it at 1360. The last I saw, (because I was not following it, I mean who would, it became a meaningless point of contention, it was pronounced that the sun never changes, ) was 1366.
While you can get tricked into either believing or disbelieving offical statements. I am wary of the offical temperature records, as I am of other records. However, the fact remains that things happen that cause you to look at other indirect ways of verifying. The offical numbers of rise is so small that they fall within the error bars. Next it seems that they are guessing about a lot. It is less than a compelling case that temps are warmer. In absolute terms of AGW, if I believed it, I would have to accept the math as factual, I would have to accept the fact co2 for the last 10 years has increased year over year, and that the models with the most certainty, that most people agree on, the actual temps are below the lowest predicted level. Which would indicate that temps are falling. Further, it can be inferred that co2 is not the only driver in any case or even a major actor. If temperatures were in fact rising and warmer than the late 1990s, we would not be having this conversation.
If 25 years after the most dire predictions that this is all there is to global warming, I can assure you that global cooling is the real deal for catastrophe.
I am concerned about the TSI levels. Time really will tell.
At some point TSI is currently lower by 6 w/m^2. I was somewhat shocked to see it at 1360.
No, Abdussa used the old scale from before it was discovered that the early instruments had a construction flaw that let extra light into the sensor, thereby increasing TSI by some 5 W/m2. In fact, TSI has not dropped, but simply followed the general trend of the sunspot number [perhaps a bit higher in 2015 than expected].:
http://www.leif.org/research/TSI-Composite-Froehlich.png
Of course. It has to be a design flaw. What else can it be?
Basically, the graphs are useless. Why would they bother to put up a graph like the Lyman alpha graph if it’s wrong?
It is a well-understood design flaw, that can be [and has been] corrected in the data, so the graphs are not useless at all. On the contrary, once the flaw is corrected the usefulness increases immensely.
What is useless, is the gripe about such things.
Here is the impass. What do we know, or at least me. First, the LIA and the MWP were real and world wide, and not local events. Second, the record from the IPCC clearly shows that temperatures and co2 did not diverge and were fairly flat.
Is it reasonable for a group of people to say, ” we don’t know what caused that, but we are certain that the run up in co2 is causing the current warm period” . ?
Third, none of the predicted outcomes have transpired. Is the burden of proof on me to determine where your error is? I’m taking the information on Web sites that are being put out there by reputable organizations as being fairly factual and acurate. Then you tell me the Lyman alpha graph is not. Ok, for arguments sake I accept that. Since we’ve exhausted all other explanations of how the MWP and the LIA occurred, then what is it?
Since I’ve been at this a long time, all of the errors have been in favor of AGW . While not impossible, improbable. You can’t be reasonable certain that this warm period is any different than a recent past one without knowing why. If all of current thoughts are ruled out for those events, we are truly in the dark. The failure of the climate models adds to this uncertainty.
While I may be using trapezoids to determine the length of a curve, I realize that it is not as clean, elegant, or as accurate as calculus. We had better find out what determined those two events and soon. The length of my curve leads us in a totally different direction.
Based on what I see on different sites, then when quoted there is a pullback when it doesn’t agree with AGW. Maybe it does, and maybe it doesn’t. Who knows?
I do the math when in doubt. One of the main formulas for AGW, goes the wrong way when different amounts are put in.
>i>Then you tell me the Lyman alpha graph is not
again, which Lyman alpha graph?
shows that temperatures and co2 did not diverge and were fairly flat.
Here you are already assuming that the two records are somehow related, otherwise it would not make any sense to say that they both behaved the same way…
That’s not an assumption. That’s a fact that every one from Al Gore to MIke Mann and every other proponent of CAGW has used. It is the signature of CAGW. From that every prediction has been made since. It’s also called the hockey stick, it tracks co2 and temperature going as far back as possible. I can’t believe would would entertain a question like that. That’s the basis for me being a skeptic. Have you been to a climate day awareness event? That graph is trotted out at every one of them. In fact as a matter of record according to the speakers of such events, there have been only 3 times that they can’t account for how the earth became a snowball, which was at least 500 million years ago.
Do you understand the basis of CAGW? It is solely dependent on co2 as the main regulator of temperature. In fact it is widely repeated that when Al Gore shows this graph, he says ” what pops out from looking at this”. It is the tracking of temperature and co2. After awhile I only concentrated on something that was in near history and widely confirmed in every kind of record kept by mankind, the MWP and LIA. Hence the quoted remark that those events were local and not world wide. They are caught in a catch 22. They have publicly stated that temperatures were flat along with co2 levels. The temperatures on their graph do not reflect either. If they admit to either they have to adjust both the temperature and the co2 levels. Then it becomes incumbent upon them to describe, in the absence of man made co2, how the co2 increased or decreased keeping in line with co2 regulates temperature. The fact is, they flat lined it.
As a scientist, aren’t you at all curious as to how either of those events occurred? There is a contradiction between how those 2 events and CAGW. Can you explain it? For what reason did they flat line that time frame?
As a scientist, aren’t you at all curious as to how either of those events occurred? There is a contradiction between how those 2 events and CAGW. Can you explain it? For what reason did they flat line that time frame?
All my waking hours [and a few dreamy ones as well] are dedicated to this problem. but I do not make hasty or ‘politically correct’ claims. In due time, all this will be found out. I am concerned with my corner of this problem: how the get the solar record as correct as we can make it.
Continuity in measurement. Continuity is everything. Degree of accuracy can always be defined. Continuity is the only way we can say that this is different from that.
Very interesting, Dr. Sv., thanks for that… In all fairness to abdussa, he didn’t predict a drop in temps until after the end of 2014. What ensued, of course, was the el nino year which he may not have anticipated. We’ll see what happens to global temps now that the el nino is fading. Of course, we’ll have to wait out the la nina to make sure that any cooling is lasting…
afonzarelli April 21, 2016 at 5:51 pm
In all fairness to abdussa, he didn’t predict a drop in temps until after the end of 2014.
No, he predicted a drop of TSI of 1 full Watt/m2 which corresponds to 0.07 degrees calculated my way [and would be more than 0.4 degrees if we included all the feedbacks that people claim exists]. And then the beginning of a new Little Ice Age. The point is that TSI did not drop 1 Watt, so the rest of his ‘prediction’ is just falsified.
Well… Why exactly does his tsi data diverge from yours for SC24? (is he still defending his data?) It still remains to be seen what will happen temperature wise going forward in leiu of a relatively week sun. We’ll at least learn something by waiting, watching and seeing…
His is an extrapolation, which is always a dubious thing to do. Mine are actual measurements.
My bad… just went back and reread what you said. Has abdussa modified his theory in light of this? It will still be interesting to see what happens going forward. (especially if the next cycle is as weak as this one)…
I don’t know if he has. I would think not. Perhaps he has just canned it.
I was reviewing some calculations from 2006. The solar constant S is described as 1368 w/m^2. I haven’t seen where they reviewed or corrected the calculations.
http://www.leif.org/EOS/2010GL045777.pdf
“[1] The most accurate value of total solar irradiance during the 2008 solar minimum period is 1360.8 ± 0.5 W m−2 according to measurements from the Total Irradiance Monitor (TIM) on NASA’s Solar Radiation and Climate Experiment (SORCE) and a series of new radiometric laboratory tests. This value is significantly lower than the canonical value of 1365.4 ± 1.3 W m−2 established in the 1990s, which energy balance calculations and climate models currently use. Scattered light is a primary cause of the higher irradiance values measured by the earlier generation of solar radiometers in which the precision aperture defining the measured solar beam is located behind a larger, view‐limiting aperture. In the TIM, the opposite order of these apertures precludes this spurious signal by limiting the light entering the instrument. We assess the accuracy and stability of irradiance measurements made since 1978 and the implications of instrument uncertainties and instabilities for climate research in comparison with the new TIM data. TIM’s lower solar irradiance value is not a change in the Sun’s output, whose variations it detects with stability comparable or superior to prior measurements; instead, its significance is in advancing the capability of monitoring solar irradiance variations on climate‐relevant time scales and in improving estimates of Earth energy balance, which the Sun initiates”
I realize all that. Starting from a higher input value, how does that affect the amount of retained heat when as little as 4 or 6 w/m seem to make a big difference and we are talking about 8. That is a significant amount.
That is a significant amount
As the paper says: “TIM’s lower solar irradiance value is not a change in the Sun’s output” so
there is no change and no ‘significant’ amount. It is simply that the early data was wrong. A difference of 8 W/m2 corresponds to a temperature difference of 0.4 K in the absolute temperature of 288 K, which we cannot measure.
The 0.4 K lowers the initial result of 1.2 K to 0.8 K which takes it outside of the cause and effect.
No, not at all. The 288 K is uncertain because the albedo is uncertain. We simply cannot compute the temperature with any precision from TSi.
No wonder we are getting tons of rain in Tejas.
(/sarc. It’s due to that upper low that was initially parked over the 4 corners area for almost a week and is now parked over central CO.)
And by the way, several of the reference pages are not updating graphs. In particular the ENSO page. If I click on the graph to click through to the source site, the graph displays ok but when I display the page in WUWT, I get weeks old graphs even after clearing my cache. So it appears that the web server isn’t updating the graphics. But it isn’t limited to the ENSO page, the behavior is the same on other reference pages, too.
crosspatch, WP caches the image to a link when that link is first posted. It continues to display the cached image even if the image at the link has changed. That’s why you have to click on the WP cached image to bring up the current image at the link location. I wish there was a way to fix this problem. I’m not sure anyone but WP can fix it. The only work-around I have found is to publish new images with a new name and thus new link.
oz4caster, why does it seem the graphs stopped updating generally between 4 and 8 Apr? I can click on the graph and go to the current data but, all graphs seem to have stopped updating automatically in the 4-8 Apr timeframe. I look at the Sea Ice, Ocean, ENSO, Atmospheric, Tropical Cyclone and US Weather pages regularly. I can’t say much about the US Weather page, many of those links are broken, but all the other pages stopped updating between 4-8 Apr.
SMC, if you click on the image to view it at the source website and it is not current, that is not the problem I am describing. That means the source website is not updating the image. The problem I see is that WordPress makes a cache copy of the image at the source website when the link to the image is first posted. Then WP uses that cache copy again whenever that particular link is posted on a WP blog. However, if you click on the WP displayed image to view it at the source you will see an updated image provided the image has been updated at the source. In Firefox you can see the WP cached image by right clicking on the image and selecting “view image” and when the image displays on the screen you will see that the URL is for the WP cached image.
Yes, it is simply due to the large spot.
Interesting.
The historical records probably have counts of spots, but not size of spots.
It appears that any secular change in size of spots might bear on TSI.
You can find a record of the size of spots going well back into the record even before photography. They would draw and plot the spots as they counted them. Even Galileo recorded them with drawings.
http://obs.astro.ucla.edu/resource.html
Um … that photo of the sun was 10.75 inches in diameter on my flat LCD screen. the “spot” is about a quarter-inch. The ratio of the areas of the sun and the spot are 5.4e-4 (if I did the math right).
The ratio of 1361.1 (the value of the radiance – which I assume is an “area” quantity – prior to the glitch/anomaly) and 1360.25 (the anomalous reading) is 6.2e-4.
Those two values are within 20% or so, so – assuming my LCD screen measurements are within 20 % I’m betting on the sunspot for the moment.
My $0.02, and 60 seconds of cogitation.
A perfectly serviceable ROM (rough order of magnitude) calculation. It’s the engineer’s secret weapon.
Good enough for Climate Science, Mr. McGoo!
Also, AMO is going negative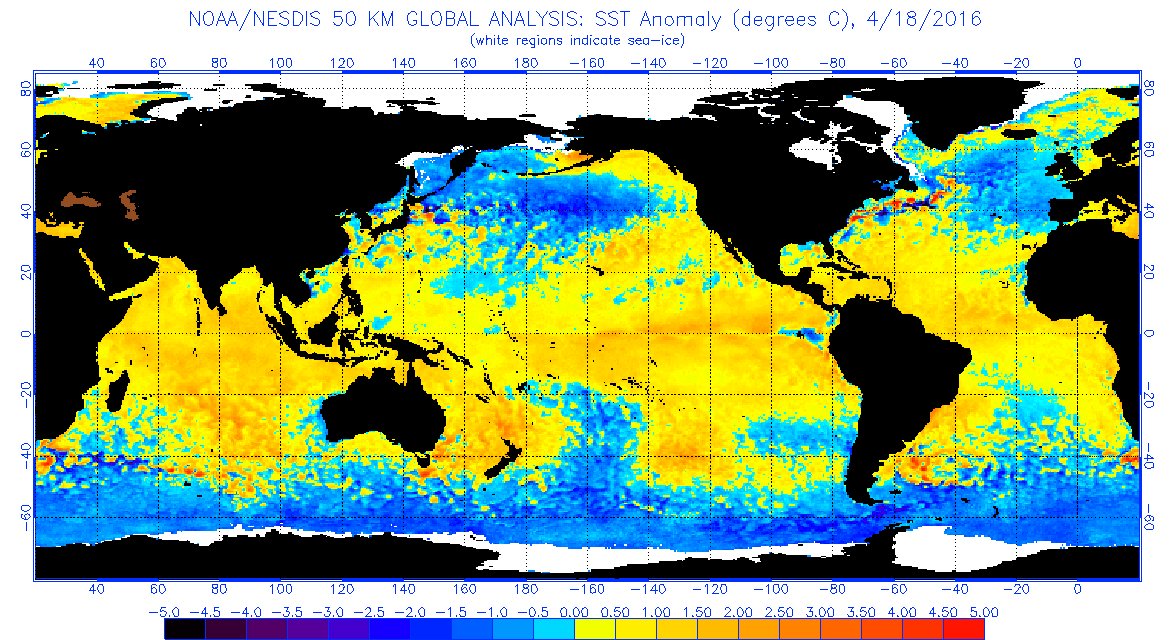
owen m (@omartin100), AMO data do not agree with your statement:

not quite there yet, will be by the end of the year imo.
Yes, key word is “going” and it is going to a major factor.
LOL, even the video of the Sun fails as it ends !!
I thought it was a Pacman…
It’s a hockey stick
I happened upon this graph two years ago. http://science.nasa.gov/media/medialibrary/2009/03/31/01apr_deepsolarminimum_resources/irradiance.jpg As you can see, the graph starts in 1975 and carry’s out to 2008. The high point as noted is near 1368 and the low point is near 1365. THKS to AGU Dec. 08 meeting. Now the graph above show a starting point near 1361.8 and a start date of Jan 16. Question where is the missing data from late 08 to Jan 16?
That should have been “.85 (the DIFFERENCE between the radiance reading and the anomalous reading)…
Would the coronal holes over the last week also impact TSI?
The coronal holes in SC24 (not mentioned in Dr Svalgaard’s PDF slides) was my first thought as well.
The coronal holes are not visible in ordinary sunlight, so makes almost no difference to TSI. The emission from the corona is a million times weaker than that from the photosphere.
Luke, there’s been a great disturbance in the (magnetic) force.
https://m.youtube.com/watch?v=UA0kNGaYrtg
Clusters of earthquakes in Japan, now Ecuador. Millions of voices crying out in terror.
Cue Vucekvic?
Earth imitates sci-fiction. The warmists’ hopes though that it will imitate their sci-fiction story are likely to be dissapointed though.
From today “spaceweather.com”
http://spaceweather.com/images2016/19apr16/coronalhole_sdo_200.gif
Last Thursday I cycled home and got wet. I got home just before a huge thunderstorm (huge for England that is). I hadn’t been checking sunspots recently and my first thought was “I wonder if the sunspot number is up”. And then I went to solarham.com, and saw that massive spot near the meridian.
Perhaps it was a coincidence. But I have noticed fewer thunderstorms here in the last few years, with the weaker sunspot cycle. Somebody oughta study the statistics of this properly…
Rich.
Still the drop is only 1W/m2. As a percentage of TSI 1361 W/m2….well about 0.0734%
someone recently postulated that a large change was not required, just a small plus or minus on the number required to maintain warming or cooling.
A straight line approximation given a -0.0734% TSI change to earth’s average temperature of approx 14°C or 287 K results in a calculated value of -21° C.
That is, a drop of .21°C would yield an avg Earth temp of 13.8°C (down from +14°C) for a change of TSI by -0.0734% (using a simple straight line approximation.)
How long a would such a slight drop take to get to your calculated value?
_Jim, I think you meant 0.21C (or K). That assumes the temp w/o a sun would be zero K, but the solar “neighborhood” in interstellar space is something like 20-30K or so, IIRC. Of course, the TSI will go back up quickly to the recent average.
Yeah, beng135, I caught it after I read it after posting it … too late, of course
It’s interesting that the last notable dip in TSI was in 2004 (obviously for the same reason) was there an earthquake recently?
We know that earthquakes are not caused by large sunspots, just as we know sunspots are not caused by earthquakes, so what else is happening towards solar minimum that both large sunspots and large planetary stresses in the form of earthquakes occur?
The large earthquakes are apparently caused by firstly abrupt changes in the interplanetary magnetic field and secondly by increases in the density and speed of the solar wind as it impacts earth. Both can be impacted by large coronal holes facing earth. The magnetic changes occur virtually instantaneously a coronal hole faces Earth and the solar wind effect from a coronal hole takes a couple of days to reach us. The biggest instability occurs when there has been a large solar flare a couple of days before a large coronal hole begins to face earth. According to Space Weather News the effect of such a coincidence will create the conditions for more large earthquakes in the coming days.
Incidentally the TSI must also be affected by size and location of coronal holes on the Earth facing side of the sun and there is a whopper there right now.
Yet no one does earthquake warnings based on.
There is a lot of work being done on this at present. A system is being set up to make short term predictions. Go to spaceweathernews.com and you can read about it. Also there are a number of papers about this in the New Concepts in Global Tectonics journals.
However, this has nothing to do with earthquakes…
TSI has dropped but F10.7 has spiked since 10 April and is expected (forecast) to remain elevated into May. Curious
http://spawx.nwra.com/spawx/27do_012965.gif
Current F10.7
http://spawx.nwra.com/spawx/f10_012725.gif
Note: Heavy (dark) lines are for the current 27-day Bartel rotation; light lines are for the last rotation.
F10.7 tracks sunspot numbers well, it may just be reflecting the large spot. There aren’t many spots in the group, so the sunspot number is a really low 28.
Nice to see people are paying attention to the sun.
I’ve had fun watching, recording, and learning from the TSI and solar activity in general lately; every morning I update my TSI sheet and look at all the solar parameters, and look at the earth and it’s response. Roughly ten days of relatively higher sunspot area that averaged 795/day is the sole reason for the TSI drop as so many others have pointed out.
Observations show that low TSI like today results in less evaporation in the tropical ocean.
http://i.imwx.com/images/sat/pacglobsat_720x486.jpg
Other than the recent Texas flooding, which fed off the heat in the Nino 1+2 area, there is now very little rain-generating cloud formation being created near the US, leading to drier skies in the US. I’ve been waiting for this condition to arrive to record it, and to see how much ocean evaporation occurs as TSI rises again. As TSI comes up off the floor I expect more nearby ocean evaporation, moisture and energy that will lead to more rainfall, wind storms, hail storms, and tornadoes in the US.
A problem we have is there are no annual TSI plots archived on the net that we could look closer at individual years, to compare situations, such as 2004, a good analog year in SORCE TSI. I’ve already made those plots for myself and intend to make them available along with PMOD and SORCE monthly averages.
SORCE dropped from the second position on this list at the start of the year to below 2012 now:
Year 1au TSI F10.7
2015 1361.4321 117.5
2014 1361.3966 145.8
2013 1361.3587 122.8
2012 1361.2413 119.9
2016 1361.2178 98.9
2011 1361.0752 113.4
2003 1361.0292 127.4
2004 1360.9192 106.5
2010 1360.8027 80.1
2005 1360.7518 91.7
2006 1360.6735 80.0
2007 1360.5710 73.1
2009 1360.5565 70.6
2008 1360.5382 69.0
At the rate we’re going, 2016 TSI could end up below 2004 or 2010 levels – and temps will follow.
http://lasp.colorado.edu/data/sorce/tsi_data/daily/sorce_tsi_L3_c24h_latest.txt
” there is now very little rain-generating cloud formation being created near the US, leading to drier skies in the US.”
I don’t understand this comment? Have you taken a look at US national RADAR today? Then look at a WV loop – see that big low centered over Colorado?
US RADAR:
http://radar.weather.gov/Conus/index_loop.php
WV (water vapor) imagery Loop:
http://weather.rap.ucar.edu/satellite/displaySat.php?region=ABI&itype=wv&size=large&endDate=20160419&endTime=-1&duration=9
Jim, I was specifically referring to the low ocean evaporation off the US southern coast during the past weeks. That does not preclude other water vapor pathways or weaker contributions to storms from that area.
The US has recently enjoyed mostly dry and warm weather where the UV index was the highest for the day:
http://www.cpc.ncep.noaa.gov/products/stratosphere/uv_index/uvi_map.gif
http://i.imwx.com/images/maps/current/acttemp_600x405.jpg
The April tornado count is down by 70% this year, based on a twenty year average, the second lowest level in that time, from less tropical evaporation entering the US –because TSI has tanked.
After TSI ramps up again we should see more tropical evaporation and an uptick in tornadoes.
” The US has recently enjoyed mostly dry ”
Not a true statement, at least without any qualifiers. Take a closer look at the southern tier of states for the last month or two for instance.
I work the 160 meter band which is THE most affected ‘ham’ band by lightning discharges. We’ve had the usual reduction of the number of nights we can operate on account of storm, as per normal in the spring. I experience first hand the effects of any thunderstorms the lower 48 and esp the south and central states experience.
Just a couple weeks ago we kicked out our previous rain-producing, pinwheeling ‘low’ up and out to the northeast, and we’ve been dealing this last week and a half with another ‘low’ presently moving slowly east through Colorado. These lows kick off a lot rain from their spiraling outward moving arms or bands.
This also might be of interest – the QPF or “Quantitative Precipitation Forecasts” webpage by NOAA:
http://www.wpc.ncep.noaa.gov/qpf/day1-2.shtml
Sorry mods, I’m still learning how this wordpress account works… My last comment was meant to go in under my name not the wordpress account name…
Interesting timing that this drop in tsi is occurimg at about the same time as the ice increase.
Since our chosen task is to create an audit trail from the Sun’s irradiance to our surface temperature , it’s useful to learn of this link . I’ll have to find time to check whether these data confirm the peri- to ap-helion variation one must expect . Are the data really accurate to over 4 decimals ?
I like to think in terms of temperatures so these numbers induced me to implement the conversion of Power to Temperature in 4th.CoSy :
: P>Tsb ( P -- T )  5.6704e-8 _f %f .25 _f ^f ;

  f( 1361.6 1360.4 )f 4. _f %f P>Tsb   |>| 278.35 278.29
It ain’t as clean as a traditional APL yet because it’s working down at the x86 stack level , but it’s getting there .
So that represents a 06c change in equilibrium temperature .
In human language, the first order temperature change dT from a change in solar irradiance dS is (differentiating the simple equation between solar irradiance, albedo and the surface’s Stefan-Boltzman law)
dT/T = dS/4S
so dT ~ 0.1 degK/(W/m2).
Our climate simply isn’t very sensitive to changes in solar irradiance.
Every planet in our solar system is sensitive to our star, if by ‘solar irradiance’ you mean a fraction of a much larger natural system, you are forgiven in err as usual, but if you mean TSI has no role and is not a factor, you are banished to the corner of stupidity!
Well the number of other planets in our solar system that have most of their surface covered with liquid H2O oceans, can be counted on jut two hands.
The negative feedback due to cloud forming liquid H2O oceans can largely negate changes in TSI over climate intervals of time.
If you don’t have evaporative cloud producing oceans, you are at the mercy of TSI changes.
G
A negative cloud feedback? From what I’ve been able to ascertain, the net cloud feedback is likely positive:
Dessler, A.E., A determination of the cloud feedback from climate variations over the past decade, Science, 330, DOI: 10.1126/science.1192546, 1523-1527, 2010.
Dessler, A.E., Observations of climate feedbacks over 2000-2010 and comparisons to climate models, J. Climate, 26, 333-342, doi: 10.1175/JCLI-D-11-00640.1, 2013.
“Observational and Model Evidence for Positive Low-Level Cloud Feedback,”
Amy C. Clement et al, Science 24 July 2009: Vol. 325 no. 5939 pp. 460-464
DOI: 10.1126/science.1171255.
Zhou, C., M.D. Zelinka, A.E. Dessler, P. Yang, An analysis of the short-term cloud feedback using MODIS data, J. Climate, 26, 4803-4815, doi:10.1175/JCLI-D-12-00547.1, 2013.
Dessler, A.E., Cloud variations and the Earth’s energy budget, Geophys. Res. Lett., 38, L19701, doi: 10.1029/2011GL049236, 2011.
Stand back folks, an out of work PhD physicist has spoken.
Dave, I propose an experiment. Let’s turn off the sun and see what happens?
” Dave, I propose an experiment. Let’s turn off the sun and see what happens?”
I’ve been looking at that for years, what happens is temps fall like a rock until it comes back on.
In fact it’s off right now!
george e. smith on April 19, 2016 at 5:41 pm
Well the number of other planets in our solar system that have most of their surface covered with liquid H2O oceans, can be counted on jut two hands.
________________________
Planets and moons –
Thanks – Hans
I’ve commented before that Appell seems to have chosen to be my personal troll spamming posts I make almost anywhere on any subject with generally cut and pasted repeats of failures-to-understand asked and multiply answered long ago . Here’s a recent round : https://disqus.com/home/discussion/thedailycaller/dem_praises_essay_arguing_deniers_deserve_punishment_the_daily_caller/#comment-2622662013 :
Can anybody tell me what the gibberish he posted here means ?
dT/dPis not constant . Plugging the Power > Temperature Stefan-Boltzmann equation into http://www.derivative-calculator.net/ to save thought and error , we are reminded the 4th root turns into a -3%4th power . So here are the equations translated to 4th.CoSy .: sb ( -- StefanBoltzmanConstant ) 5.6704e-8 _f ;
: P>Tsb ( Power -- Temperature ) sb %f .25 _f ^f ; | SB power to temperature
f( 1361.6 1360.4 )f 4. _f %f |>| 340.39 340.10
| insolations divided by 4 for conversion from disk to sphere .
R0 P>Tsb |>| 278.35 278.29 | Orbital Gray body temperature
| NB: This is the equilibrium temperature equivalent to the measured
| insolation before any consideration of spectrum . It applied to any
| gray body however dark or light . It is the temperature which must be
| matched by any temperature profile as one leaves the atmosphere .
| ( R0 contains the full precision result of the last execution )
: dP>Tsb ( Power -- dT ) sb %f .75 _f ^f sb 4. _f *f *f 1%f ;
| derivative of T at a specific Power(s)
340.1 _f dP>Tsb |>| 0.20
| Bit of rounding by the difference between the input powers :
340.4 340.1 2_f -f |>| 0.3
0.2 _f 0.3 _f *f |>| 0.06
| matches previous direct computation
Again , sorry for all the
fs to convert numbers on the Forth stacks to CoSy float lists . But you can understand my priority to involve other heads in 4th.CoSy to help polish off all these irritations . It should be noted that these functions will operate on a list of a million values as simply as one or two .WRT Appell : I knew some pretty mediocre fellow grad students when studying psychophysics at Northwestern way back . But I think Appell embarrasses the Stony Brook physics department and his purported advisor George Sterman if they in fact gave ( and that’s the operant word ) him a PhD .
I’m going to say something wrong here lol but one thing you will become familiar with when employing massive data changes is the timing of your data because the time scale also changes, and when that happens, where an event can’t accurately be associated with a circumstance, then a process of elimination can not be sought.
Does this mean that during a solar minimum the total solar irradiance should be at its maximum?
You got this one lol
Does Maunder Minimum = Little Ice Age still hold?
“Does Maunder Minimum = Little Ice Age still hold?”
No. The LIA was probably caused by a series of volcanic eruptions & feedbacks:
https://www2.ucar.edu/atmosnews/news/6338/study-may-answer-longstanding-questions-about-little-ice-age
So Global Warming is the normal state where there is no massive set of volcanic eruptions?
Such virile certainty Dave! Ooh! Shivers ran up my spine.
So, your thinking would be that a 500 year cooling trend was cause by vulcanism?
Can you use the words “may answer” in a sentence?
David Appell (@davidappell) April 19, 2016 at 8:46 pm
No. The LIA was probably caused by a series of volcanic eruptions & feedbacks:
Note the paragraph below is from your link.
“The team used the Community Climate System Model, which was developed by scientists at NCAR and the Department of Energy with colleagues at other organizations, to test the effects of volcanic cooling on Arctic sea ice extent and mass. The model, which simulated various sea ice conditions from about 1150 to 1700 A.D., showed several large, closely spaced eruptions could have cooled the Northern Hemisphere enough to trigger the expansion of Arctic sea ice.”
Now after reading the phrase “closely spaced eruptions could have cooled the Northern Hemisphere” you come realize that the authors could have substituted meteor or comet strike.
David you give no proof for your statement. The link is DOA.
michael
Mike, the study “used analyses of patterns of dead vegetation, ice and sediment core data, and powerful computer climate models”.
Powerful climate models and dead vegetation! This is the sort of stuff to conjure with. Not like the wimpy climate models we have today, real, Manly climate models! We’re talking top shelf here! All expenses paid! No rock left… where ever it was!
So show some damned respect!
/sarc
BTW Mike, the /sarc tag was for Dave, I didn’t mean to insult you but he’s historically had trouble with it.
Bartleby April 19, 2016 at 10:23 pm
But of course I knew I’m still Laughing.
Now about that ” Community Climate System Model” , what might that conjure up for visual effects? At first my fascination was drawn to south sea island girls dancing at the base of a volcano, “but then I woke up”. Realizing it was more akin to something one would find in a dingy roadside rest stop… Use at own risk and use copious amounts of disinfectant after words?
michael