Guest Post by Willis Eschenbach
In my continuing wanderings through the regions cryospherical, I find more side roads than main highways. In my last two posts here and here, I discussed the curious inverse relationship between temperature and ice accumulation rates in Greenland and Antarctica.
Wanting to understand the changes in the polar oceans that occur when the sea ice forms, I got to wondering about the albedo changes between sea ice and water. Obviously, ice reflects more sunshine than water does … but how much more does it reflect? It is important because the more the ice melts, the less solar energy is reflected, the warmer the ocean becomes, and this melts even more ice, and so on. This is a positive feedback called the “ice-albedo” feedback, which will tend to increase a given warming. Naturally, the size of this ice-albedo feedback is of interest.
To start with, I looked at the relationship between the “clear sky” albedo and the ice coverage. The clear sky albedo is the albedo measured by the CERES satellite at the top of the atmosphere when there are no clouds in the sky, so it is an estimate of the albedo of the surface itself. Figure 1 shows the relationship between the two variables, for all 1° latitude by 1° longitude gridcells which have ice during some part of the year.
 Figure 1. Ice coverage as a percentage of gridcell area (horizontal axis) versus clear sky albedo (vertical axis). The data is composed of the 12 monthly averages for each gridcell. There are 11,646 gridcells (1°x1°) which contain sea ice at some point during the year, meaning that the total number of data points N is 139,752.
It is clear that as the ice coverage increases, so does the albedo. And there is a fairly steep relationship, going from a polar ocean albedo of about 25% with no ice to an albedo of about 55% with complete ice coverage. This is an albedo change of about 30%.
However, that’s just the surface albedo. Of more interest is the “all sky” albedo, which includes the clouds. In Figure 2, I have added the all sky data in blue to the clear sky data shown in Figure 1.
 Figure 2. Ice coverage as a percentage of gridcell (horizontal axis) versus both clear (red) and all sky (blue) albedo (vertical axis). The data is composed of the 12 monthly averages for each gridcell. There are 11,646 gridcells (1°x1°) which contain sea ice at some point during the year, meaning that the total number of data points N is 139,752.
The most obvious change is that the slope of the all-sky data (blue) is much less than that of the clear-sky data (red). Rather than a 30% albedo change from no ice to full ice, in the real world there is only about an 18% albedo change from no ice to full ice.
I was surprised to find that the clouds are brighter (greater albedo) than the ice itself. At all different amounts of ice coverage, including 100%, the albedo with clouds is greater than the surface albedo of just the ice itself. (I haven’t thought through all of the ramifications of this finding, I’m just pointing it out.)
However, this still doesn’t tell us just how much extra energy is reflected by the ice. The problem is that in each hemisphere the ice is at its largest extent when there is the least sunlight and vice versa. So what I did was to actually calculate the amount reflected based on the relationship given by the black line in Figure 2, which shows that the change in the albedo is equal to 0.18 times the change in the ice coverage. I calculated for each gridcell just how much difference that ice-based albedo change makes given the variations in the incoming sunlight. This will not be exactly accurate, but is certainly close enough for a first-cut analysis, and is shown in Figure 3 below.
 Figure 3. Monthly averages of the total solar reflection from the entire globe (black) and the amount of the reflection that results from the existence of sea ice.
Here we finally have what I started out to find. This shows that on average, sea ice is only responsible for 1.1% of the total solar reflection. This is the result of what I mentioned above, that when there is a lot of ice there is little sun, and vice versa.
Finally, remember that the blue line is the full effect of the existence of sea ice. Let us assume that we get say a 10% reduction in sea ice. This will have 1/10 the effect of the full change, or about a tenth of a percent of the total reflections.
As a result, I’ve gotta say that on a global level at least, even a 10% change in the amount of sea ice makes very little difference to the total reflections. It only makes the total global reflections vary by a tenth of a percent. Now conveniently, total global reflections are about 100 W/m2, so that means that averaged over the planet, if all the sea ice disappeared it would only make a difference of 1 W/m2 in the global reflections … and this means that a 10% change in sea ice amounts to a globally averaged change of 0.1 W/m2
And this, of course, means that the effect of the ice-albedo feedback is vanishingly small globally. It is certainly possible that it makes some larger difference in the immediate neighborhood of the ice, but in terms of a global effect, it is what I call a third-order variable.
Ranking the variables is my own system for trying to understand what is important in a system. I divide variables in a system into first, second, and third order variables. A first-order variable can change the output measurement by greater than 10%. If for example we’re talking about solar reflections, the clouds are obviously a first-order variable.
A second-order variable can change the output by between 1% and 10%. Regarding solar reflections, an example of a second-order variable is snow cover.
Finally, we have third-order variables, which are those that make a change of less than 1% in the output measurement. That is why I said that variations in sea ice reflections are a third order variable. And typically, third-order variables can be ignored in all but the most accurate analyses … and generally we can’t do analyses anywhere near that accurate in climate science.
Anyhow, that’s what I found out about the size of the ice-albedo feedback … it is a third-order variable, so small that it disappears in the noise.
Jupiter burning in the midnight sky, ah, dear friends, another springtime is upon us here, it is good to still be on the upper side of the grass.
My best wishes to all,
w.
My Usual Request: Misunderstandings destroy communication. If you disagree with me or anyone, please quote the exact words you disagree with, so we can all understand the precise nature of your objection. I can defend my own words. I cannot defend someone else’s interpretation of some unidentified words of mine.
My Other Request: If you think that e.g. I’m using the wrong method or the wrong dataset, please educate me and others by demonstrating the proper use of the right method or the right dataset. Simply claiming I’m wrong doesn’t advance the discussion.
I don’t see anything in this analysis that considers the angle of the sun at the poles. The albedo of the sea surface should depend on the angle of the incident sunlight – not just the watts/Meter2 intensity of the sunlight. Was that considered and I just missed it?
The angle is assuredly considered in the calculation of the CERES data of reflected sunlight.
w.
Willis, none of this data processing is “assuredly” anything ( apart from wrong ). Sometimes there are some pretty stupid assumptions, sometimes less stupid but always lots of assumptions and simplifications.
When I looked at ERBE in detail I came out screaming. You don’t see this in the nice simple time series they put out for general consumption:
https://climategrog.wordpress.com/erbe_tropical_sw_phase_drift_adj/
That massive hump is an alias of the daily cycle, introduced by them assuming constant cloud cover throughout the day in the tropics in doing the SW extraction !!
I’m sure you know how realistic that is.
I have no idea why it does the 3-2-3-2 pattern on top of that but I would not mind betting is just another alias. They *mask* this by taking 36d averages.
As you know there is also a massive TOA imbalance in CERES. I’m not very ‘assured’ by any of this.
The problem is there will be quite a bit of low incident reflection that is not captured by measurements assuming an even, diffuse reflection.
How that is handled I don’t know, but I would guess that quite a lot of out-going reflected solar in not getting counted in clear sky situations.
If they do start getting some stronger readings when the satellite is nearing a position where it would pick it up, I would not mind betting that the readings get excluded by some kind of automatic QA algo that eliminates anything > 2 std dev away from the mean.
Again in looking at ERBE data around Mt P event, there was some data getting thrown that looked like it may have been legitimate deviations.
Willis Eschenbach April 2, 2016 at 9:57 pm
Greg April 3, 2016 at 12:29 am
Thanks, Greg. I fear you have not done your homework. As with most of these types of datasets, there is fairly extensive documentation of how the processing is done. One piece of it is here. And if you read it, you’ll find that yes, OF COURSE they consider the solar angle when calculating albedo, you can’t do it any other way.
For a list of a host of other papers discussing this issue, try googling the following
Best regards,
w.
Willis,
Thanks for the link to (CERES_EBAF_Ed2.8_DQS-1.pdf) as well as the “google search” suggestion. That along with the link provided by Greg http://ceres.larc.nasa.gov/atbd.php has been very interesting reading. I would likely be out of my league to respond but there my be some issues with the certainty of the values in the data (at least from my point of view). This is not meant as a takeaway from your using data in lieu of modeled “data”.
Please keep in mind that I’m just a serious ‘lurker’. I hope there will be other discussions with regards to the CERES data.
Just sayin’.
Willis: Very interesting analysis. You wrote: “This is the result of what I mentioned above, that when there is a lot of ice there is little sun, and vice versa.” This statement appears to be incorrect for sea ice. The maximum and minimum extent of sea ice occur near the spring and fall equinoxes. This is when an AVERAGE amount of radiation is being received. So solar radiation and sea ice coverage are 90 deg out of phase with each other. Lots of sea ice remains near the summer equinox when incoming SWR is strongest. (This doesn’t mean that your calculations are quantitatively wrong. The generalization you use to explain your results is misleading.)
Seasonal snow cover responds more quickly to changes in irradiation. However, as best I can tell, your post deals only with the global impact of areas covered by sea ice, not seasonal snow cover.
(One interest fact about ice-albedo near the poles is that almost all of the solar radiation is indirect, not direct. Indirect radiation is due to scattering by particles in the atmosphere and comes from all directions. There are no strong shadows at the poles, just like there aren’t near sunrise and sunset at lower latitudes when sunlight must pass through a lot more atmosphere. This is important because the albedo of ice and water varies with angle and effects those who calculate the expected change in albedo. You sensibly are relying on observations, not theoretical calculations.)
Frank April 2, 2016 at 9:57 am
In the Northern Hemisphere, the peak ice is in February when there is very little sun, and the minimum ice is in August when there is lots of sun. Sorry, but my statement is true—when there is a lot of ice there is little sun and vice versa.
w.
Willis: This graph (from the WUWT Sea Ice Page) shows that the minimum and maximum sea ice for the Arctic are in mid-September and mid-March, very near the equinoxes. Note the large amount of sea ice in May and June. Coverage doesn’t drop below average (about 10 million km2) until July when solar insolation has begun to drop. As I said above, almost 90 deg out-of-phase.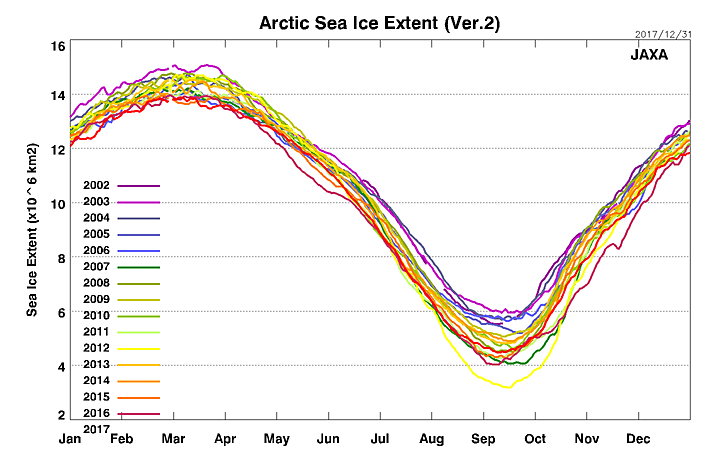
Arctic sea ice minimum is usually 2nd to 3rd week of Sept, not August. I would say his estimation of 90 degree phase lag is not too far off. Not surprising when ice area is simplistically at least an integration of the solar input.
However, I don’t thinks his assumption that the equinox are “average” points in the cycle is correct. It is not nice even sinusoid. Solar input is one bump of a cosine with a long flat section. The cut off dependant up on latitude.
Thanks Frank you beat me to draw as I was typing.
Albedo? Thanks Willis for this post – I actually had to look up the word albedo. Just some basic questions:
At what angle of the sun to ocean water is the reflection equal to the absorption? Is incoming light and incoming solar radiation (heat) equal to each other as far as reflectivity?
I assume that the sun at 90 degrees above the ocean reflects about 10% of the light (and I assume solar energy ie. heat is the same) When the sunlight comes in at say 5 degrees above the horizon, how much light is reflected and how much is absorbed? Is it the same for solar heat energy at that angle? Also is it the same if the ocean is rough (with whitecaps) vs smooth ocean water?
I never studied this, but am just fishing for information. My first reaction is that the nearer the ocean water is to the North (or South) Pole the less the angle of solar light/radiation to the water and therefore the lesser the water’s absorption of incoming radiation.
I know a lot of this has already been discussed, but these were my thoughts as I was reading the post.
Willis: Many readers may confused by the units you use in Figure 3 (PW 1 E15 W). Usually we discuss heat fluxes in terms of W/m2. Given the surface area of the planet (510,072,000 km2 or 5.1 E8 km2 or 5.1 E14 m2), means that 1 PW is 2 W/m2 and that Solar Reflectance (the black line) is about 100 W/m2 – which is the normal value. So the sea ice reflectance is 1.1% of that value or about 1 W/m2. That number is much easier to for me to think about.
The IPCC’s best estimate for ice-albedo feedback is 0.3 W/m2/K. If ALL of this feedback came from loss of sea ice, 3 degK of global warming would produce 1 W/m2 more reflected SWR. However, your 1 W/m2 value is a combination of surface albedo and cloud albedo feedback over areas covered by sea ice. Increasing clouds cover neutralizes about half of the change in surface (30% vx 18%), so your surface albedo change due to sea ice is about 1.6 W/m2. In that case, if ALL of this feedback came from loss of sea ice, 5 degK of global warming would produce 1 W/m2 more reflected SWR. If half of ice-albedo feedback come from loss seasonal snow cover and ice caps on land, then 10 K of warming would be needed would produce 1.5 W/m2 less reflected SWR from sea ice.
So, do you agree that nothing in your results that suggests that the IPCC’s value for ice-albedo feedback is unreasonable.
Thanks, Frank. You ask:
Nothing in my results is related in any way to the IPCC value, because they are discussing something totally different from what I measured. They are discussing the change in albedo not just from ice but from snow as well. Have patience, I haven’t gotten that far yet. I need to first write the code to decode the Rutgers snow data, which is in a strange equal-area format and I need it in a 1°x1° gridded format to analyze it. It’s just “SMOP” as we used to say, a Small Matter Of Programming.
You also say:
OK … I guess, I haven’t run the numbers but that looks about right. Not sure I understand what your point is here though. Surface albedo alone is not relevant, the total albedo (all sky) is what is actually present in the real world.
Best regards,
w.
Willis: The IPCC chooses to divide “albedo feedback” into cloud feedback and ice-albedo (surface) feedback. You have chosen to combine both in polar regions covered by sea ice. There is nothing “wrong” with either approach, but by combining them you lose the ability to compare with the IPCC’s values. The IPCC’s values come from climate models, which are underestimating loss in the Arctic and failing to predict gain in the Antarctic. Your numbers come from observations and therefore are interesting to compare with the IPCC’s. I’m looking forward to the land analysis and combining them.
Given the vast differences between the Antarctica and Arctic, it might be interesting to see if they are behaving in the same manner.
Willis: I have a frustration in my personal life, regarding “housing” right now. It is NOT a crisis. BUT I am an “experimentalism” person at heart. (Despite the extensive engineering background.) And something just dawned on me in the last few weeks..which needs a “constructed device” which demands several tens of hours of work…but could be very revealing. I present it to you to either do it, or find someone who has. This would be similar to the 1910 Robert Woods “greenhouse” experiment, but a minor twist. To build a “Solar Collector” with a PTFE (I believe that is the RIGHT longwave transparent material to use) top. A sealed device, festooned with thermocouples.
First to run it a a set angle and a set time. The angle might have to vary slightly, day to day to make
an “even” solar input.
It would have AIR with a measured humidity in it (30% RH at RT to start?) Then, to run it in a parallel condition, with CO2 and 30% RH in it (or the same amount of water total.)
My guess is, the temperature profile will be virtually IDENTICAL. This will validate the concept that
97% of IR trapping is H2O and also H2O is the primary upflux agent.
This simple experiment would show that CO2…at levels we may POSSIBLY experience has a complete and tolerable limit with regard to the IR balance shift (or rather that it will be miniscule)
Yours,
Max
the only problem is this experiment doesnt test the Green house effect.
Yes it does. AND the problem with your comment Mr. Steve is that it it ISN’T the “greenhouse effect”. I refer you to pages 232 and 233 of Fleagle and Businger (Introduction to Atmospheric Physics) as found here: http://geology.lnu.edu.ua/phis_geo/fourman/library-Earth/An%20Introduction%20to%20Atmospheric%20Physics.pdf Get your terminology right, and then we’ll discuss particulars!
I call these people Water Vapour Convection Cooling ‘deniers’!
And I advise them to look at the behaviour of clouds over the equatorial oceans.
The idea that raising the levels of (the poorly named) Greenhouse gas CO2 to 1/25th part of ONE percent of the earth’s atmosphere could impact on this almost unimaginably powerful planetary heat transfer system is laughable. Like homeopathy is to real medicine!
Indeed, radiation worshipers fill the pews in “climate science, while the dominant mechanism in cooling the surface–moist convection–is barely understood by self-ordained high priests. Max Hugoson is spot on in pointing to the passage in Fleagle & Businger that warns: “However, it is not commonly recognized that,
whereas the absorbing effect of the atmosphere results in temperatures well above what they would be without an atmosphere, the high temperatures in a greenhouse are not to be attributed to absorption of long-wave radiation by the glass.” Real-world heat transfer is by no means that simple!
Max, I fear that Mosh is right. The experiment won’t test the greenhouse effect.
To see why, you might start by reading my two posts entitled “The Steel Greenhouse” and “People Living In Glass Planets” for an introduction to how the poorly-named “greenhouse effect” works.
Then you could move on to my analysis called “The R. W. Wood Experiment“, to see where Wood went wrong.
If after you do that you still think your experiment will test the greenhouse effect, come back and explain why and we can discuss it.
Best to you,
w.
PS—You say, in a most ungenteel manner:
On my planet, some arrogance is acceptable and perhaps unavoidable if the person is right … but on any planet it looks really bad if the person is wrong, as in this case. Fleagle and Businger, writing in your citation, call it the “atmospheric effect”. However, they also say:
and
So even your own citation calls it the “greenhouse effect” and says that the term continues to be more widely used than “atmospheric effect” … and that was in 1980. Here in 2015, nobody except for nobody calls it the “atmospheric effect”, it’s the first time I’ve even heard the term.
So as an acquaintance of mine once remarked … “Get your terminology right, and then we’ll discuss particulars!”
w.
Very good, Willis, as usual. I’ll give a couple of my thoughts on positive feedback. I started modeling when the only computer available to me was analog (an EAI PACE 231R, for those of you who are also older than dirt). These operated with vacuum tubes, which often failed. Tube failures were announced by a loud horn which warned the user and repair technician (and every one else in the room) that all subsequent results were to be ignored. An operating simulation that drifted to its control limit (100v.) would also turn on the horn.
Any integration loop with positive feedback would also QUICKLY and LOUDLY sound the horn. The only question then became “did the operator screw up, or did a vacuum tube fail”. Operator screw-ups were typically an integration loop with positive feedback. A beginning programmer would quickly, loudly, and often, announce his incompetence, to everyone in the room.
The point is that positive feedback will usually quickly be driven to its limit of control. Think of a thermostat that turns the furnace off, instead of on – it’s all over, once you feel cool. Granted, in a complex control system with a multitude of variables, other factors can possibly compensate. But positive feedback also, can quickly overcome a whole lot of subtle interactions. In a climatic situation with several billion years to stabilize, it’s difficult for me to believe that anything but negative feedback dominates the control buttons.
“In a climatic situation with several billion years to stabilize, it’s difficult for me to believe that anything but negative feedback dominates the control buttons.”
Bingo in the universe of reality!
Great work, Willis. Sacred cows are braying.
Willis –
What influence will angle of incidence of incoming and reflected energy have? Some of this gets reflected out to lower latitudes during a good part of the year. It will fall outside your window right?
Nature never makes it easy 🙂
I suggest that wuwt readers that think as much of Willis Eschenbach as I do write to their congressman and direct to the National Science Foundation and suggest they give him $100,000 grant, unrestricted other than the work be related to climate science. They’d get results equal to any $10,000,000 they ever spent.
Seconded.
I think this means I can quit worrying about ice melt due to carbon soot causing global warming or sea level rise.
Maurice Ewing was of the opinion that reduced (winter) Arctic sea ice cover enhanced heat transfer between the Ocean and Space.
Willis wrote: “And this, of course, means that the effect of the ice-albedo feedback is vanishingly small globally. It is certainly possible that it makes some larger difference in the immediate neighborhood of the ice, but in terms of a global effect, it is what I call a third-order variable.”
A closer look shows this statement is grossly wrong.
How much has global sea ice changed? The WUWT sea ice page says that global sea ice has declined perhaps 2 million km2 since 1979 or about 10%. However, the signal is very noisy. In 2014 and early 2015, sea ice coverage was about the same as in the 1980s. Most of the time, however, it has been lower. . Although a value between 5% and 10% decline might be more appropriate, I’ll stick with 10% for simplicity and readers can easily adjust my calculations to suit their views. During the same period, GMST has risen about 0.5 K. So we can say that global sea ice coverage changes about -10%/0.5 K or -20%/K. This predicts that all sea ice will be gone when GMST has risen 5 K – a reasonable estimate when considered in terms of GMST 30 million years ago when there were no polar ice caps or sea ice. Using the information in this post, this reduction is about -0.3 W/m2/K without including cloud feedback above the sea ice or -0.2 W/m2/K if you include the cloud feedback over sea ice (as Willis did).
http://wattsupwiththat.com/reference-pages/sea-ice-page/
-0.3 W/m2 is the IPCC’s best estimate for ice-albedo feedback, so Willis and the IPCC are roughly in agreement here. Ice-albedo feedback includes reduction in seasonal snow coverage and ice caps, so the information in this post actually suggests an ice-albedo feedback that could be MORE negative than -0.3 W/m2. So why is Willis telling us that ice-albedo feedback is unimportant, when the IPCC takes it very seriously?
Here Willis is getting approaching “Big Lie” territory, because AGW is all about climate sensitivity – the change in GMST with a change in forcing (W/m2). Ice albedo feedback contributes to climate sensitivity. For clarity, let’s first discuss climate sensitivity in terms of K/(W/m2) rather than the familiar K/doubling. An ECS of 3.7 K/doubling (roughly the IPCC consensus) is 1 K/(W/m2). For those who think energy balance models provide a more realistic estimate (Otto et al, Lewis and Curry), ESC is about half this value or 0.5 K/(W/m2). Those who don’t believe any feedbacks exist are saying ECS is no worse than 1 K/doubling or about 0.3 K/(W/m2). These numbers make more sense physically if we consider their reciprocal, called the climate feedback parameter, which is about 1, 2 or 3+ W/m2/K (for the consensus, lukewarmers, and non-believers.) The climate feedback parameter tells us how much more NET radiation escapes to space for each 1 degK rise in surface temperature. The S-B eqn tells us that a blackbody near 255 K has a climate feedback parameter of +3.2 W/m2/K. To obtain the earth’s climate feedback parameter, we need to add the other feedbacks to Planck feedback (with negative signs for feedbacks that decrease OLR or increase absorbed SWR. Surface albedo decreases absorbed SWR.) Then we take the reciprocal to get climate sensitivity in K/(W/m2) and multiply by 3.7 W/m2/doubling.
So we need to consider how important an ice-albedo feedback of -0.3 W/m2/K (or more negative) is on a planet where the climate feedback parameter is 1 or 2 or at least 3 W/m2/K. We are talking about a 30%, 15% or up to 10% contribution to the planet’s climate feedback parameter. By Willis’s definition, ice-albedo feedback is a “first-order variable” from the consensus, lukewarmer, or non-believer perspective.
So how can Willis fool us so easily? GMST is 288 K. A 1% change in GMST is huge. GMST is the result of 240 W/m2 of post-albedo SWR. From the S-B equation for a blackbody, we can derive the relationship dW/W = 4*(dT/T). In other words, a 4% change in radiation produces a 1% change in temperature. The earth doesn’t behave like a blackbody. If climate sensitivity were 4 K for a doubling of CO2 – 4X the “climate sensitivity” of a blackbody, then the relationship becomes dW/W = dT/T. A 1% change in radiation produces a 1% change in GMST. If you are a lukewarmer, a 2% change in radiation produces a 1% change in GMST. If one keeps these simple relationships in mind, it is easier to not be led astray.
The other trick is that Willis presented sea ice change without discussing the warming that produced it – as a forcing (W/m2) rather than a feedback (W/m2/K). If you want to understand the importance of feedbacks, you need to think in terms of the climate feedback parameter – roughly 1, 2, or 3+ W/m2/K depending on your perspective – rather than climate sensitivity.
Of course, the situation is complicated. Relatively little warming is occurring in Antartica (except for the Peninsula) and sea ice is generally increasing there. Much more warming is occurring in the Arctic, where sea ice is generally decreasing. Natural variability is huge in both locations. Fortunately, Willis was brilliant enough to study at the relationship between reflected SWR and sea ice coverage throughout all of this natural variability. If done correctly, all my calculation would have large confidence intervals. But confidence intervals won’t make ice-albedo feedback is a “third-order variable”.
Frank,
Putting aside the rather rude tone of your comment (which I think completely inappropriate), you should re-think your calculation, which is simply mistaken. A change in albedo of 1.1% of the total current albedo (assuming a 100% loss of sea ice) is identical to a net change in solar intensity of 1.1% of 30% of the current solar flux, or about 0.011 * 0.3 * 1365/4 = 1.12 watt/M^2 averaged over the earth. We can compare this to the estimated forcing from a doubling of CO2…. about 3.7 Watts/M^2. So complete loss of sea ice would generate roughly 1.12/3.7 = 30% of the forcing from a doubling of CO2. If you want, you can look at it in an even simpler fashion: Based on climate sensitivity of 1C per watt/M^2 (the average of GCM’s) an increase in solar intensity of 1.12 Watt/M^2 (equal to the complete loss of sea ice) would yield an equilibrium warming of about 1.12C. If empirical estimates of sensitivity are correct (sensitivity a bit under 0.5C per watt/M^2), then the expected rise from a 1 watt/M^2 increase in solar intensity would be ~0.56C. More realistic losses of sea ice, say 25%, would of course lead to proportionally lower warming effects. Willis is correct in his analysis: modest changes in sea ice are not that important globally. There could be more important local effects, since the local change in solar flux is much higher than the average.
Hi Willis, trying to understand something you said.
“I was surprised to find that the clouds are brighter (greater albedo) than the ice itself.”
My problem is I don’t see data about cloud albedo. “All sky albedo” includes the clouds.
In the explaining text with the figures it is stated: “The data is composed of the 12 monthly averages for each gridcell. There are 11,646 gridcells (1°x1°) which contain sea ice at some point during the year”.
If the ice coverage would be 100% in the gridcells I think yes you may conclude “he clouds are brighter (greater albedo) than the ice itself”.
As I read the explaining text that means on average there is no 100% ice coverage in the grid cells, as there only has to be sea ice at some point of the year. That would mean the “all sky albedo” could be higher for no other reason than extra albedo because of cloud cover over average areas withing the grid cells without ice.
Well, clumsy explanation I guess I am not well into this stuff, guess I am missing something here.
Jurgen, as you point out all-sky albedo includes the clouds.
Since the all-sky albedo is greater than the clear sky albedo at all ice concentrations, including those gridcells that are totally frozen during the month in question (100% coverage), we can only conclude that the cloud albedo is greater than the ice albedo.
w.
Thanks for the reply Willis, I’m reacting a bit late, being outside today enjoying some spring weather at last in Holland.
Yes, I missed that “at all ice concentrations”. It makes sense to me now.
WOW, there are some guys with really big brains throwing around a lot of ideas and working on this. I think I’ll have another drink (VO & Seven) and ponder all this. Thanks.
..Oh boy !! 30 cm of snow coming to Southern Ontario by Sunday !! …..Dang Glo.Bull Warrming !! AAAARRRRrrrrrrrrggggggg…………
I was surprised to find that the clouds are brighter (greater albedo) than the ice itself. At all different amounts of ice coverage, including 100%, the albedo with clouds is greater than the surface albedo of just the ice itself.
****************************************
that is surprising, would like to see someone knowledgeable expand on the ramifications.
Ahh.. that answers part of my question to Willis, I missed that “at all different amounts of ice coverage”. Should be interesting to see the difference in albedo compared to the difference in ice coverage.
Willis would you like to have some insight into what the effects a ice age weather set up would have on the Arctic ?.
Well next weekend it looks like we will get the chance. Because if the jet stream forecast is correct, Then there is a “weapons grade” ice age weather pattern formation about to turn up. l have waited 3 years for the weather to “play ball” to show about my ideas on ice age formation, and now it looks like the insight will be better then a dared hoped.
Willis writes:
I think you’re forgetting that climate changes *are* small. A 1C change in global average temperature is equivalent to a 0.34% change in temperature. Your calculation of sea ice effect on solar reflection is thus equivalent to a > 3C change in global temperature measured in percent.
It’s common in discussing climate for people to dismiss small effects not realizing that a 3C change in global temperature is ‘merely’ a 1 % change. Yet 3C would take us back to an era when sea levels were dozens of feet higher than today.
..” 3C increase is 1% ” ?? Is that Common Core Mat !!
,,Math…arrrrggggg………
Marcus – you can’t use Celcius and do a percentage calculation. You have to first convert to Kelvin. Using 16C as the average global temperature that converts to 289K. 1% of 289 is 2.89. Using the percentage Willis gave of 1.1% would be 3.18. Take your pick.
..1% of 58C = 0.58C
58C + 1% = 58.58C, NOT 61C !
58C = 331K
1.01 time 331K = 334.31K
334.31K = 61.31C
58C + 1% = 58.58C, NOT 61C !
..LOL..1% of K is not the same as 1% of C…
Next your going to tell me that 1% of 100 kilograms is the same a 1% of 100 pounds !! LOL…If you torture the data long enough, it will confess to anything !
rather bad analogy there Marcus. Pounds and kilograms have the same zero point. A 1% difference in the weight of an object measured in kg is the same as a 1% difference measured in pounds.
The reason it does not work with K and C is that they do not have the same zero point, despite the having exactly the same magnitude for each unit.
best do a literature search first.
I used to be a dive into the data kinda guy.
Then I got a schooling from some Nobel types
http://www.ncbi.nlm.nih.gov/pmc/articles/PMC3948279/
..Nobel types ?? You mean like Al Gore and friends ?? LOL
Get with the orthodoxy you mean?
Going to the literature first is good way bias your work with preconceptions before you start. A literature search after a dive into the data is a very good idea.
Willis Eisenbach already knows that paper, as he is a signing author of a letter to the authors questioning their findings:
Arctic albedo changes are small compared with changes in cloud cover in the tropics
http://www.ncbi.nlm.nih.gov/pmc/articles/PMC4040558/
Reply to Legates et al.: Negligible role of arctic cloud albedo changes in observed darkening
http://www.ncbi.nlm.nih.gov/pmc/articles/PMC4040612/
But regarding Pistone et al. 2014. “Observational determination of albedo decrease caused by vanishing Arctic sea ice”, that you cite,
the Arctic albedo changes found by Riihelä et al. 2013: Observed changes in the albedo of the Arctic sea-ice zone for the period 1982–2009, http://www.nature.com/nclimate/journal/v3/n10/full/nclimate1963.html
appear to be much smaller. I find it very curious that Pistone et al. will not cite Riihelä et al. work that was published 6 months before on exactly the same subject in Nature Climate. Very curious indeed.
It is obvious that Arctic Ice albedo is decreasing, but since surface albedo is a small part of planetary albedo, and Arctic sea ice albedo is a small part of surface albedo, it is clear and obvious that on a planetary scale the changes in Arctic sea ice albedo are negligible and likely to be overwhelmed by any change in cloud cover. Do you think this is not the case?
When the authors describe sea ice as “vanishing” “in the title of the paper you can see instantly that this is not an objective scientific study. I won’t waste my time even reading the abstract.
I don’t see any Nobel prize winners amongst the author list either. No idea what Mosh’ means by that.
May be he is confusing a Nobel “Peace” prize for political correctness with a Nobel prize for a science subject.
Willis, You say
The most obvious change is that the slope of the all-sky data (blue) is much less than that of the clear-sky data (red).
Understanding right :
The more detailed, the less positive feedbacks in AGW?
Regards – Hans
Willis,
The reason that overhead satellites are able to approximate the Earth albedo is because most things have a diffuse reflectance. In the case of snow, it is close to Lambertian, albeit with a strong forward scattering. (note that, minus the strong forward scattering, light is equally reflected by snow in a downward direction as well as upward or sideways) Water reflects primarily by specular reflection, as quantified by Fresnel’s equation. An overhead satellite will see no reflection (albedo) from water unless it is in the special position of being in the plane of illumination, (even though a minimum of at least 4% is going off into space) opposite from the sun and at the same angle as the incident sunlight has. At the limbs of the Earth, the reflection from water can approach 100%, although nothing will be seen or recorded unless the satellite is looking in precisely the right direction. Downward is not the right direction! Albedo is probably most useful for estimating the relative reflectance of water-less bodies in the solar system where the only viewing platform we have is Earth. To truly estimate the reflectance from the surface of Earth, we need to characterize the land cover, and develop a bi-directional reflectance distribution function (BRDF) for each and every diffuse reflector. Water can be treated as a specular reflector except when it is very rough, and especially if it has abundant white caps.
Ahem…Dear Mods, I used the d word in a post…as you might see if you check the contents it does not contravene any of your eminently sensible rules. Please consider putting it up. Thanks.
“The upper side of the grass” is muuuch more comfortable. Let’s enjoy it while it is still time.
However much albedo there is due to water ice or snow, it’s surface energy reduction due to green house gases; that’s after there are 20 + % surface energy reduction due to the very same green house gases.
Green house gases represent additional radiating mass, at identical temperature to the surface. This parallel route for emission constitutes cooling; not warming.
This is so simple, one pseudo-science doesn’t allow real physics to be discussed regarding it’s cult belief: that the atmosphere heats the planet.
The atmosphere – specifically the green house gases – reduce energy to the surface many percent, then create additional mass from which emission may take place.
There’s no such thing as reducing surface energy density, then emitting that reduced energy from an overall larger, colder total mass, and those thermodynamic processes being energy gain: warming.
Frank April 2, 2016 at 2:16 pm
Listen very closely, you slimy little anonymous internet popup. Like any honest man, I do not take kindly to being falsely accused of being a liar.
Now, you may lie about this kind of stuff yourself or not, either Big Lies or Small Lies. I have no idea.
I do know, however, that I tell the truth on these pages as directly and clearly and honestly as I know how, and as a result I will not stand for scumballs like you calling me a liar.
Come back when you have learned to keep a civil tongue in your head and maybe we can discuss your ideas. At present, you are persona non grata for me. Perhaps your friends don’t mind if you accuse them of not only lying but getting into “Big Lie” territory. Me, I don’t have any truck with pond scum who make those kinds of baseless false accusations. I am a decent, honorable, and honest man, and I’ll thank you to bear that in mind in our discussions.
w.
Willis: I’m very sorry you took my characterization of your conclusions about the importance of sea ice albedo feedback personally. My words were directed solely at the validity of your conclusion, not at you personally. Nevertheless, upon re-reading my remarks, it clear that my deepest apologies are warranted.
The mathematics of climate sensitivity and feedbacks is non-linear. Feedbacks are summed in the denominator. If a feedback of -1 W/m2/K is added to planet with an ECS of 3.7 K/doubling, a run-away greenhouse effect (ECS is infinity) will exist. On the same planet, an addition -0.33 W/m2/K feedback increases warming by almost 50%. On a planet with an ECS of 2 K/doubing, however, an addition -0.33 W/m2/K feedback increases warming by only 20%. Small changes in non-linear systems can have large impacts.
Sincerely, Reformed Pond Scum
Awesome, amigo, you won the internet with that reply.
My sincere thanks,
w.
Willis: Thanks for your kind reply.
If possible, I’d like to return to the problem that your data is consistent with a feedback large enough to be a first-order variation. Modest changes in non-linear systems (like feedback and climate sensitivity) can have large effects.
Thanks, Frank. Regarding the changes, global sea ice has varied by ± 5% since 1984 … which corresponds to a globally averaged change of 0.05 W/m2.
Not sure why you think that is a first order forcing in a system where the global average downwelling radiation is half a kilowatt …
Regards,
w.