From the UNIVERSITY OF COPENHAGEN – NIELS BOHR INSTITUTE

When we talk about climate change today, we have to look at what the climate was previously like in order to recognise the natural variations and to be able to distinguish them from the human-induced changes. Researchers from the Niels Bohr Institute have analysed the natural climate variations over the last 12,000 years, during which we have had a warm interglacial period and they have looked back 5 million years to see the major features of the Earth’s climate. The research shows that not only is the weather chaotic, but the Earth’s climate is chaotic and can be difficult to predict. The results are published in the scientific journal, Nature Communications.
The Earth’s climate system is characterised by complex interactions between the atmosphere, oceans, ice sheets, landmasses and the biosphere (parts of the world with plant and animal life). Astronomical factors also play a role in relation to the great changes like the shift between ice ages, which typically lasts about 100,000 years and interglacial periods, which typically last about 10-12,000 years.
Climate repeats as fractals
“You can look at the climate as fractals, that is, patterns or structures that repeat in smaller and smaller versions indefinitely. If you are talking about 100-year storms, are there then 100 years between them? – Or do you suddenly find that there are three such storms over a short timespan? If you are talking about very hot summers, do they happen every tenth year or every fifth year? How large are the normal variations? – We have now investigated this,” explains Peter Ditlevsen, Associate Professor of Climate Physics at the Niels Bohr Institute at the University of Copenhagen. The research was done in collaboration with Zhi-Gang Shao from South China University, Guangzhou in Kina.
The researchers studied: Temperature measurements over the last 150 years. Ice core data from Greenland from the interglacial period 12,000 years ago, for the ice age 120,000 years ago, ice core data from Antarctica, which goes back 800,000 years, as well as data from ocean sediment cores going back 5 million years.
“We only have about 150 years of direct measurements of temperature, so if, for example, we want to estimate how great of variations that can be expected over 100 years, we look at the temperature record for that period, but it cannot tell us what we can expect for the temperature record over 1000 years. But if we can determine the relationship between the variations in a given period, then we can make an estimate. These kinds of estimates are of great importance for safety assessments for structures and buildings that need to hold up well for a very long time, or for structures where severe weather could pose a security risk, such as drilling platforms or nuclear power plants. We have now studied this by analysing both direct and indirect measurements back in time,” explains Peter Ditlevsen.
The research shows that the natural variations over a given period of time depends on the length of this period in the very particular way that is characteristic for fractals. This knowledge tells us something about how big we should expect the 1000-year storm to be in relation to the 100-year storm and how big the 100-year storm is expected to be in relation to the 10-year storm. They have further discovered that there is a difference in the fractal behaviour in the ice age climate and in the current warm interglacial climate.
Abrupt climate fluctuations during the ice age
“We can see that the climate during an ice age has much greater fluctuations than the climate during an interglacial period. There has been speculation that the reason could be astronomical variations, but we can now rule this out as the large fluctuation during the ice age behave in the same ‘fractal’ way as the other natural fluctuations across the globe,” Peter Ditlevsen.
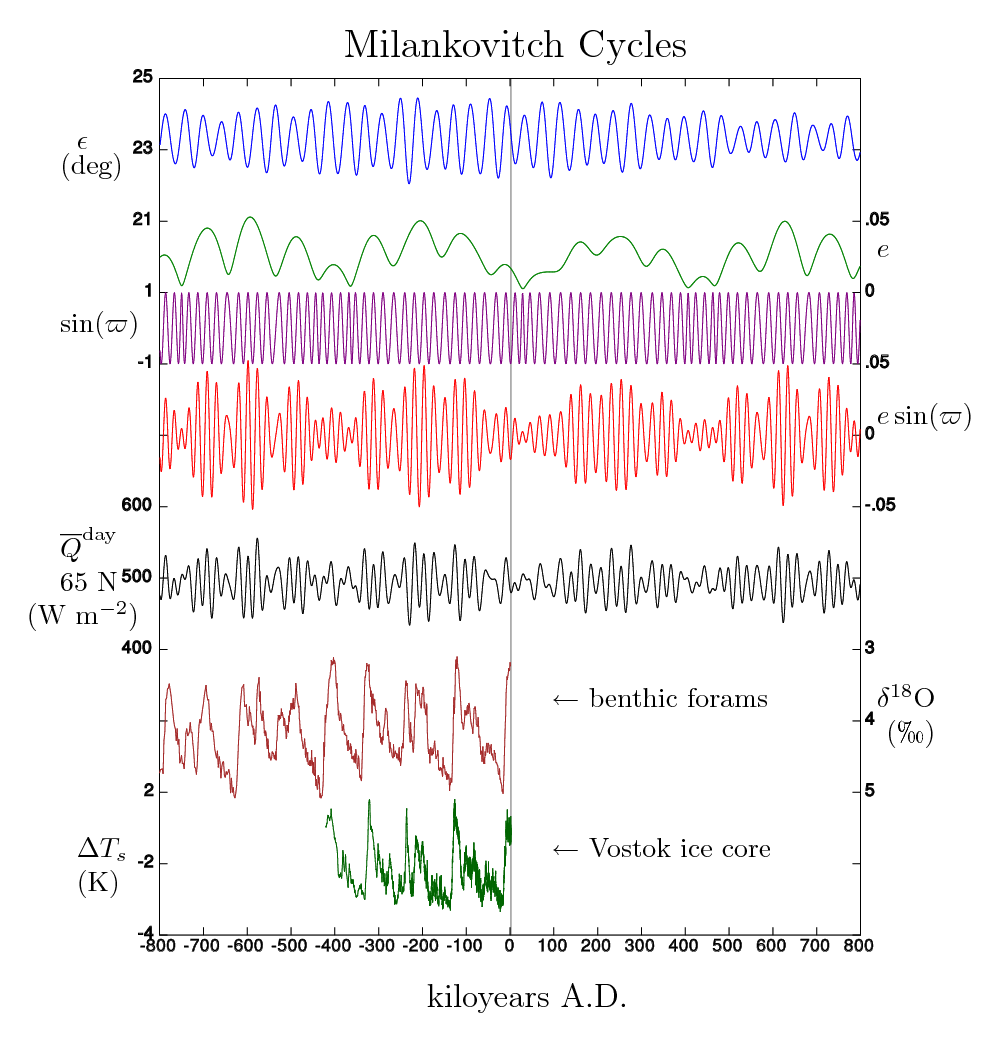
The astronomical factors that affect the Earth’s climate are that the other planets in the solar system pull on the Earth because of their gravity. This affects the Earth’s orbit around the sun, which varies from being almost circular to being more elliptical and this affects solar radiation on Earth. The gravity of the other planets also affects the Earth’s rotation on its axis. The Earth’s axis fluctuates between having a tilt of 22 degrees and 24 degrees and when the tilt is 24 degrees, there is a larger difference between summer and winter and this has an influence on the violent shifts in climate between ice ages and interglacial periods.
The abrupt climate changes during the ice age could be triggered by several mechanisms that have affected the powerful ocean current, the Gulf Stream, which transports warm water from the equator north to the Atlantic, where it is cooled and sinks down into the cold ocean water under the ice to the bottom and is pushed back to the south. This water pump can be put out of action or weakened by changes in the freshwater pressure, the ice sheet breaking up or shifting sea ice and this results in the increasing climatic variability.
Natural and human-induced climate changes
The climate during the warm interglacial periods is more stable than the climate of ice age climate.
“In fact, we see that the ice age climate is what we call ‘multifractal’, which is a characteristic that you see in very chaotic systems, while the interglacial climate is ‘monofractal’. This means that the ratio between the extremes in the climate over different time periods behaves like the ratio between the more normal ratios of different timescales,” explains Peter Ditlevsen
This new characteristic of the climate will make it easier for climate researchers to differentiate between natural and human-induced climate changes, because it can be expected that the human-induced climate changes will not behave in the same way as the natural fluctuations.
“The differences we find between the two climate states also suggest that if we shift the system too much, we could enter a different system, which could lead to greater fluctuations. We have to go very far back into the geological history of the Earth to find a climate that is as warm as what we are heading towards. Even though we do not know the climate variations in detail so far back, we know that there were abrupt climate shifts in the warm climate back then,” points out Peter Ditlevsen.
###
UPDATE: The article is Open Access at Nature Communications
http://www.nature.com/ncomms/2016/160316/ncomms10951/full/ncomms10951.html
h/t to Doug Huffman
From the authors ” But if we can determine the relationship between the variations in a given period, then we can make an estimate. These kinds of estimates are of great importance for safety assessments for structures and buildings that need to hold up well for a very long time, or for structures where severe weather could pose a security risk, such as drilling platforms or nuclear power plants. We have now studied this by analysing both direct and indirect measurements back in time,” explains Peter Ditlevsen.
So they take a shorter period, say the 100 yr behavior, as a model for longer periods. This technique is not new. Hydrologists and engineers, have been using shorter periods of precipitation and runoff peaks to calibrate a probability distribution (log-normal, Log-Pearson III, etc.) and extending it to longer periods. This is how bridges, floodplains, conveyance channels, etc. have been designed for well over a century.
Calibrate a model to a shorter period of data then extend the model to estimate occurrences over longer periods. Standard practice, whether your estimate is a skew coefficient for a probability distribution or a Hurst coefficient or fractal parameters in your model.
Consult any hydrology or hydraulic engineering text book.
The predictbility horizon of a dynamical (chaotic) system is quite short. Fore climate it is much less than the century taken as time horizon for IPCC projections
Techniqueallow to quantify this tie horizon (i.e. anaysis of visibiliy)
“Technique” => “Different techniques”. sorry
” if we shift the system too much, we could enter a different system, which could lead to greater fluctuations. We have to go very far back into the geological history of the Earth to find a climate that is as warm as what we are heading towards. …”
The Obligatory Nod to the “Consensus”. Feh. Still, interesting work. Step by step, inch by inch… catchee monkee?
That’s a bald faced lie as even the most cursory glance at glaciation cycle charts show. We are toward the end of a quite warm spell with glaciation pushed back a long way.
And the most cursory glance at those charts show the plunging cold and frigidity that is coming, no matter how many government employees, alternative energy peddlers, and environmental wackos try to say otherwise.
” if we shift the system too much, we could enter a different system, which could lead to greater fluctuations. We have to go very far back into the geological history of the Earth to find a climate that is as warm as what we are heading towards.”
You don’t need a link or a guru you can check that story by simply looking at the approximate place we are now in glacial history. We’re in that region of time that from now to – oh even a couple of thousand years from now – there’s going to be a VERY serious plunge into the cold,
and everyone is going to wish what green house gas effect protagonists said was true: that by using fire, you can make the sky get hot.
No, you can’t. And it’s going to be katie bar the door the first time the planetary temperature starts showing any seriously determined urge to fall very far.
All this AGW crap is exactly that: manufactured alarm. Warmth has never threatened biodiversity on the planet; but glaciation wipes out entire sectors of the globe.
+1
R. Legrand,
Here’s a nice graph form Brian over at the Climate Concerns blog, which nicely illustrates your point:
Our current interglacial is getting decidedly long in the tooth. Interestingly, it is tracking the one from 335,500 ybp very closely. We should be so lucky.
#WB Wilson: could you please give the URL of this “Climate concerns” blog. Thnks in advance.
Henri,
Here ya go: https://oz4caster.wordpress.com
Brian posts here regularly under the moniker ‘oz4caster’. See below on this very thread.
Many thanks for this 😉
pdtillman: You cited the two most important falsely premised phrases in that stealth AGW paper, “as warm as we are heading towards,” and:
Setting a foundation for yet another tired rendition of the Precautionary Fallacy, an aria in five words and seven notes:
“Do this — just in case.”
(to the tune of “B-I-N-G-O” … oh, you know the one…. from first grade music class: “There was a farmer, had a dog, and Bingo was his name-O. B-I-N-G-O! B-I-N-G-O! B-I-N-G-O! and Bingo was his name-O!” (remember to shout on the “O” like you did when you were 6 and then, leave off the first letter and just ((clap)) once in its place … then the first two letters… and HEY it’s sort of like truncated data adjustment! And almost a fun as a “nature trick.”).
Yup. The fractal hand waving was, apparently, not a palm tree (or, rather, not a cluster of broccoli, heh) only a beautiful mirage, luring sincere, math-loving, science realists into the desert of AGW — AGAIN!!
Aaarrrrrrrgh!
I was really, really, interested in that theory. And now, I don’t even WANT to go read the paper. I’m willing (as a non-math major) to tackle it, but at that level of the difficulty, I need to have more confidence that I am not going to end up wasting hours (yes, likely hourS) of my time!
Okay. Someone else read the paper and summarize it for us– okay?
Thanking you in advance… I will be watching for a WUWT article to appear by YOU.
🙂
l feel its an error just to view the ice age as extreme climate change, because in their own way its the interglacial periods are the extreme climate events.
Because when you look at the last millions years. Don’t the interglacial periods look just like the current temperature spike that has got the AGW crowd into panic mode.
robust.
The idea of fractal patterns in weather and climate is not new. Here’s a quote from a 2007 book:
Is it profound or merely pseudo-profound bullcrap? This reminds me of the way the Information Studies folks twisted themselves into pretzels trying to apply Shannon’s Law to the social sciences.
If you could come closer to analyzing the work discused here, and try to understand the methodological steps used, and from there draw some interesting conclusions by yourself, may be you would contribute to uplift the level of this discussion
“After you, my dear Alphonse.” link
The practical use of fractals and chaos theory for analysis remains elusive. Here’s a great tutorial.
Well, please comment on the following links (two working documents made by myself) as a starting point: 1- just a mind map for a tentative structure of the climate system (because if you don’t understand the structure, forget about the dynamics of a complex system). Do you agree with this structure, the “concepts” (the right term in complex system analysis) included and their many links (actually delayed feedback loops)?: https://dl.dropboxusercontent.com/u/56918808/meta-model%20climate.pptx; 2- and another file giving you the phase plane representation of the Vostok data and some bullit style comments by myself: https://dl.dropboxusercontent.com/u/56918808/Phase%20plan%20Vostok.docx
Your first diagram is less useful than you might suppose. If you try to take into account all of the possible variables, you end up with an intractable problem. You are forced into reductionism. In the time I have followed WUWT I think I have seen theories that try to explain the climate based on each of the variables in your diagram. That’s a lot of theories. 🙂 Nobody has found the secret sauce yet and the alarmists take that as proof that it must be CO2. I was trying to figure out which logical fallacy that is and I stumbled on ludic fallacy. The use of computer models to bolster CAGW is a ludic fallacy. 🙂
Your second document passes the smell test. We bang back and forth between glacials and interglacials. Those sure look like attractors to me.
My beef about fractals and chaos is that I can think of no case where they have been successfully used to make predictions.
Thanks for having taken the time to look at those two documents. The first one is just a mind map trying to summarize different hypotheses, potential links from a broad spectrum of scientific papers (some peer reviewed, some from the “grey literature” indeed). This is not a model (one more as you said): it is a condensed way to report a literature survey for discussion purpose. But for that you need to have some affinity for visual thinking, of course. Regarding the second document:it is just an easy way to spot a chaotic signature in time series. Indeed, as you mentionned, the future behaviour of systems exhibiting a chaotic signature is difficult to predict. but some significant progress have been made (in other disciplines than AGW, but the methodology is generic): one promizing track consists in crunching sets of (chaotic) time series with neuronal algorithms and find:the most optimum possible neuronal network. The link between the two approaches (mind mapping the hypotheses from the literature + optimizing neuronal networks) becomes then obvious: how different are those two figures. A step forward in understanding the structure of the complex system before even thinking of describing its dynamics and make forecastings. This make sense , no? Regarding predictability of chaotic time series, another quite interesting track is to look at visibility graphs. Are you familiar with that?
Visibility graphs are another one of those things about which I’m on the fence. For instance, we could use them to calculate tool-paths. On the other hand, we’ve been calculating tool-paths without needing them for a long time. The question is whether they actually convey any benefit. I should have been born in Missouri. 🙂
about visibility graphs: did you spot this paper and see how they define the predictability window? https://dl.dropboxusercontent.com/u/56918808/visibility%20graphs_tourism.pdf
“…the way the Information Studies folks twisted themselves into pretzels trying to apply Shannon’s Law to the social sciences.
But Shannon’s laws is intuitively obvious. It shows that nothing can be communicated at all to people who cannot even handle one bit at a time…
…I’ll get my coat.
WHAT???
True enough. Actually, it’s worse. There’s a corollary to Murphy’s law that says that incorrect information is always transmitted on a clear channel.
That’s what I love about WUWT! You can get away with jokes like that.
Here’s the understatement of the century.
I note that the paper cites Henry Mintzberg. He is a serious critic of this kind of thing. He has written extensively that analytical techniques are no substitute for actual managerial expertise.
“a good qualitative understanding of the system studied is needed for a correct interpretation of the results”.
Well, this is actually what I try to do by bringing to discussion the tentative “meta-model” recalled hereunder. This “meta-model” is nothing more than an attempt to bring together, on a single mind map, (almost?) all the statements & hypotheses I found by reviewing the (peer reviewed or not) literature on the subject, indeed with a broader set of key words than what is usually done in climatology. I expected from the distinguished participants to this blog discussion some focused remarks, suggestion or critics on the structure of this model, its components and links between them. “un coup d’épée dans l’eau” we say in French 🙁
https://dl.dropboxusercontent.com/u/56918808/meta-model%20climate.pptx
Please note I want to focus only on the possible overall structure of this “meta-model”. Each component (“concept”) is obviously by itself a rather complex model. But we need to start somewhere; and I proposed a top bottom approach, which allows to get some kind of “helicopter view” of the climate system as a whole….and allows also to put each “component (i;e. anthropogenic global warming) at its right place, with its right “structural” driving force on the other components. …A sound starting point, no?
See http://scienceofdoom.com/2013/10/06/ghosts-of-climates-past-part-two-lorenz/ for a good discussion of the chaotic (or is it intransitive) nature of the earth’s climate.
To add a further point to my first post.
l feel that the current warm period should not be viewed as the normal stable climate. lt only seems stable because its the only climate we have experienced, l think its better to view both the ice age and the warm periods as extreme climate change. lts only because during the warm period we are having just the one extreme is why it appears stable.
Glaciation send interglaciation are the two attractors in the current chaotic climate system.
“and” not “send”, stupid autocorrect.
Paul
l think both ice age and the warm periods are both examples of extreme changes in the weather over the longer term. As l see it the warm periods are caused by a increase in a chaotic weather system. By which l mean there is a great deal of change to the weather patterns over much of the globe. Which spreads warmth across much of the globe. But during an ice age it goes the other way. There is a decrease of chaotic weather in the system. Leading to a lot less changes in the weather patterns and so increasing the amount of blocking in the weather. Which reduces the amount of warming that can spread across the globe, and increases the build up of cold where the the more static weather patterns allows this to happen.
taxed,
Don’t you think that maybe the mild/extreme weather is a result, rather than a cause?
dbstealy
What makes me think that changes in weather are the cause of climate change rather then a result of it.
ls the fact that the ice age became such a extreme event in certain parts of the NH. Had the weather patterns been just as chaotic during the ice age as they are now, Then yes they would be some cooling but not the extreme cooling like what happened in North America. There would be far too much movement in the global air masses for that to have happened.
No! this type of extreme event need very static weather patterns over many years to build up that level of cold and then push it as far south as the USA..
taxed,
I’m not arguing that you’re wrong. I don’t know.
But I do know that the climate/weather conditions over the past century have not been “chaotic”. In fact, the past century has been the most benign climate in the entire geologic record.
Extreme weather events have been steadily declining, and the 0.7ºC wiggle in global temperatures — over more than a century — is as small a change as anything oberved previously. Just prior to the current Holocene, for example, temperatures fluctuated by tens of whole degrees, within only a decade or two. We have been much more fortunate recently.
“But I do know that the climate/weather conditions over the past century have not been “chaotic”. ” You misunderstand the term. A (http://www.businessdictionary.com/definition/chaotic-system.html) “chaotic system” is one that is extremely dependent on initial conditions and in which small changes can cascade into large results. Chaotic systems tend to be inherently unpredictable since even small errors in the model can and will result in large divergence from reality over time.
Two well-known chaotic systems are weather and orbital dynamics. Two bodies in an otherwise unpopulated universe are predictable. Three or more are not, not even theoretically. A few years ago, some astronomers built a very high-precision computer “orrery” or model of the solar system. Two separate runs, otherwise identical but differing by only a single bit in the position of one planet, resulted after a few million years with Pluto completely on the other side of the Sun and differences in the positions of the other planets.
Likewise, weather famously exhibits the “butterfly effect”. If you think about it, you can predict the weather a day in advance by taking temperature, humidity, and pressure readings about every 10 miles or so (I forget the exact numbers) for about a 100 mile radius. If you want to go out 2 days, you need readings every 5 miles for 200 miles around, and so on. If you go out more than 2 weeks you need to know the conditions for every square inch on Earth, and past 3 weeks you need to start knowing the states on the other planets.
This is why, for instance, the National Hurricane Center shows a projected hurricane track as a funnel, widening out as it projects further into the future. There is simply not enough information, nor can there be, to more accurately predict its path. Literally, if you projected, by computer simulation, the track out for a week, a difference between the model and reality in the starting conditions equivalent to one flap of a butterfly’s wings would result in a noticable difference at the end.
One interesting characteristic of chaotic systems is that they often exhibit what are called attractors: areas of behavior that the system tends to stay close to, even if the exact location is unknowable. (The exact definition is rather mathematical). For instance, planets in the solar system tend to stay in their elliptical orbits. Hurricanes tend to stay in their tracks. However, a system can have multiple attractors and flip unpredictably between them after some stable period.
So: the fact that the climate has stayed calm for some period is nice, but relatively meaningless in the long run. I suspect, based on the characteristics of the bast million years, that the current climate system has two stable attractors: one being warm, the other involving glaciers. Unless we know a lot more about the “state space” of the climate than we do, we have no idea what characteristics it may show just before it moves from one attractor to the other.
dbstealey
A further point l feel l should have added.
The key thing about the weather blocking during the ice age is where it formed. lt was near enough to the Arctic circle to draw the polar air southwards.
Paul of Alexandria,
I don’t disagree with anything you wrote. But it isn’t what I replied to.
I just wondered whether different weather causes the flips, or the flips cause different weather.
Sorry, I got carried away. Depends on what you mean by “weather”, I suppose. Climate is more or less the average weather over some period, so the weather for a given period can be called the “state”, or part of the state, of the chaotic climate system.
See, for instance, the images at http://www.bing.com/images/search?q=chaotic+attractor&view=detailv2&qpvt=chaotic+attractor&id=BA4FF3AE499B18F4F2BECCFE5FCD49646205E3F7&selectedIndex=17&ccid=UwnRlo8A&simid=608019734833595424&thid=OIP.M5309d1968f0037035506dfbf7a6fc1a1o0, in the center of the page. These are (simulated) outputs that you would see on an oscilloscope from a particular chaotic circuit. The two axes represent the “state space” of this system Note that the line circles the two areas that it never enters, switching occasionally between the two. The two areas orbited are the attractors. While the line crosses itself, it can never repeat two consecutive points, if it did it would repeat and not be chaotic.
The weather, then is similar. “Calm and warm” is one small area on the plane (really in a space with many more dimensions than two). The climate may pass through this area going any which way, orbiting either attractor or being in the process of switching. In the context of, say, WBWilson’s graph above, a particular patch of nice weather may be a peak in a glacial period, a valley in a warm period, or the middle of a crossover. You really can’t say except in hindsight, unless you have a much better model of the whole system than we do now.
Taxed, you should probably correct your terminology. We’re still in an ice age, currently in an interglacial period, and patiently awaiting the next glacial.
From the article: “This new characteristic of the climate will make it easier for climate researchers to differentiate between natural and human-induced climate changes, because it can be expected that the human-induced climate changes will not behave in the same way as the natural fluctuations.”
I take it they have found no “human-induced climate changes” in their data.
Boris Pavlovich Belousov was a Soviet chemist who in the 1950’s discovered a chaotically oscillating reaction involving bromine and acid. After Belousov’s death it would become known as the Belousov-Zhabotinsky (BZ) reaction or oscillator.
https://en.m.wikipedia.org/wiki/Belousov–Zhabotinsky_reaction
However Belousov’s own attempts to publish his findings in international scientific journals ran into a brick wall. Editors and reviews were simply unwilling to believe what Belousov had observed. After more than a decade Belousov published the work in an obscure non peer reviewed journal. He passed on his notes to a student Zhabotinsky, left science and eventually committed suicide. Zhabotinsky eventually managed to gain recognition for the phenomenon.
How many of you have ever heard of the BZ reaction? That’s what I thought. It remains an inconvenience swept under the carpet, as do chaotic-nonlinear phenomena generally, as evidenced by comments here such as those by george e smith. The physics community still rigorously averts its gaze from nonlinear-chaotic phenomena trying to shoehorn everything into rigid linear models – climate science is a foremost example of this. Ed Lorenz’ astonishing finding in 1963 about deterministic nonlinear flow should have revolutionised science, like the BZ reaction. But it didn’t.
George – were you one of the reviewers of any of the Belousov manuscripts?
Belousov. You might be surprised. I know very well the Belousov-Zhabotinsky reaction since I am a chemist. Moreover, living in Belgium, we have had the chance of having a Nobel Prize winner for precisely studying these oscillating reactions: Pr Ilya Prigogyne. Most scientists in Belgium know about them. I use these oscillating reactions to impress the public and the students during some demos attempting to show the beauty of science.
The crux of the current climate change hysteria hinges on the irresponsible speculation that humans can change their behavior enough to nullify not only the climate effects they are causing but to also mitigate the natural variation that is taking the climate in a direction that is harmful to human habitation and the biosphere.
The work of Murray Salby shows that the long term trend is due far more to natural causes than to human causes. Should humanity cease to exist in an instant, that would only move the natural trend line by less than 100 years. But if not a single human were alive, that is to say, if humanity sacrificed itself to save the earth, what deity did we offer ourselves to? Gaia?
“The Gulf Stream, which transports warm water from the equator north to the Atlantic, where it is cooled and sinks down into the cold ocean water under the ice to the bottom and is pushed back to the south. This water pump can be put out of action or weakened by changes in the freshwater pressure, the ice sheet breaking up or shifting sea ice and this results in the increasing climatic variability.”
The Gulf Stream might also be disrupted by geological changes. For instance a continuation of the volcanic activity from the Virgin Islands to Venezuela could one day block the doorway to the heat pump which drives the Gulf Stream. Might just change the complexion of the entire climate system. Life as we know it is tenuous.
Yet they claim
So they claim that a natural warmer climate is more stable but a human induced climate should have more fluctuations! Why would human induced climate change be different? Are laws of physics suddenly changing too? So either a warmer climate is more stable regardless of the reason of the warming or… well, more fluctuations in climate suggest that contrary to the consensus, the reality is climate is not warming, but cooling, which circulation changes do suggest.
Stunning work. Whatever warms me now, warms the day. Whatever warms the day warms the season. Whatever warms the season warms the year. Whatever warms the year warms the decade. And so on.
I think the 800,000 year reconstruction http://www.climate.unibe.ch/~stocker/papers/schilt09qsr0.pdf shows a cyclic pattern of net evaporative discharge/cloudy trend that happens rather quickly, followed by a long term net recharge/cloudless trend that happens slowly and jaggedly. This reminds me of the relatively second of time of ENSO noise pattern and oscillations, but on a millennial cyclic trend up and down. The oceanic volume and the difference between how quickly oceans evaporate heat, and how slowly they gain heat is likely the physics behind what drives this unbalanced process that then drives the ice ages and warm periods.
What warms and cools us now, did so over millennials of time. Ergo properly demonstrated in a repeating fractal pattern
Pamela
l feel its not just about the amount of cloud cover, but also how much of this cloud cover moves southwards where it has a greater cooling effect on the climate.
The clouds mitigate how much solar insulation is available at the ocean surface. Direct cooling because of cloud cover is not the issue here. It’s solar energy recharge of the oceans, which is diminished with cloud cover, especially in the equatorial band. Cloud cover in the equatorial band means that evaporation is in action, along with release of heat. Cloud cover in that band is a sign of a warming trend, not a cooling trend. Dry and and clear skies is a sign of a cooling trend. To wit, during La Nina, clouds clear and evaporative heat energy is kept at bay, which leaves us in the cold. However, while we are cold, the oceans are getting recharged.
Try insolation instead of insulation.
Somewhat opposites…
BS. With 150 years of direct measurements, you can make estimate of 30-50 years. You need 3-5 cycles in your data to make any estimate at all.
You also need 150 years of quality data that is also complete.
Data that is limited to pretty much north America and Europe does not tell you much about what is happening for the entire world. Even if all the data had been of high quality.
It looks like a Hello Kitty drawing in a fractal design to me.
Oh good, what a relief. Astronomical variations result in 10s to 100s of watts/m^2 variation in insolation yet apparently they have a smaller effect than the fractal nature of fluctuations. C02 has an effect of a mere watt or two, so there must be no measurable effect of C02 at all.
Peter
My hunch is that it takes longer and in a see-saw pattern, to recharge what was lost to evaporative discharge, and that evaporative discharge is a rapid one-rise process once it gets underway. Place that ENSO process on a long term ocean heat recharge/discharge unequal imbalance, likely because of ocean volume, and you have a fractal.
What gets me is that they don’t even understand that “interglacial” is part of the ice age. The correct term would have been “glacial period”, not “ice age”. Can’t say I respect their science much.
Never imagined that this is may be just a translation problem they faced and not a “scientific background” one? Everybody is not a “native” english speaking person and has may be been educated in another language. Please be patient with people trying to communicate with you in your language. or do you want to switch to German, French, italian, Spanish, Dutch, Danish, Swedish, etc. and rely on Google translations?
Henri, I didn’t see any evidence of that in reading the text. Usually it’s pretty obvious if a poor translation is in effect. Can you show otherwise?
Not likely, since we don’t really have accurate climate record of even the last 100 years. Anything older than that is pretty much fantasy.
Mush.
[quote]We have to go very far back into the geological history of the Earth to find a climate that is [u]as warm as what we are heading towards[/u].[/quote]
And please send us more money.
Mush.
From Wikipedia: …in 1724 Daniel Gabriel Fahrenheit produced a temperature scale which now (slightly adjusted) bears his name. He could do this because he manufactured thermometers, using mercury (which has a high coefficient of expansion) for the first time and the quality of his production could provide a finer scale and greater reproducibility, leading to its general adoption. In 1742 Anders Celsius proposed a scale with zero at the boiling point and 100 degrees at the freezing point of water,[8] though the scale which now bears his name has them the other way around.
So why don’t we have any records of air and water temperature until 1850?
CET and Clementinum records go to 1772 and 1775, respectively.
Thank you Curious George.
At first glance it seemed to make sense because fractal design is all around us in nature – but shouldn’t meteorologists be able to see weather the same way then? Call me a skeptic…..
I just don’t see how something can be fractal and chaotic at the same time.
#4timesayear : just go back to some introductory text to Chaos, i;e. James Gleick, “Chaos, the amazing science of thee unpredictable”(Vintage Books, 1998). Or go through some more recent and more mathematical ones you can find on Google or Amazon. if needed, I can help you in your search, as several other commenters on this blog can do also.
Thank you – I will definitely do so 🙂
They are two different things, although related mathematically. “Chaotic” refers to the sensitivity of a system to initial conditions. “Fractal” basically refers to the self-similarity of a system at different scales.
This is a bit of gratuitous nonsense.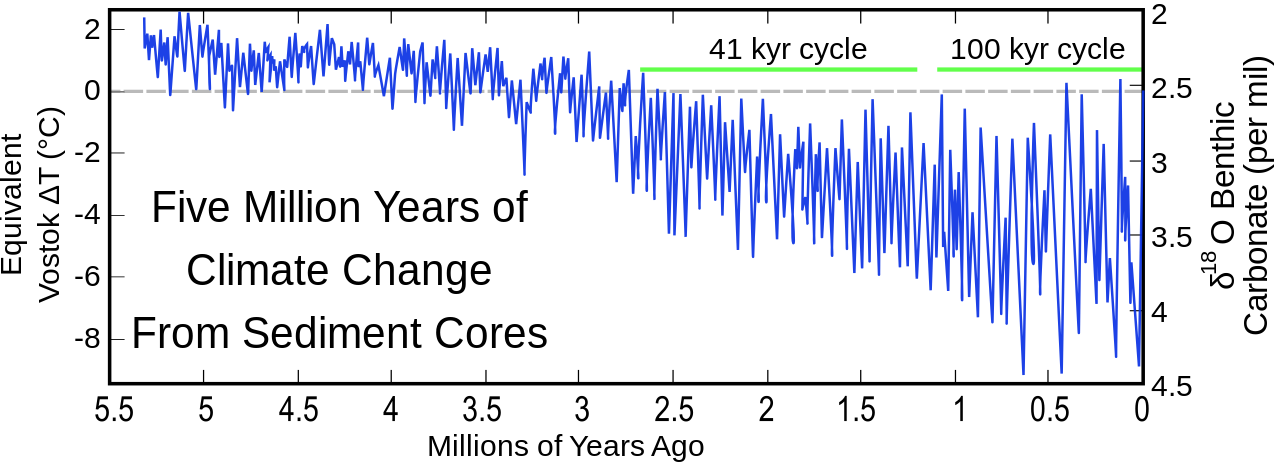
“… We have to go very far back into the geological history of the Earth to find a climate that is as warm as what we are heading towards. …”
The Earth is pegging an average ~6C colder now than it was just 15 million years ago, and is currently averaging about 4.5C to 5C cooler than just 5 MYA. Plus we’re at the end of an interglacial phase, and for the last 4k years have been steadily dropping on a trend toward the next glacial cycle.
Do these people at Niels Bohr Institute, or “Nature Communications”, even reality check the theory and claims against the climate record we actually have before publishing thus stuff?
Let’s have that again: “… We have to go very far back into the geological history of the Earth to find a climate that is as warm as what we are heading towards. …”
BUNK
Thank you Unmentionable. This is climate in a nutshell.
“We have to go very far back into the geological history of the Earth to find a climate that is as warm as what we are heading towards”
A thousand years counts as “very far back”?
One small thing i caught in the discussion is: “generalized Hurst exponent of H~0.7 is significantly different
from the trivial value H~0.5. The glacial climate state has a distinctly more fractal characteristics, with a much larger generalized Hurst exponent H~1.2”
The Hurst exponent is typically derived from the Fractal Dimension D where 1<= D <= 2 using D = 2 – H. In which case 0 <= H <= 1, with H = 0.5 being uncorrelated white noise. Not sure where they got that from as there is no citation, but AFAIK it's wrong from the generalized Hurst Exponent.
Woops. Forgot that was linked to the multifractal analyses, not the generalized Fractal Dimension which is what i was referring to. Not sure what the limits are for multifractals.