Guest Post by Bob Tisdale

With the El Niño-related uptick in the February 2016 GISS Land-Ocean Temperature Index, Figure 1, alarmism has reached beyond the Spinal Tap 11 volume setting, up to 20. (For those in need of a chuckle, the YouTube video of related portion of This is Spinal Tap is here. Thanks to Rob Reiner and Christopher Guest for that very funny scene.)
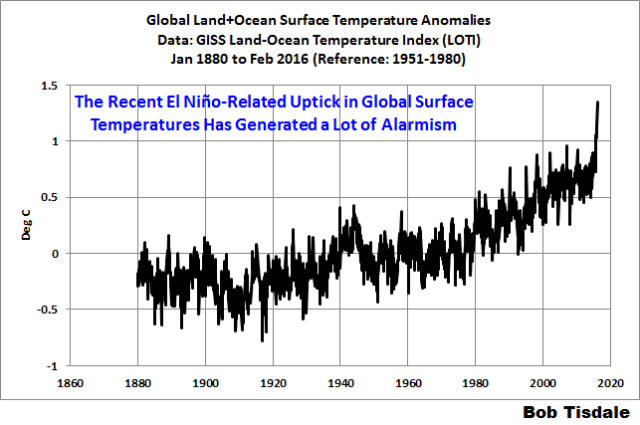
Figure 1
INTRODUCTION
Here are a few examples.
The Reuters article Record surge in 2016 temperatures adds urgency to climate deal, say scientists features some notable quotes and a photo of a dead cow in South Africa—yes, a dead cow, a solitary dead cow, without explanation—as if to say, Oh look, a dead cow. It must be due to global warming. Also, I believe on-the-dole activists in the title and text would be more appropriate than scientists.
The always-entertaining Dr. Michael Mann claims on Twitter here:
NH ave temp reached ~2.5C relative to pre-industrial last month (background: http://www.huffingtonpost.com/michael-e-mann/how-close-are-we-to-dangerous-planetary-warming_b_8841534.html …) (h/t #Tamino)
Curiously, the graph Michael Mann linked from Tamino (Figure 2) doesn’t illustrate Northern Hemisphere temperature anomalies referenced to pre-industrial times. Is Mann guessing the February value was approximately 2.5 deg C when referenced to pre-industrial times? Additionally, the UN’s 2-deg C assumed-bad-things-will-happen threshold is for global temperature anomalies above pre-industrial values, not Northern Hemisphere temperatures.

Figure 2
Chris Colose on twitter with the illustration supplied with his tweet here contradicts Michael Mann. That graph does have the anomalies for the Northern Hemisphere referenced to “pre-industrial” times or as close to pre-industrial that we can come with the data at hand. See Figure 3. The February 2016 value falls short of 2.5 deg C, so we might conclude that Michael Mann had, in fact, guessed. And again, the UN’s assumed 2-deg threshold of bad things to happen relates to global temperatures, not those of the Northern Hemisphere. Yet the alarmists seem to be fixated on the North Hemisphere temperature anomalies this month.

Figure 3
Not surprisingly, in his blog post Surprise, but not shock, statistician Grant Foster (a.k.a. Tamino) used an undocumented “model” to attempt to remove the effects of El Niño and La Niña events, variations in solar radiation, and volcanic aerosols from the GISS global temperature record. Apparently his model needs some work, because after supposedly removing the effects of El Niños it still shows an uptick caused by the 2015/16 El Niño. See Figure 4. Maybe Tamino forgot to apply his “more complex model of the el Niño effect, one which matches the 1998 outburst” to the comparably sized 2015/16 El Niño, because as well see in a few moment the changes in global temperatures are also comparable.

Figure 4
We’ve also discussed and illustrated for many years that the long-term effects of strong El Niño events cannot be removed from the instrument temperature record with statistical models like Tamino’s. That is, strong El Niño events contribute to long-term global warming by releasing vast amounts of sunlight-created warm water from beneath the surface of the western tropical Pacific and relocating it to the surface. That’s the simplest explanation of how a strong El Niño contributes to long-term global warming. Some of that warm water released by the El Niño in turn releases heat to the atmosphere, primarily through evaporation. But the remaining warm waters (the leftovers) don’t magically disappear after the El Niño, as Tamino and some from the climate science community would like you to believe. See the discussions of “big jumps” in the Open Letter to the Royal Meteorological Society Regarding Dr. Trenberth’s Article “Has Global Warming Stalled?”
“RECORD SURGE”
The headline of the Reuters article reads Record surge in 2016 temperatures adds urgency to climate deal, say scientists. The phrase “record surge” suggests a never-before-seen upward change in global surface temperatures. But there’s nothing unusual about the January to February 2016 change in monthly global surface temperatures represented by the GISS Land-Ocean Temperature Index. See Figure 5.

Figure 5
Nor is there anything unusual in the most recent 13-month change in global surface temperatures, according to the GISS data. See Figure 6. In fact, the “annual” changes in response to the weak 1994/95 El Niño and the strong 1997/98 El Niño surpassed the change so far to this El Niño. With the uncertainties of the data, the changes in 1997/98 and in 2015/16 are at best comparable. Forgetting the uncertainties for a moment, the recent 13-month change has been surpassed many times previously.
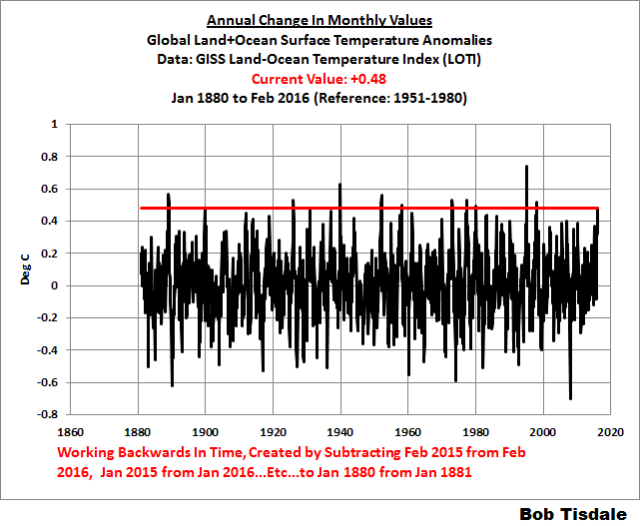
Figure 6
That obviously contradicts the statement in the Reuters article that was attributed to Phil Jones:
Phil Jones, of the Climatic Research Unit at the University of East Anglia, said El Nino seemed less to blame for the current surge than the last big El Nino in 1998.
Sounds like more guesswork from the climate science community to me.
That “last big El Niño” actually took place in 1997 and 1998, not solely 1998. It evolved in 1997 and decayed in 1998.
Another way we can illustrate the similar global temperatures responses to the 1997/98 and 2015/16 El Niños is by comparing the related global temperature data from January 1997 to December 1998 and from January 2015 to present. See Figure 7. Note, for comparison purposes, that the data have been normalized to the first 3 months of their respective periods.

Figure 7
Looking solely at the plots, in 2015, global surface temperature anomalies declined at first. In other words, global surfaces during those El Niño development years initially warmed faster in 1997/98 than in 2015/16, but the values in 2015/16 recently caught up. The delayed upswing in 2015 makes the recent uptick look ominous. Additionally, that graph doesn’t consider the uncertainties of the data. As noted on Figure 7, GISS doesn’t publish uncertainties with their monthly global LOTI data. If we assume they’re comparable to the data from NOAA, the recent monthly uncertainties are about +/- 0.17 Deg C. (See the NOAA webpage here.) Realistically, contrary to the claims attributed to Phil Jones, the best we can say is that the global temperature responses to both El Niño events are comparable, given the uncertainties of the data.
WAS CHRIS COLOSE’S ILLUSTRATION ABOUT NORTHERN HEMISPHERE SURFACE TEMPERATURES CORRECT?
I get similar results when I reference the GISS LOTI data to the “pre-industrial” period of 1880-1909 for anomalies. See the top cell of Figure 8. But once again, the assumed 2-deg threshold of bad things to happen relates to global temperatures, not those of the Northern Hemisphere. So in the bottom graph, I’ve included the Southern Hemisphere GISS LOTI data. It shows warming at a much slower rate and fails to show the major uptick from January to February 2016, which gives you an idea of why Mann and Colose are concentrating on the Northern Hemisphere with its uptick.

Figure 8
The global results are shown in Figure 9. They are as one would expect from the two hemispheres.

Figure 9
Alarmists see that recent upswing and attribute it to manmade global warming, but it’s comparable to the rise in global temperatures in response to the 1997/98 El Niño. With the current decay of the 2015/16 El Niño, the possible transition to a La Niña and the dissipation of The Blob, global surface temperatures are not going to stay at that new peak value. They’re going to drop and future newcomers to the global temperature record are going to wonder what caused the odd-looking spike in 2015/16.
Notes: We discussed and illustrated the natural causes of the claimed 2014 “record high” surface temperatures in General Discussion 2 of my free ebook On Global Warming and the Illusion of Control (25 MB). And we discussed the naturally caused reasons for the record highs in 2015 in General Discussion 3.
We recently showed in the post here that global sea surface temperature anomalies and those in both hemispheres dropped from January to February 2016. That means the January to February uptick in global land+ocean surface temperatures occurred primarily in the (boreal winter) land surface air temperature anomalies. We also showed that, even though the 2015-16 response globally is less than that in 1997/98 (graph here), the sea surface temperatures surged higher in the Northern Hemisphere in late 2015 than was ever achieved in 1997/98 (graph here). It’s very possible the recent surge in Northern Hemisphere land surface air temperature is in part a delayed response to that surge in Northern Hemisphere sea surface temperatures. [End notes.]
GLOBAL WARMING VERSUS THE 2-Deg C LIMIT BASED ON LINEAR TRENDS
The climate science community when acting as scientists uses linear trends to describe global warming. Activists, on the other hand, attempt to alarm the public with every upward wiggle in global surface temperatures.
Figure 10 includes the global GISS LOTI data. For that graph, I’ve shifted the data so that the linear trend line intersects with zero at the start of the data, January 1880. Why? “Pre-industrial” refers to the time before the Industrial Revolution, which is typically said to have occurred from 1750-1850. Unfortunately, the end of pre-industrial times, 1750, is well before the January 1880 start date of the GISS data, so, given what we’ve got, I’ve zeroed the trend line at 1880.
We’ve already shown that there can be large variations in monthly and annual surface temperature anomalies. See Figures 5 and 6. Also note that there are multidecadal changes in the global surfaces temperature anomalies. This is easy to see with the data being located above the trend line for some multidecadal periods and below the trend line for others. Those monthly, annual and multidecadal variations skew our perspective of the change in global surface temperatures. A linear trend line accounts for those monthly, annual and multidecadal wiggles.

Figure 10
Relying on the linear trend line as our global warming reference, global surface temperatures since 1880 have not yet reached the halfway point of the UN’s 2-deg C assumed-something-bad-will-happen threshold for global temperature anomalies.
WHAT ABOUT THE CLIMATE MODELS?
It should come as no surprise: with all the nonsensical hubbub about the recent El Niño-related uptick in global surface temperatures, not once has anyone mentioned the continuing disparity between observed global warming rates and the global warming as simulated by the CMIP5-archived climate models, which were used by the UN’s Intergovernmental Panel on Climate Change (IPCC)—a political body, not a scientific one—for their 5th Assessment Report. I’m happy to overcome that deficit and illustrate the continuing problems with the models. For the models, we’re using the multi-model mean of the climate models stored in the CMIP5-archive, with historic and worst-case RCP8.5 forcing projections. The model mean basically represents the consensus (the groupthink) of the modeling groups for how global surface temperatures should vary if they varied solely in response to the anthropogenic forcings (manmade greenhouse gases, etc.) used to drive the models. And for the data, we’re using the GISS Land-Ocean Temperature Index, which has been the subject of this post. For more information on the use of the model mean, see the post here.
Climate is normally defined as average weather and the typical timeframe is 30-years. Figure 11 includes a model-data comparison of the 360-month (30-year) trends in global surface temperature. The 360-month trends are aligned with the last month of the respective period (thus the term “trailing” in the title block). Notice that the scale of the y-axis (vertical axis) is deg C/decade, not simply deg C. Basically, the graph illustrates the simulated and observed 30-year warming and cooling rates; that is, it shows how fast global temperatures warmed or cooled over those 360-month periods.
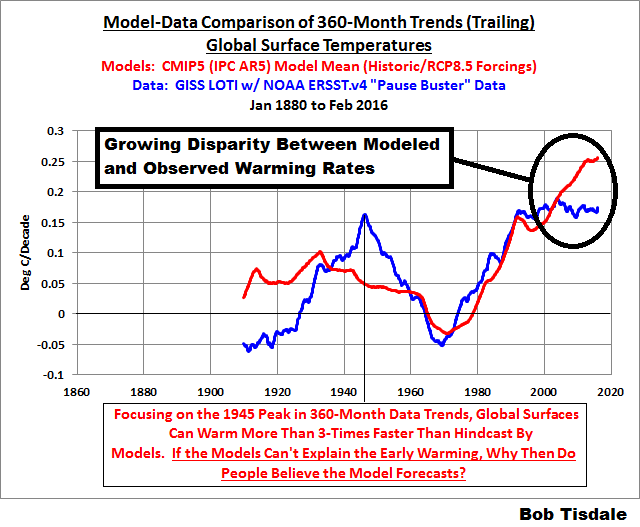
Figure 11
First note that the uptick in global surface temperatures in February 2016 had no real impact on the most recent 30-year trends. The tiny upswing at the tail is no greater than other variations.
Also note how, for the more recent warming, the data trend plateaus starting with the 30-year period ending in the early 1990s. The models show the 30-year warming growing faster and faster (accelerating) over the past decade or more, while the data show no acceleration since before the early 1990s. The fact that global warming over 30-year periods, according to the GISS data, has not accelerated for more than 2-decades is a problem for the modelers. If in the near future, global warming based on 30-year trends continues not to accelerate, people may start to realize there may be a maximum rate at which global surface temperatures can rise, regardless of how much CO2 is pumped into the atmosphere. That certainly would be a problem for all of the UN’s prognostications of gloom and doom.
The other big problem for the modelers is the disparity in 30-year warming rates ending about 1945. The data indicate that from about 1916 to 1945 global surfaces warmed at a rate that was slightly more than 0.15 deg C per decade (which is comparable to the recent warming rate we’ve been stuck at for the past 2 decades). On the other hand, the models indicate that if global warming was limited to the forcings used to drive the models, global warming should only have occurred at a rate that was roughly 0.05 deg C per decade. In other words, the data shows that global surface temperatures can warm 3 times faster than predicted by the models. Of course, if the models can’t simulate it, it must have occurred naturally. And that suggests two things: (1) that two-thirds of the recent warming could also have occurred naturally and (2) that the climate models have been tuned so that they are way too sensitive to manmade greenhouse gases.
CLOSING
There have been and there will continue to be lots of nonsensical comments about the recent El Niño-related upticks in global surface temperatures. We’ve addressed many of them in this post. GISS released their February data a few days ago. NOAA’s are set for release on March 17th, with the UK Met Office’s data due later in the month. I can’t foresee any other nonsensical comments from alarmists, but, then again, they’re always full of surprises. We’ll take them as they come.
Though not discussed in this post, the GISS Land-Ocean Temperature Index uses the new ERSST.v4 “pause buster” from NOAA. It has many curiosities over the term of the data, as discussed and illustrated in the posts here and here. Referenced to their standard base years of 1951-1980, the February 2016 GISS LOTI anomaly with the NOAA “pause buster” data is 1.35 deg C, with the NOAA ERSST.v3b sea surface temperature data they used before that, the February 2016 value is 1.27 deg C, and with the original combination of HADISST and Reynolds OI.v2 sea surface temperature data, the February 2016 value was 1.26 deg C. While there is a noticeable difference, the upticks from January to February 2016 (+0.21 with ERSST.v4, +0.19 for ERSST.v3b, and +0.19 deg C for the HADISST/Reynolds OI.v2) were comparable.
Note to Reuters: Please continue to show dead cows in your future global warming articles. They remind me of Gary Larson’s The Far Side cartoons. Larson seemed to enjoy including cows in those cartoons.
SOURCES
The GISS Global LOTI data are here. For the Northern Hemisphere, they’re here, and for the Southern Hemisphere, the GISS LOTI data are here. Outputs from the CMIP5-archived climate models are available from the KNMI Climate Explorer.
FOR THOSE NEW TO DISCUSSIONS OF EL NIÑO EVENTS
I discussed in detail the naturally occurring and naturally fueled processes that cause El Niño events (and their long-term aftereffects) in Chapter 3.7 of my recently published free ebook On Global Warming and the Illusion of Control (25 MB). For those wanting even more detail, see my earlier ebook Who Turned on the Heat? – The Unsuspected Global Warming Culprit: El Niño-Southern Oscillation. Who Turned on the Heat? only costs $5.00 (US).
The warming that El Nino would cause was well documented before it actually happened, as was the following La Nina, which will cause cooling. I take it like every other negative, the La Nina event will be ignored by the hysterical alarmists.
I get it that the establishment will only report on record heating – most especially during times of El Niño. But is there a reliable source reporting on months/years of record cooling? I recognize that the sample size of a 100+ years is far too short to make any definitive prediction since, from what I’ve gathered, the climate operates on a geological time scale rather than the human lifespan…
But it would be nice to see the flip side to all of this nonsense, if at the very least, so that the public can weigh in on the differences.
The warming in this study was not:
So where does this “would have been” come from? No mention of a control group. This sounds more like someone’s modelled “expectations” than science.
Oh, what, lab conditions, how silly? You mean they actually controlled more that one variable? Wow.
Perhaps the paper discusses this in more detail but this sounds like they did not control for humidity and rainfall (or even measure it.)
save-the-planet alarmism was actually more absurd than this during the heydays of the ozone hole? remember the ozone hole? how soon we forget.
http://papers.ssrn.com/sol3/papers.cfm?abstract_id=2748016
And wasn’t the the depletion of the ozone linked to our Sun going into a solar minimum?
The more CMEs we get the stronger our magnetosphere becomes , with the downside of increased tectonic activity or Earthquakes; and the weaker it gets the weaker our magnetosphere becomes thus opening us up to more gamma radiation at the poles…
Am I at least on ball?
” because as well see in a few moment the changes in global temperatures are also comparable. “…should be ” we’ll see “
There is nothing ‘extraordinary’ about the Feb 2016 spike, the way I look at it, it has happened before on a number of occasions and to a greater degree
http://www.vukcevic.talktalk.net/GISS-tmp.gif
How does the 4-month spike stack up historically?
Hi Bill
As it can be seen from the blue graph (comparing to the same months of the previous years) there is nothing unusual about it, and it has been exceeded on number of times before, notably in 1985.
I think that the climate scientist make an important error ignoring seasonal pattern. N. Hemisphere warms and cools faster than the South, but heat energy absorbed by the South is retained for longer, this of course is due to ocean-land distribution differences.
Thanks again Bob for supplying the historical context that is always left out of alarmist PR releases.
The dead cow is a moo’ point: its’ entrails foretell everything for the profiteers of doom.
Sticking it to the alarmists from Mark Steyn — http://www.steynonline.com/7488/sticking-it-to-the-alarmists
“Curiously, the graph Michael Mann linked from Tamino …”
There is nothing but junk science and false information that ever comes from “Dr.” Mikey Mann.
There is nothing but junk science and false information that ever comes from “Dr.” Mikey Mann
Big Call. I see he has 146 papers with over 10 citations. I suspect that you haven’t read them all.
Some people did. Hence the citations. Either you or all of them are wrong. Which do you think is more likely?
Comparing the anti-scientific history of what currently passes for climatology, and previous comments I have read from markstoval, I think that markstoval is much more likely to be correct.
You are an expert in climatology then?
Must be in order to make that comment with any authority.
If not (as I suspect) your opinion is worthless.
seth,
“Dr.” Mann has refused to yield the data that he used to re-write the history of climate on the earth. That is dishonest and is anti-science. That and the horrific use of statistics (“new methods”) tell me that he has not done real science.
You like one tree changing all of climate history?
seth says:
I see he has 146 papers …
Prof Richard Lindzen has twenty dozen papers, and they generally contradict what Mann is peddling.
Since you started this “Mine is bigger” game, this is just to point out that you lost.
Must be in order to make that comment with any authority
==============
nope. All that is needed is a good set of Mark 1 BS detectors.
Mikey’s friends and co-conspirators sometimes cite his papers.
So what.
PS: 10 cites for 146 papers? Doesn’t sound like even Mikey’s friends think all that highly of him.
“Doesn’t sound like even Mikey’s friends think all that highly of him.”
http://www.steynonline.com/6565/the-lonesomest-mann-in-town
“not a single amicus brief was filed on behalf of Mann. Not one. So Michael Mann is taking a stand for science. But evidently science is disinclined to take a stand for Michael Mann. The self-appointed captain of the hockey team is playing solo.”
My vote is the crack pot government employee, who got caught claiming a hockey stick generator is an actual analysis tool,
and who then sued a guy who said he is a liar,
and got caught lying in the court documents of the suit, that he won a Nobel Prize, is most likely to be the
crackpot loser peddling idiocy to low information voter types.
Here’s what Edward Cook thinks:
“…I think that Mike is becoming a serious enemy in the way
that he bends the ears of people like Tom with words like “flawed” when
describing my work and probably your and Keith’s as well. This is in part a
vindictive response to the Esper et al. paper. He also went crazy over my
recent NZ paper describing evidence for a MWP there because he sees it as
another attack on him…”
Pretty sure Cook, Keith (Briffa), and the recipient (Phil Jones) have a vast array of papers and citations, too.
Keep in mind that some citations are part of criticisms as well.
Comparing the anti-scientific history of what currently passes for climatology, and previous comments I have read from markstoval, I think that markstoval is much more likely to be correct.
Mann is well respected in the scientific community.
https://en.wikipedia.org/wiki/Michael_E._Mann#Awards
Two of his papers have over 1800 citations. 146 of this papers have over 10 citations. He has cut a lot of ground on proxy temperature reconstructions, work which has been reproduced in scores of papers. His work was fundamental in the discovery of the AMO, and has lead to more sophisticated ways of detecting trends amongst the climate with many such oscillations.
More recently he has turned his eye to the important for policy job of attribution of warming to anthropogenic forcing.
http://www.ncbi.nlm.nih.gov/pmc/articles/PMC4726353/
It’s all good work, and some of it is ground breaking where a lot of discoveries have since been made.
markstoval wrote: You like one tree changing all of climate history?
One tree doesn’t change climate history for the globe. At most it casts a small shadow, increases local humidity and decreases local albedo.
dbstealey wrote:Prof Richard Lindzen has twenty dozen papers, and they generally contradict what Mann is peddling.
I think that you’re mistaken about both those points. He has about ten dozen papers, not all with 10 citations. The majority do not contradict any of Mann’s findings.
Since you started this “Mine is bigger” game, this is just to point out that you lost.
Don’t be ridiculous. If I was going for comparison of citations, I would be talking about highly cited climate change authors.
http://assets.carbonbrief.org/wp-content/uploads/2015/07/top-fifteen-most-cited-authors-in-top-100.png
But since you bring up the comparison, what were Linzden’s h-index and i10 index, and the end of his career? (I note that Mann is still publishing). He doesn’t have a google scholar page like Mann does.
https://scholar.google.com/citations?hl=en&user=KrRw4RIAAAAJ
Seth says:
I think that you’re mistaken about both those points. He has about ten dozen papers, not all with 10 citations. The majority do not contradict any of Mann’s findings.
I wrote nothing about citations, so that’s just deflection. And if the ‘majority’ do not contradict Mann, that implies that some do. As Einstein said, all it takes is one.
As I wrote, Prof Richard Lindzen’s CV lists 240 publications that he authored or co-authored. 240 = 20 dozen.
But you’re right, the numbers are not the most important thing. What’s important is ethical scientific behavior, which Michael Mann lacks. He’s claimed to have been awarded the Nobel prize. And his Climategate emails show him to be not just ethics-challenged, but ethics-free.
And of course, Mann was forced to publish a Corregendum related to his hokey stick nonsense, in which he attempted to erase the MWP and the LIA. Can you imaging if the people who put Mann in that position had written the Corregendum, instead of Mann’s self-serving pablum?
Would you like to ratchet up this discussion? I have plenty more to say about Michael Mann.
ooh are you flogging consensus again?
“One tree doesn’t change climate history for the globe. At most it casts a small shadow, increases local humidity and decreases local albedo.”
I see you don’t know the history and facts of the “hockey stick” graph. It is based on just a few trees and one outliar tree dominated the results. See any of the many debunkings of “Dr.” Mann’s horrible paper.
On your other mistaken point, the “hockey stick” (see in the propaganda movie by Al Gore) did, in fact, seek to overturn all temperature time series. It even was counter to the views of the great Dr. H. Lamb!
I see you are only a troll, but darn man you can do better.
The temperature in February was absurd. I disagree that this is less of a concern because January was half as absurd, and the November and December before that were warm. But I think that’s pretty obvious.
It has changed the discussion. The next talk of a hiatus will be “There hasn’t been much warming since 2016”.
…Ummmmm, it’s called an EL NINO !!!!
There have been El Ninos before, but there have never been global temperatures this high before.
Yes the El Nino has contributed to the surge in temperatures, and the will probably step back a little as they did after 1998, but with after 1998 the new normal temperature exhibited the greatest decade-to-decade warming on record, and this peak looks higher.
Hi Seth. Are you aware that the Tropics satellite temperatures for Feb 2016 are about 0.3 C cooler than Feb. 1998.
…Remember that little thing called the Little Ice Age ?? Do you really think it would get colder coming OUT of the LIA ?
seth says:
…there have never been global temperatures this high before.
You’re obviously new to this. Best to get up to speed before posting more nonsense like that. Readers here don’t tolerate fools lightly.
but there have never been global temperatures this high before
=========================
nonsense. they have been much higher 6-8 k years ago when the Arctic was ice free. same for the 1-2k year cycle of warming we have had since then.
seth, my child, in this case, ever only goes back about 40 years.
You do realize that we are talking about the satellite record, don’t you?
It’s killing the Bees again. The rapid decline of bees and other pollinators worldwide prompted this act from Honey Nut Cheerios. http://www.theweathernetwork.com/news/articles/buzz-disappears-in-response-to-declining-bee-population/64994/
Well it has been a very nice winter here in central Oklahoma, and personally I appreciate it much more than the blizzards of a few years ago with 60mph winds and horizontal snow so thick that I couldn’t see a neighbors house 200 feet away. However I also know that, given time, those conditions are likely to return; it’s called “climate change”.
garymount said : Hi Seth. Are you aware that the Tropics satellite temperatures for Feb 2016 are about 0.3 C cooler than Feb. 1998.
RSS Data:
1998 Feb +0.736°C
2016 Feb +0.974°C
UHA Data:
1998 Feb +0.651°C
2016 Feb +0.896°C
I think you’re mistaken. It’s about 0.24°C or 0.25°C warmer in Feb 2016.
http://woodfortrees.org/graph/rss/from:1998/plot/uah/from:1998
Garymount,
Yes, you are right, the tropical troposphere was warmer in Feb 1998 compared to now. Hence, it must have been a relatively stronger el Nino back then. Despite this, the peak-to-peak increase in global temperatures is 0.47 C according to Gistemp loti. Can it possibly be some AGW at work?
Seth, my good mann are you really using your own time doing trollwork?
seth,
Your WoodForTrees link nicely captures the 18+ year long ‘Pause’. Very good.
Now, let’s wait an equal time frame before we start getting dizzy over a few months.
K?Thxbye.
It really does amaze me how ignorant most warmists are.
When the temperature drops back down to pre-El Nino levels, the hiatus will return to it’s 20 year mark.
I’m guessing you are actually stupid enough to believe that the hiatus is calculated using a simple straight line graph.
Perhaps not ignorant. They just like the taste of their favorite kool aid and keep on drinking it without regard to the consequences. On second thought, maybe that is ignorance.
Temperature anomaly – being precise is nice though somewhat whimsical in climate science generally.
Being merely halfway to the 2°C limit is not comforting me.
Do you have a plan for stopping the increase, or do merely not like children?
Actually, just don’t like children, why do you ask?
By the way, where did that 2 degree limit come from? As near as I can tell, it was just popped out of thin air. There does not seem to be any calculation, justification, or rationale behind it. The 2 degree limit was just set out, and all kinds of different people started getting all worked up over it. Almost as if on cue.
A Clue:
Back when the issue was Catastrophic Global Warming, The figure of merit was the warming due to a doubling of CO2. If that figure was greater than 2.5 deg., then an “enhanced water vapor effect” would take over, and we were all going to die. It was grudgingly conceded that if that figure was less than 2.0, there would be no “enhanced water vapor effect”, and the whole CAGW fiasco would disappear in a puff of black greasy smoke.
Well, over time, the best estimate for that figure kept going down, and CAGW was threatened.
Right then, quickly and in a coordinated fashion, CAGW was rebranded as Climate Change. In addition, the 2.5 deg. due to a doubling of CO2 was changed to 2 deg. warming over the Little Ice Age which will cause catastrophe.
Sounds more like public relations than science to me.
Hey You. Yes, You. GET OFF MY LAWN. Brat!
Kids these days.
Nice 😄😄😄
TonyL Wrote: By the way, where did that 2 degree limit come from?
It’s a limit agreed between nations as the meaning of “Dangerous Climate Change”. It’s informed by economics, but ecologists generally think that it’s way too high.
Back when the issue was Catastrophic Global Warming, The figure of merit was the warming due to a doubling of CO2.
I’m not familiar with that issue. Can you link me to a scientific or political document that describes what that is?
I ask because I think you’re making things up.
Seth,
I see you’re at the ‘Say Anything’ stage now. A 2º rise in global T would be no more ‘dangerous’ than another hundred ppm rise in CO2. Both would be entirely beneficial, with no downside.
But it’s amusing to see how worked up some folks can get over these non-problems.
Hi Seth. I have a plan to take it up a notch on the way all this climate science information is presented to the public using the most up-to-date computing technology available to the consumer. Using my 40 years experience as a computer scientist. It’s going to knock your socks off on the breadth and depth of what I have in the works.
The project is code named Wattson. I have decided on a Halloween 2016 coming out party of the full details. Well, gotta run, I have an extraordinary amount of work to do and many things still to study.
ggm
Dude!
Was that termpaper on computer use prepared on a typewriter?
With a cloth ribbon?
@TonyL
Heck, he’s lucky he had a typewriter. A similar work by yours truly junior year in high school would have been in longhand.
That document couldn’t be from the Texas ANG, because there’s proof they used word processors and Times New Roman font, auto-spaced. Just ask Mary Mapes.
What 2°C limit?
You do know that it was just a made up value don’t you?
Have you never heard of the previous warm periods when temperatures were higher than now?
You also do know that 0.8°C of the increase is due to the “Adjustment process”?
seth – you realize, don’t you, that Obama’s multi-trillion dollar ‘non-plan’ to gut the supply of cheap carbon-based energy, and replace it with unreliable and expensive alternatives, will not reduce global temperatures by more than 0.1C by 2050? So in summary, Obama has no plan to stop the increase either, but he does have a plan to rape you for $ trillions and give it to non-tax payers in exchange for their votes.
seth,
Being merely halfway to an arbitrary limit with no scientific justification and pulled out of thin air for scaremongering and PR purposes is not comforting you?
You are gullible! I’ll bet that you are also discomforted by the fact that 97% of “climate scientists” believe that most of the recent warming is caused by humans and that the results will be catastrophic!
I ‘d like the future generations to be healthy happy and prosperous.
Which the warmist future does not provide..
Limits, death, and misery..
So much arrogance, so little knowledge.
Yup another warmer troll.
Why is it bad for the earth to warm 2C? It’s been warmer than that many times over the last 10K years, and nothing bad happened?
Why do you want children to freeze to death?
Why is it bad for the earth to warm 2C?
Climate change puts extinction pressure on ecosystems, alters the viability for land use, importantly agriculture, and raises sea levels.
As it goes it will pass tipping points which will throw the climate into very different states, changing a lot of infrastructure, and displacing many people. Such as the loss of the northern summer sea ice.
2C was negotiated by nations to be the target with acceptable risk.
It’s been warmer than that many times over the last 10K years, and nothing bad happened?
There’s a lot more infrastructure and agriculture now, and ecosystems are under additional pressure from over-exploitation, pollution and habitat loss.
Also you’re probably mistaken about that “many times in the past 10K years thing”
http://www.realclimate.org/images//Marcott.png
@Seth,
You might like to know that the 2C limit was originally plucked out of an economist’s nether region and is really of no significance at all –
http://www.economist.com/blogs/economist-explains/2015/12/economist-explains-4
Also as far as temps for the past 10 thousand years go:
http://www.climate4you.com/images/GISP2%20TemperatureSince10700%20BP%20with%20CO2%20from%20EPICA%20DomeC.gif
And while we’re at it, lets take a peek at the last few hundred thousand, eh?
http://www.climate4you.com/images/VostokTemp0-420000%20BP.gif
The Earth’s Climate has a nasty habit of changing rather dramatically on a regular basis all by itself, it doesn’t need anyone else to help it along, thank you very much. One might say it is self regulating.
Seth, ‘Climate change puts extinction pressure on ecosystems, alters the viability for land use, importantly agriculture, and raises sea levels. .”
Global cooling is also climate change, it “puts extinction pressure on ecosystems, alters the viability for land use, importantly agriculture”.
Yirgach wrote: You might like to know that the 2C limit was originally plucked out of an economist’s nether region and is really of no significance at all –
Yes, it’s not enough to preserve much biodiversity. It should catch us before a drop in global food production.
Also as far as temps for the past 10 thousand years go:
That plot isn’t a global average. It’s the top of the Greenland ice sheet. As you can read from the Y-axis.
Obviously regional temperature is more variable than global temperature. For global temperature see my plot we are already above the top of the Holocene, even allowing for the margin of error all falling upwards.
Is the bottom graph the local temperature at the Vostok Core?
Deep cores like that can exaggerate cold periods because the altitude of the top of the ice sheet changes a lot with temperature on that time scale.
Seth says:
we are already above the top of the Holocene
Nonsense. Maybe on your planet, but here on Planet Earth the Holocene has been cooling.
And I see you copied the Marcott chart I posted. heh. I suspected that would be red meat to the wild-eyed alarmist crowd.
But it’s a thoroughly debunked, bogus chart. Do a search for ‘Marcott’ here, and you will see dozens of articles with thousands of comments that thoroughly demolish Marcott et al.
If you refuse to read those links, you’re commenting out of ignorance. If you read them, and still believe Marcott’s methodology hasn’t been shredded, then you’re just a religious True Believer, and no facts can possibly open your mind.
Next, ‘Yirgach’ posted visuals showing that a 2º higher global T has happened routinely in the past, without any ‘runaway global warming’ or other scares. Here’s another one, by an internationally recognized and respected climatologist:
http://www.climate4you.com/images/SummitAndCulture.gif
(Click in images to embiggen)
And we know the planet has been warming naturally at the same rate for a long time. There is no acceleration in global warming, despite the rise in CO2, further falsifying the alarmist conjecture.
Finally, you’re terrifying yourself like ISIS is at the door, but when we observe what global T is doing on a normal axis, it’s crystal clear there is no problem:
But it’s always amusing to see someone who’s swallowed the alarmist Kool Aid. Keep it up.
seth March 16, 2016 at 5:30 am
“Being merely halfway to the 2°C limit is not comforting me.”
Let me tell yo what “not comforting” really is. It is an 11 year old boy watching the news as the world comes to the brink of nuclear war. It is an 11 year old boy having a family fallout shelter salesman in your living room going over the possible catastrophic results of such a war (no my dad didn’t buy). It is an 11 year old boy doing nuclear bomb protection exercises in classrooms. There are far worse things to worry about even now than a little beneficial warming.
There are far worse things to worry about even now than a little beneficial warming.
I don’t think that needs a response. I’m just copying it so you know I read it.
Who has “a plan for stopping the increase?” Political actions are projected to accomplish next to nothing.
It’s safe to say your line of questioning reflects that you “like children.” But it’s not the children of today that you care about…it’s children who won’t exist until 50 or 100 years from now. There are millions of children who would benefit from cheap energy right now. Why don’t you like them?
Do you have a plan for indicating biodiversity will get anything but more robust with more warmth, and more moisture?
Do you have a plan for indicating when that runaway humidity is going to start showing it’s face around the planet?
Do you have a plan to how the atmosphere is heating in any physical way, beside the fact a bunch of alarmists caught and admitted, faking data since 1998, swear on your grave it is?
Do you have the slightest indication in the real world, such as say, the entire aviation industry who fly through the precise regions of the tropopause that would be heating most – coming out saying yes, those scientists got caught lying cheating and stealing – Mann claiming to be a Nobel winner, then telling his stories about his fake hockey stick generator even his friend admitted was giving him hockey sticks – do you have any indicator from anybody else that the atmosphere is actually heating?
It’s not more humid so that’s a major problem with your bullh** story.
There’s not a single word from the various aircraft industries, the avionics sensing industries, the military research sensing industries, about how they’re noticing the mandatory hot spot for a warmer atmosphere.
We have the infrared astronomy field and it’s stone cold silent after decades of squealing cries from so called scientists who can’t keep straight whether they won a Nobel or not: hacks like Hansen who claimed his office was going to be under water:
from balmy weather, and high humidity, Seth. Why no balmy weather and high humidity swamping Homer Hansen’s office windows?
Do you have any answer why not one single sensing field in atmospherics has said a word about their own detection of the climbing temperatures you swear are real,
but which Phil Jones personally admitted faking to Mike Mann in 2005, to the BBC in 2010, and which the Met Office verified hadn’t warmed a whit sinc 1998 when your religious leaders
started lying?
It’s the leader of your organization who melted down and admitted to the BBC in his Feb 2010 don’t go to jail article that he was fabricating warming since the mid 1990s.
It’s the leader of your organization who told Michael Mann in 2005, that he’d been fabricating warming since 1998. And that if he revealed that to the scientific community they would come down on him in no uncertain terms.
You’re wheeling around barking like a dog snapping soap bubbles, and the only real meat you’re gonna catch is your own tail, because your leaders admitted they were fabricating warming since 1998.
That can’t be un done by you. You don’t come here with what’s called in law, ”clean hands.” You come from the teachings of known, admitted scammers who faked data for 12 years: data that the planet continued to warm when in fact it had cooled a little.
You’re lying.
You’re acting like you haven’t had the chance to check on Phil Jone’s admission to Mike Mann it stopped warming in 1998 and he’d be damned if he would reveal that to the scientific community.
You’re acting like no one showed you how to find Phil Jones’ Feb 2010 interview where he admitted faking warming data since the mid 1990s.
You’re speaking like a mentally ill person claiming you think someone here has perpetrated improper record management or measurement or has perhaps constructed a faulty algorithm. That real scientists finding the flaws in your religion got caught doing all that.
We didn’t. We caught your leadership doing all that. Faking claims of being Nobel Laureates in court.
Admitting to deceiving the entire scientific community for more than twelve years.
Those are the leaders of the movement you joined. So they work for the government. They’re immune to lying like Dick Nixon and the war on pot started by FDR ?
Those are your scientific personnel who got caught fraudulently faking global data for twelve years.
Those are your scientific advisors who told people on tv they thought they would be going to work in a row boat.
Those are your scientific advisors who told you a gas with less specific heat than standard atmospheric air was going to create a more heated surface than the gases with higher specific heat,
till runaway humidity made the entire globe start warming catastrophically somehow or other.
You haven’t come to me with the first rational, reasonably authentic assertion of anything at all, except that you don’t realize the men who told you the world is warming, admitted it stopped warming and that they were intentionally hiding that from you – not to each other only but to international media, in a don’t-go-to-jail interview.
You need to sober up some and realize how stupid, you’re obviously acting, just like that DefTone character.
The one who claims he’s a meteorologist but he can’t find any other data sets on this planet to indicate it’s heating, the same way you can’t.
No worldwide conclusion by every instrumentation branch on earth that – oh yeah planes, research vehicles, planned space shots, everything – it’s all showing warming, and nearly all showing the same thing:
the infrared astronomy field, the many various sensing fields worldwide – you both sit there like sullen stumps, repeating over and over, ”but – the authorities said!”
The authorities – the specific authorities you two are here to cheerlead for: admitted they were lying about the warming, to keep from going to jail.
And got caught talking about it to each other, years before, when they got snowdened.
You’re in here sounding like you wish you could convince us all pot really is heroin, if we would only believe the authorities and save ourselves the gateway to heroin, table wine and a spliff of pot at new years.
You’ve got the reasoning capacity of a child and you’re really an insult to adult thinking if you think you can simply handwave away the fact your leadership got caught admitting they were faking warming, and hiding it from the scientific community, for more than twelve years.
What you think by this time’s of course irrelevant; I’m just showing people how terminally simple minded you have to be,
to believe the world’s actually been warming – ANY – for the past twenty and maybe even more, years.
No matter how many teachers in school told you they’d give you a dare sticker if you’d turn your parents in, pot’s still not heroin.
No matter how many government employees tell you to ignore the vast array of instruments worldwide that show nothing and their open admission they’d been lying about the warming, and keeping it from the scientific community.
Authority worship is not science.
No matter how long you name drop the fact is, the people who know instrumentation will mock you, to your face: it’s why we all became instrumentation people: so clods like you, couldn’t show up quoting frauds like them, and make us look as gullible as you.
At least that’s why I went into the technical fields. So low information clods couldn’t lie to me and make me seem like I am as goofy as they are.
And that’s enough reason to go to college and become a scientist. So I don’t have to be the one showing up representing fakes and basically, criminopaths.
And you need to say something that explains all this being part of your religion besides ”I’m skur’d uh balmy wether so you need to be afraid too.”
No,
No I don’t need to be afraid just like I didn’t need to be afraid many years ago when Hansen and Mann were lying to congress about things that I knew just listening to them on tv were violations of thermodynamic reality;
like the fact there wasn’t enough sensing equipment to tell the temperature of the atmosphere. There was certainly enough equipment for those probes to sent back accurate data from Venus and ascertain that not only wasn’t there a runaway green house gas effect – there was none at all.
Every single thing you say – as well as that of Toneb – sounds like it was poured into a hole in your head with a funnel, and you managed to lumber over here and type a few rebellious syllables about how we’re all gonna see, pot’s heroin, and the sky really is going to catch on fire. And then we’re all gonna be sorry.
We’re just sorry you don’t have conscience enough to feel ashamed you’re here to represent admitted fakes of official international weather and climate records, for over a dozen years.
We’re also sorry you can’t give us any information on why – you claim it’s warming – but there’s not a single independent instrumentation field on this planet which concurs.
No infrared astronomy confirmation there’s more infrared –
no records from millions of flights by various aircraft over a century that – oh yeah the real tropopause heating is happening, necessary to match all that
infrared astronomy verification.
And the infor from all that amateur and institutional optical astronomy with their religious level record keeping of night sky viewing conditions,
and the turbulence created by – infrared heating of the atmosphere at night.
Nothing except sullen slurs from you
and the other authority worshippers: that, somehow your belonging to a religion created by government employees who got caught faking data,
makes you a better person than those of us who caught your leadership and put them in trembling tears, admitting faking records twelve years.
Lance:
“Every single thing you say – as well as that of Toneb – sounds like it was poured into a hole in your head with a funnel, and you managed to lumber over here and type a few rebellious syllables about how we’re all gonna see, pot’s heroin, and the sky really is going to catch on fire. And then we’re all gonna be sorry.”
Partly right my friend – in that people who are scientifically trained (or indeed anyone who is trained and works in a specialist field) – necessarily speaks “like it was poured into a hole in your head …”.
It’s called “learning” … you know like when (if) you went to college/Uni to learn whatever you are expert at.
In the case of science (as Newton said) “If I have seen so far – it is because I have stood on the shoulders of giants.
As for the rest of your post – it’s just an unintelligible rant my friend.
@ Seth
I do not usually respond to requests for citations, as that is usually trolling behavior. But you seem to be new here, so I will. Remember, as a scientist, you can find this stuff out for yourself.
We Said:
IPCC TAR
From here:
http://www.ipcc.ch/ipccreports/tar/wg1/355.htm#9341
The doubling of CO2 was a *HUGE* factor in the whole scheme of GW, certainly as far back as the third assessment report, and likely the first assessment report (FAR).
No, I do not have to make things up. I take it that because you did not know about the doubling, you are fairly new to this debate.
You said:
That is a political definition, not a scientific one. Hint: Politicians have been known to lie.
Your Turn:
Can you link me to a scientific or political document that shows this?
Emphasis on political document.
Yes, there has been an unprecedented, record-shattering spike in the levels of climate hysteria in the last few days.
One source of this is the so-called “Conversation”, which uses public funding and claims to be unbiased but seeks out the most extreme alarmists to promote its political agenda.
Two days ago we had Meltdown Earth: the shocking reality of climate change kicks in – but who is listening?. I tried to explain that the reason why people weren’t taking much notice was precisely because of all the shouty alarmism over the last twenty years, but ironically my comment was deleted and the comment thread was closed.
Then today they have an article by Rahmstorf, February’s global temperature spike is a wake-up call, about “the true climate emergency”.
Yes, oddly enough, humankind appears to have adapted already to the “terrors” of a gently warming planet. Plus, many municipalities have used less of their winter weather contingency fund than was budgeted, and less CO2 was generated by structural heating systems and idling vehicles. In reality, a warmer globe costs humanity less and stimulates food production, bolstering economies.
When the inevitable concurrent cooling of La Nina, a negative AMO and a grand solar minimum is upon us, there will surely be “weeping and gnashing of teeth” over the costs (monetary and Human) of adapting to the return of historical frigid conditions not seen in 200 years.
Wait… Are you saying that the C (in CAGW) is not correct? Well, I never…
…Since I already abused the word, I’ll just plead that folks get ‘historical’ instead of ‘hysterical’.
Bob, your figure 11 with the running trend analysis is distorted and misleading. You are effectively dong a 30y running mean on rate of change.
Running mean is an awful, distorting filter that I have suggested you stop using for years. The pointy graph you get is an artefact of your bogus filtering, so trying to claim “growing disparity” on that basis is not tennable.
Please learn a little about filters before trying to used them . Do you even realise that this constitutes running a filter on the data? Probably not.
….DONNNNNNNNG !
Greg says, “Running mean is an awful, distorting filter that I have suggested you stop using for years.”
The climate science community constantly uses running-mean filters. The climate science community uses running trends, Greg. If memory serves, Hansen et al. (2011) used 6-year running trends of ocean heat content data.
Thanks for your reply Bob. Sadly, saying climatologists do something is hardly a justification of it’s validity, is it? Otherwise we would not be here and this site would not exist.
Marotzke & Forster 2015 also used sliding trend analysis and managed to mangle the data sufficiently to conclude that it was not the more sensitive models that deviated the most in the recent lack of warming.
https://climategrog.wordpress.com/cmip5_hi_grp_low_grp/
That despite the fact that longer 60y trend analysis did infact show the data bifurcate into two clearly separated groups at the end.
In that case they hit lucky since the 60y trend takes out the 60 variability and most of the higher frequencies without in verting any periods where there is significant variation in climate.
Their 15y sliding trend just mangles the data and produces the result they expected.
The point is that the pointiness of you 30y sliding trend is an artefact of that filter. Mangling both sets of data is not a good way to suggest the models are wrong.
Marotzke & Forster both have professorships I think so you are in good company. That does not mean it is good practice. Most of what gets published in climatology would not get published in any other field ( apart from sociology that is ).
Greg point us to the posts you made to Hansen for his use of a filter on 6 years of data.
For parity like.
Hmmm. That got me to thinking. I wonder what the humanoids said 130,000 years ago ( http://humanorigins.si.edu/human-characteristics/brains ). Was it the same utterance made 250.000 years ago? Or maybe at 340,000 years ago the echoes of earlier grunting became more shrill? At 430.000 years ago I supposed some were beating branches to the ground and throwing feces at each other. I could go on, but it seems that we still want to say the sky is falling, just in different ways as the human brain has developed. Because I can reasonably surmise that humans, from the moment they crawled out of the trees and stopped dragging knuckles, shook their fist at some entity or another for causing the climate to be less to their liking. Which means whenever I read an alarmist piece, I can’t help but imagine the writer at home beating up his front yard trees and throwing feces whenever a car passes.
http://www.climate.unibe.ch/~stocker/papers/schilt09qsr0.pdf
A sliding trend is not low pass filter , which is probalby what you thought you were doing. It is a repetitive notch filter. So you are taking out 30 , 15 and 7.5 years etc. but inverting any changes between 15 and 30. That is why the result looks all pointy.
https://climategrog.wordpress.com/cmip5_hi_grp_low_grp/
No, Greg. I knew exactly what I was doing. And you’d realize that if you had read the text associated with the illustration you’re complaining about.
The reason it looks pointy, Greg, is that the 30-year warming rates peak at the period ending about 1945, capturing the highest warming rate achieved during the early warming period of the 20th century.
Bob, a linear ramp rate of change is a constant acceleration.
Are you seriously suggesting that there was a near constant *acceleration* in global temperatures which suddenly change direction in 1945 and showed accelerating cooling for the next 30 or so years ?
No , slow down , it just snapped from max rate of warming to max rate of cooling in a year or two? There was then a near constantly accelerating cooling until 1968 when , again , it snapped and accelerated upwards.
Why don’t we see these parabolic acceleration curves when looking at the time series.
No, sorry Bob, you don’t know what you are doing and are not smart enough to learn when errors are pointed out. I don’ t mean to be rude but you should listen to comments and at least check it out for yourself. Nullus in verbim , etc. but that means you need to check it out, not just come back and insist you are right.
Try making some sinewaves of different frequencies in your spreadsheet and looking at what is produced by your sliding trend. See which are attenuated , which get through and whether any flip upside down compared to the original.
An interesting thing I did years ago is to make a sliding trend plot , like you fig 11, for each possible length. Say from 5 years to 60 years in 1y steps and make an animation of the graphs as the length of the trend window increases.
It’s quite weird to see the way it contorts the data as it goes along. It also shows you how all the wiggles and patterns are more a function of length you chose to use than anything else. You quickly go off attributing much meaning to any one graph.
I see that the figures Bob used in his arguments go all the way to eleven.
Well, that’s not ten. You see, most blokes, you know, will be illustrating their arguments by displaying only ten figures. They’re on ten, all the way up, ten figures, ten paragraphs, ten points. Where can you go from there?
What Bob does, since he needs that extra push over the cliff, you know what he does?
He puts the figure count up to eleven. Eleven!
Exactly, one figure more!
Some of my posts have included more than 20 illustrations, Thomas.
Cheers.
Have you got figure rage?
You can get a topical cream for that these days.
The puppet masters can also read a chart and see that the current El Nino is done and the ocean and global temps will fade. It’s part of the half-truth culture and administration.
Ya know what, R-guy? They can’t. They can’t distinguish contrived results from bona fide science. After THIS long of CO2 UP — WARMING STOPPED, one would think the AGW faithful would get a clue. Even their professors have recognized the truth about their failed GCM software engineering:
http://worth1000.s3.amazonaws.com/submissions/20013000/20013212_7195_625x1000.jpg
But, that was behind closed doors.
In public, it’s another story (and another and another and another, lol):
LOL
Image credit (enhanced by “Worth”): Gary Larsen (The Far Side cartoon series)
It is so entertaining figuring out what the new names trolls are adopting. The 2 degrees C has happened (or at least been announced) and it looks more like the Emperor’s New Clothes.
It’s entertaining as long as they don’t adopt your name…
Thanks, Pop. That was funny.
Alarmists are like any other “progressive”, to whom a sense of moral superiority is more important than facts.
I may be preparing to poke the Climate Science hornets nest, but here goes. I come to this site primarily for the comments which are mostly entertaining. The main posts seem to revolve around, “How many Climate Quacks can dance on the head of the Climate pin?” The answer depends on the size of the quacks and the size of the pin.
Articles tend to go into such detail which is the domain of the quacks ignoring the vast expanse of Earth’s Climate history. There is consensus an many points of climate history. Climate has been part of earth’s evolution from the very beginning humans have not. Theories abound as to what the basic cause(s) if the Ice Ages and the cause(s) of their ends, with little actual data. In any event humans were not involved.
What I believe is needed is more practical tools to convert the kids, that have been brainwashed by the Climate Quacks.
Hey, Fly,
You have a good point, we DO need better PR and public education.
However, I must dispute your denigrating Bob’s (and other posters’) presentation of evidence, finely tuned, to make a powerful point. The head of a pin is just the thing to pop the hot-air balloon which is AGW.
Janice
There are two words that negate all that went before . . . but, and however. You make a good point . . . however, I really could care less. Real scientists’ finely tuned presentations are over the heads of the kids (future decision makers) and ignored by the Climate Quacks. Only the already converted appreciate their beauty. It is the point of the pin that pops the balloon! We need tools that the working class parents can use to counter the lies their children are being taught.
Climate Quacks have lost every argument and still they have the keys to the treasury. Stop the dance rescue the future.
It’s the money, there is little in rational science and irrational science has a bottomless well.
The AGW belief clan is a group of pseudo-scientific posers: today engaged in apparently, functional science: building credibility and throwing every name drop and authority worship association tool in the book at the audience.
Tomorrow, claiming the laws of thermodynamics aren’t capable of making their fantastic stories of fake physics, even experimentally proven wrong when instruments are sent to other planets to check their story.
There’s no standard for behavior by AGW believers because it’s a muckraker’s niche: weather scams and fraudulent gas physics so transparently wrong there are only two ways out for it’s promulgators: act insane and sue people who point out their kook stories don’t add up even at first glance.
It’s a circus designed to enthrall not enlighten. It’s definitely one of the darkest days science has seen in many many decades, and it’s all because the people who believe in it, are so media savvy.
Real scientists can’t effectively deal with people simply screaming and insulting their conclusions when those who hijacked science claim they are the face of science, but that currently, the laws and requirements to practice provable science, are suspended.
For them.
Dear Fly,
You need to ask someone you trust and who reads well to help you understand what I wrote. When one acknowledges a point, it stands alone as an affirmation. That affirmation is not necessarilynegated by an immediately following “however, it can also be qualified or embellished upon.
1. You made a good point.
2. I disagree with part of what you said.
That is all.
The pin that pops the balloon is the “tool” — how we explain that to the public is a separate issue.
Again:
1. If there is no pin, there is nothing to tell anyone about.
2. Given that there is, indeed, a pin, I AGREE WITH YOU that we need to do a better job of explaining it to the public.
The End.
Sigh.
Your friend??,
Janice
Toneb,
You’ve been saying so many goofy things it’s unlikely you graduated high school.
Is there any particular job you ever worked in measuring anything for money?
Any particular field you were employed using scientifically certifiable measurement mechanisms where if you did your job wrong you were fired?
The way we real scientists know you are a fake one is you say you believed in all that disjoint, thermodynamic law violating trash.
Real scientists utilize and conform their thought processes to the laws of mathematics and physics.
Fake scientists may have degrees, they may have followers, twitter accounts, actual prizes for doing things that seem like science – but that’s not a scientist.
Being employed in a job where you are allowed to allege to others you are a scientist – that isn’t what makes a scientist.
What makes a scientist is that when a person speaks, he’s not a liar. He doesn’t judge the veracity of something according to whether he works for the government or for a tobacco company, or a hospital or a research group.
Men who craved being seen as scientists while not following the proper scientific protocols for production of actual science are almost as common as real scientists in the professional science businesses. Scientists are needed for any number of fields and not everyone has a degree; however they prosecute science to the letter all their lives and work in scientific realms, in research and policy making at times.
You’ve never been involved in anything like that Toneb, and the way it’s so easy to tell, is that you think climatology is actually a field of science. Climatology is a word made up by people who were trying to separate the grants they applied for, from weather grants.
Climate is weather,
Weather is climate.
You don’t need some particularly unusual experience or training to study the three phases of matter involved in climate. There’s the solid phase earth, there’s the plasma phase sun, there’s the liquid phase green house gas water, and the gas phase general atmospheric mix.
The fact you’re going on about how ”climatology” is some high and mighty art reveals that you’re actually an environmentalist not even a science student.
Ann:
FYI:
I am a retired Meteorologist of 32 yrs with the UKMO.
And I have forgotten more about weather /climate than you have the slightest inkling of (judging by your post).
Toneb writes: “I am a retired Meteorologist of 32 yrs with the UKMO.”
That explains a lot. Thanks, Toneb.
You’re welcome Bob.
LOVE the humor, Bob Tisdale (and excellent, thorough, analysis — thank you for sharing all that HARD WORK, so conscientiously performed).
Found this:
AGW “Scientists” Oblivious to the Natural Variation Polar-Bear-in-the-Room
#(:))
Image credit: Gary Larsen (The Far Side series of cartoons)
If your alarm level is at 10, where can you go from there?
“…and nothing happened.”
Yes, that’s because we’re supposed to look under the OTHER shell to find the pea…
Arn,
Good comment except:
I think you might mean, “practice” science to the letter…? Although I think prosecuting science is a perfect description of what “climate scientists” co.
“climate scientists” co. = “climate scientists” do.
An El Nino is only not proof of global warming if skeptics are using it—you know, like the 1998 El Nino that the skeptics always cherry pick to prove no warming or whatever. If the climate scientists need the El Nino to prove it’s catastrophically warming and we must stop burning all fossil fuels now (Please, energy producers, do this, now, immediately—it’s a great way to show people what the end result will be. Stop burning fossil fuels today and let people burn candles, walk to work, etc.) then its obviously IS proof of global warming. After all, the experts said so and who are we pions to argue with the experts?
Why are we discussing NH temperatures? CO2 is supposedly well mixed, so any difference between NH and SH warming CANNOT be due to CO2. Thus by concentrating on NH temps, Mann and Co are effectively admitting they are not talking about CO2, they are talking about natural variability.
Because that is where the land mass is and the southern hemisphere AT is not playing the “earth is boiling” game
My theory on El Nino is that it has nothing to do with the sun or CO2 but everything to do with the increased volcanic activity we are seeing.
If you look at this image you can see things heating up around the Pacific rim and the main warming is right at the equator. It’s almost as if the earth’s crust is cracking right at the equator and is heating the oceans from underneath not from above.
Look at where the East Pacific Rise is on an ocean floor topographic map and which way it runs geographically. Wrong place, wrong orientation by several thousand km. And a sprinkling of isolated sea mounts are not going to do that. The water surface area alone is a couple of Australia, not to mention volume. Volcanic release is also incompatible with why ocean water is anomalously cooler in the Western Pacific, in parallel. The apparent ocean ‘cooling’ in the Western Pacific is just as significant to this cycle as the heat release in the Eastern Pacific. Plus in La Nina it becomes very obvious colder ocean currents are moving the equatorial surface water layer away from the Americas. This is just sun energy storage and release, ocean currents, and the winds these combined create.
Unmentionable,
You’re probably right, I made this animation to show my theory I’m not sure how accurately they measure volcanic activity at the bottom of the ocean.
http://www.m4gw.com/images/2016/Animation.gif
This is where I got the image for the middle slide. http://earthquakes.volcanodiscovery.com/
2015 was a very active year for volcanoes especial around where the big red area is. Wolf volcano in the Galapagos Islands, Cotopaxi in Ecuador, Villarrica in Chile, Hunga Tonga-Hunga Ha’apai in Tonga, Mount Sinabung in Indonesia, Piton de la Fournaise on Réunion Island, Kilauea on Hawaii, Momotombo in Nicaragua, Colima in Mexico, and Calbuco in Chile.
http://www.theatlantic.com/photo/2015/12/2015-the-year-in-volcanic-activity/420756/
I was reading that we only know about 5% of what there is to know about the oceans. (http://oceanservice.noaa.gov/facts/exploration.html) That said, it would seem we need to put in a bit more time understanding how they (and what’s under that 70% of the planet) affect the climate.
Your theory, Elmer, needs to be supported by data. Do you have a link to any data that will support it? If not, all you’re presenting is conjecture.
Additionally, the coupled ocean-atmosphere processes that drive ENSO are well studied and documented, so you’ve got an uphill battle.
Find the data, and document your theory.
Cheers.
This is the graph you need to show Bob.
The one where you do not lose the recent warming due to using a 30yr running mean.
It is CMIP5 model mean and confidence intervals vs obs including forcings that actually OCCURRED
and not the values that the GCM’s ran with.
Yes, they have to estimate aerosol, TSi etc …………
http://cmip-pcmdi.llnl.gov/cmip5/forcing.html
…Did your mommy let you draw that with crayons ?
He forgot to crayon in the disclaimer where Michael Mann and Phil Jones were talking in 2005 and Phil said ”The scientific community would come down on me in no uncertain terms if I said the world cooled since 1998. Ok it has but it’s only seven years of data and it isn’t statistically significant.”
Using Toneb’s crayolas there also of course wasn’t room for him to include Jones’ Feb 2010 don’t go to jail BBC interview where he admitted there hadn’t been a single tenth warming since 95 (later corrected I think to 1998 iirc) and that in fact it had cooled a little;
and of course there wasn’t any room for the Met Office’s 3 papers they released in 2013 when they named it ”About The Recent Pause in Warming” where they went on about how ”since 1998 temperatures have been relatively flat” and how the three papers they had written about the ”pause in global warming over the past 15 years to 1998” were going to explain to everybody how everything said it was going to warm,
except that it never showed up, so they just claimed it had warmed anyway.
Everyone needs to read ”The Recent Pause In Warming” written three years after Phil Jones was demoted instead of going to jail, when he confessed he had been fabricating warming ever since it stopped, in ’98.
People believe scientists are questioning their religion using 1998 as some particular point scientists are picking.
To the contrary the men claiming to be scientists and had credentials to be scientists, admitted multiple times both between themselves, and to the public media, that they started reporting the temperatures falsely in 1998.
He was certainly telling Michael Mann willingly he knew all warming stopped in 98 and that he’d be damned if he was going to let ”the scientific community” find out.
Toneb should be named BToneDef because he’s marching to the sound of a drumbeat from a movie by Al Gore years ago when people hadn’t checked the stories of the ”smartest men in the world” who had already started falsifying temperatures long before any of their more recent publicity slips happened.
To me, an ‘ensemble mean’ seems like some statistical bunkum to hide the fact that model outputs
are generally unphysical. Having wrong models whose ‘ensemble mean’ *may* be closer to reality
seems more like coincidence to me than a fact to be celebrated. The present uncertainty all the
temperature records we have gives me very little confidence that it’s possible to see anything
significant in the data; certainly not a clear AGW signal.
Pat Frank’s piece on error propagation, and his other work on uncertainty, are good reads.
Whatever it takes, to make it look like we’re still warming.
Toneb says: “The one where you do not lose the recent warming due to using a 30yr running mean.”
Read the title block of the illustration again. It’s not a 30 year running mean.
Bob:
Come, come.
You say here….
https://bobtisdale.wordpress.com/2011/11/19/17-year-and-30-year-trends-in-sea-surface-temperature-anomalies-the-differences-between-observed-and-ipcc-ar4-climate-models/
” Figure 1 is a sample graph of the 360-month (30-year) trends for the observations, and it includes descriptions of a few of the data points. Basically, the first data point represents the linear trend of the Sea Surface Temperature anomalies for the period of January 1900 to December 1929, and the second data point shows the linear trend of the data for the period of February 1900 to January 1930, and so on, until the last data point that covers the most recent 360-month (30-year) period of September 1981 to August 2011.”
So OK a 30 yr trend then.
Same as the graph above.
Which smooths out the 30 yr (360 month) period – so masking the recent rising trend.
Toneb, the recent uptick in surface temperatures is in response to a naturally occurring, sunlight-fueled weather event called El Nino. The reported record highs in surface temperatures in 2015 are a response to the weak 2014/15 El Nino and a naturally occurring phenomenon in the Eastern extratropical North Pacific called The Blob. The Blob was also the primary cause of the reported record highs in 2014. See the links in the post. Are you considering those data-based realities in your assumptions about “the recent rising trend”?
Additionally, as I noted in the text of the post, climate is typically defined as average weather and is often expressed over a term of 30 years. Thus my use of that time period. Why are you making me repeat myself in comments? You’re acting like a troll. Then again, maybe that’s the intent of a retired UKMO metorologist, to present yourself as a troll here at WUWT. You’re not offering anything of value, Toneb. You’re wasting your time and, more importantly to me, you’re wasting mine. Don’t you have something better to do?
Cheers.
Thanks for the illustration and the link, Toneb. But I prefer to show my model-data comparisons of global surface temperature anomalies (1) since 1880, (2) referenced to the full term for anomalies so that the choice of base years doesn’t skew the results (as did the 1980-1999 cherry-picked years for anomalies in graph you linked), (3) using the model mean because the model mean reflects the consensus (see post linked later in this comment), (4) with the data and model outputs smoothed with a 5-year (61-month) running mean filter (commonly used by GISS to minimize the effects of ENSO and volcanic eruptions). Here’s an example of the result:

The graph is from my most recent global temperature update:
https://bobtisdale.wordpress.com/2016/03/12/february-2016-global-surface-landocean-and-lower-troposphere-temperature-anomaly-update/
In the text of this post, I provided a link to a post that discussed the use of the model mean. Here it is again, because you must have overlooked it:
https://bobtisdale.wordpress.com/2013/10/06/on-the-use-of-the-multi-model-mean/
PS, Toneb. A question for you, regarding the illustration you linked. It is well understood that climate models are not simulating climate as it exited in the past, exists now, or might exist in the future on our lovely planet Earth. In other words, there are no similarities between them and the data. What reason then is there to showing the model spread/confidence interval, other than to misrepresent the models, presenting the spread as though it has value?
Toneb: Thank you for confirming your identity at HotWhopper, Tony Banton. Now I understand completely why you’re acting as a troll. You are one.
You’ve wasted enough of my time.
Adios.
Hi Bob,
Your comparison is not really apples-to-apples. The observational indices consist of about 71% SST and 29% land SAT, and for a fair comparison the CMIP5 index should be similar (cf Cowtan et al 2015).
The following chart is apples-to-apples as far as possible:
http://postmyimage.com/img2/741_BESTvs_AllModels.png
The observations (BEST l/o) seem to follow the model mean relatively well, allowing some wiggle room (+/- 0.2 C) for natural variations.
We actually don’t need the updated forcings by Schmidt et al 2014.
2016 will likely be off the chart (0.4-0.5 above 1998?). A similar el Nino spike can only found back in 1878, but the observations were sparse then..
The model mean may not explain the period 1920-1945 very well, but I believe that this warming is spurious (including the WW2 peak) caused by a poor bucket to ship adjustment of SST:s
Btw, Bob. Choosing the base period 1980-1999, like in the chart Toneb is showing, is not cherry-picking. On the contrary, it is negative for for observations vs the models. 1980-1999 was a very warm period in the real world. If the real world is normalised in a warm state vs the modelled worlds, it will likely run cooler than the models in the following period..
Hence, I prefer base periods of 60 years, which normally have a fair balance of ups and downs. See:
http://www.woodfortrees.org/plot/hadcrut4gl/mean:720/plot/hadcrut4gl/mean:240/plot/esrl-co2/scale:0.0062/offset:-1.99
Thanks Bob Tisdale, one of your very best pieces.
TO BE FAIR: this is the first time in years that they have had any sort of vindication on the projected sensitivity of the climate. With the assumption that all big El Ninos are roughly equal (no, seriously…let people have their moment, unjustified though it may be) the peak to peak linear trend extrapolated from this and the previous big El Nino would equate to something like a maximum El Nino month temperature of 3.25C by 2100..which still works out to less than a 3C average anomaly by 2100. But hey…it would be warming that was close to their “most likely” projections. I do not think such a crude extrapolation is warranted, but I can completely understand them saying “see, its in line with it”. Indeed, if there is a step up in temperatures as there has been from past El Ninos, there may well be some overall warming for the first time in years.
good to see on the MET blog that they get a good kicking in the comments section,
http://blog.metoffice.gov.uk/2015/11/25/2015-likely-to-be-the-warmest-on-record/
Thanks you.
But the Climate Change Cultural Revolution has a few more years of noise and policy distortion to run yet. Soon it will be about as relevant as a Mao poster in China today.
The alarmists just cried ‘wolf’ again, because it’s already cooling.
HadSST3 Global:
2015/12 0.717
2016/01 0.732
2016/02 0.604
http://www.metoffice.gov.uk/hadobs/hadsst3/data/HadSST.3.1.1.0/diagnostics/HadSST.3.1.1.0_monthly_globe_ts.txt
http://www.ospo.noaa.gov/data/sst/anomaly/2016/anomnight.3.14.2016.gif
Equatorial Ocean Heat Content is already back to pre-2015 ENSO levels:
2014 12 0.50 0.48 0.54
2015 1 0.28 0.22 0.15
2015 2 0.54 0.65 0.83
2015 3 0.85 1.17 1.52
2015 4 1.05 1.42 1.74
2015 5 1.03 1.42 1.53
2015 6 0.87 1.27 1.51
2015 7 0.92 1.36 1.69
2015 8 0.99 1.43 1.97
2015 9 1.04 1.48 1.80
2015 10 1.04 1.51 1.91
2015 11 0.92 1.41 1.78
2015 12 0.58 1.04 1.20
2016 1 0.44 0.88 1.25
2016 2 -0.03 0.32 0.58
http://www.cpc.ncep.noaa.gov/products/analysis_monitoring/ocean/index/heat_content_index.txt
I expect the alarmist absurdity to continue along with their continued ignorance of the main influence on temps, solar variability. The sun drove temps and OHC up with the SC24 2015 TSI peak last Feb/March, the highest peak since late 2002. From http://lasp.colorado.edu/data/sorce/tsi_data/daily/sorce_tsi_L3_c24h_latest.txt,
Year 1au TSI
2015 1361.4321
2014 1361.3966
2013 1361.3587
2016 1361.3034
2012 1361.2413
2011 1361.0752
2003 1361.0292
2004 1360.9192
2010 1360.8027
2005 1360.7518
2006 1360.6735
2007 1360.5710
2009 1360.5565
2008 1360.5382
It’s not only TSI magnitude either, it’s also the duration of higher vs lower TSI, like pulse-width and amplitude modulation, that lead to higher temperatures. The reason for the Feb temp spike was the 15 straight days of sufficiently high TSI, that ended on Feb 17 – and Feb only had 7 days when TSI wasn’t high enough or declining. March may yet end up “warm” too if TSI doesn’t drop off much from now by month’s end.
I predict 2016 on the whole will be a cooling year because of the expected eventual lower TSI as the year progresses. If there is another TSI spike this year like there was in late 2015, which is entirely possible even if TSI for the year is lower, there will be another temporary uptick in temps – so be prepared for anything.
Withe the alarmists anything is possible even when it starts cooling- they have control of the data and the Media.
“The Outer Limits Intro ”
The Outer Limits Intro
“they have control of the data and the Media.” – yup
I’ve been looking at the CFSR 12-month change in global surface temperature estimates compared to the running 3-month ENSO averages and they overall seem to match fairly well for the big events for both high and low ENSO values. This years increase has lagged the ENSO a bit however. I’m not sure what to make of that. I suspect that some of the current spike in global temperatures in recent months is related to venting of heat into the Arctic, which was not near as noticeable in 1997-98. Possibly the now ended warm anomaly “blob” in the Northeast Pacific may have contributed to that venting as it disipated. Here’s the graph:


I will be updating this graph near the beginning of the month each month here:
https://oz4caster.wordpress.com/enso/
The CFSR Arctic surface temperature anomalies have spiked very high in January and February. The Arctic surface temperature anomalies show little impact from ENSO events in the past, which implies something else going on with the big Arctic spike the last couple of months:
The CFSR Antarctic surface temperature anomalies have continued to decline contrary to CAGW climate models and also show little indication of any impact from ENSO events:
The longer it goes on the more absurd their comments will become. That is what happens when you follow the lie.
Would you like to substantiate that?
When it comes down to it there are 3 options….
1. The world’s experts in their field of meteorology/climatology/oceanography/biology and many more “ologies” are incompetent.
2. The above are in a conspiracy to scam the world in order to (whatever).
3. They know more than you.
If the common sense answer does not scan … then I venture to suggest that the problem lies with you.
I’m curious…how many times in your career as a meteorologist did you revise weather observations from the past? How about the distant past?
When people of various “ologies” said a temperature reading in 1945 was 14.0 degrees C, and then people of various “ologies” throughout the years change this reading to 14.2, 14.3,14.5, etc, surely something is/was amiss, right? It’s not like reading a thermometer is rocket science. Why do all of these “ologies” keep coming-up with answers different from the “ologies” of the past? And sometimes the people of “ologies” who come up with the new numbers are the same ones that came up with the old versions!
Also, with your long career as a meteorologist, do you not have any issues with CMIP5 using the hydrostatic approximation? You presented a CMIP5-based chart, after all.
Oh, and Bob.
You said this……
“That is, as noted earlier, the 1997/98 was a stronger East Pacific El Niño than the one taking place in 2015.”
Here…..
http://wattsupwiththat.com/2016/01/12/january-2016-enso-update-it-appears-the-el-nino-has-peaked/
Yet we still get a ave Global temperature record.
Now why is that?
Were you wrong in that post?
Or is the ENSO cycle merely riding on the back of the background AGW one?
Toneb says, “Yet we still get a ave Global temperature record.”
Please clarify what that means. Also, have you read this post or did you just look at the pictures? If you had read this post, you would have noted the discussion of the uncertainties of the data in these short-term comparisons.
Toneb says, “Were you wrong in that post?”
No, I’m not wrong. The NINO region data indicate the 1997/98 El Nino was a strong East Pacific El Nino while the 2015/16 El Nino was a strong Central Pacific El Nino.
Toneb says, “Or is the ENSO cycle merely riding on the back of the background AGW one?”
You’ve just illustrated your ability to jump to a conclusion without understanding the subject matter.
You’ve got cause and effect reversed, Toneb. If you had read and understood the post I linked within the text above, you might have realized that. Here’s the link again.
https://bobtisdale.wordpress.com/2013/06/04/open-letter-to-the-royal-meteorological-society-regarding-dr-trenberths-article-has-global-warming-stalled/
I provide hyperlinks so that I don’t have to repeat myself.
Bob:
Come, come.
You say here….
https://bobtisdale.wordpress.com/2011/11/19/17-year-and-30-year-trends-in-sea-surface-temperature-anomalies-the-differences-between-observed-and-ipcc-ar4-climate-models/
” Figure 1 is a sample graph of the 360-month (30-year) trends for the observations, and it includes descriptions of a few of the data points. Basically, the first data point represents the linear trend of the Sea Surface Temperature anomalies for the period of January 1900 to December 1929, and the second data point shows the linear trend of the data for the period of February 1900 to January 1930, and so on, until the last data point that covers the most recent 360-month (30-year) period of September 1981 to August 2011.”
So OK a 30 yr (running) trend.
Same as the graph above then.
Which smooths out a 30 yr (360 mon) period – so masking the recent rising trend.
Also:
“Nor is there anything unusual in the most recent 13-month change in global surface temperatures, according to the GISS data. See Figure 6. In fact, the “annual” changes in response to the weak 1994/95 El Niño and the strong 1997/98 El Niño surpassed the change so far to this El Niño.”
Nothing unusual?
Then you cannot (if you are – as it is a theme of this website) say that an EN is a the primary driver of warming.
And your graph honestly shows the latest play in the data?
“Toneb says, “Yet we still get a ave Global temperature record.”
Please clarify what that means.”
It means the world’s average temp is at a record high (for the instrumental period – obviously).
YET the headline for your piece is….
“Alarmism Cranked Up to Absurd Level”
So on the one hand you try to play down the extreme of this EN and on the other (despite it adding to said record global ave temp) you intimate via that headline …. well, what I would expect here.
Isn’t it that the climate system (atmosphere – which is, as we know? only around 3% of the total) after a long period of a -PDO/ENSO cycle has woken up and renewed it’s long term warming trend?
Tony Banton from HotWhopper: Thank you for your continued trolling. You’re now repeating yourself after I’ve responded to the same comment, which is irritating. That type of trollish behavior is what got your friend Miriam O’Brien (a.k.a. Sou of HotWhopper) banished from WUWT. As I noted above, you’ve wasted your time here. You’re parroting dogma, and trying to spin what I’ve written in this post, in other posts and in the comments on this thread. Such is the behavior of a troll.
Maybe you should go back to HotWhopper. Miriam O’Brien’s response to this post is one of her most ridiculous ones to date. You fit in well there. I see you haven’t bothered to advise her of her most blatant blunder. Thanks for that.
Feel free to continue to waste your time here. But don’t expect me to reply. I’ve already wasted enough of my time with you on this thread.
Adios.
Explain your personal understanding of the use of fire making the sky get hot. Humanity has been using ever more energy for a hundred years and the temperature of the troposphere remains quite steady in face of prodigious increase in the gases pertinent to your religion.
There is no Athropogenic warming. You can not make the sky hot using fire. That’s all there is to it, and if you could,
then the entire infrared and optical astronomy fields globally would have been screaming about it for years. There’s not even a peep from them because to the people who measure the atmosphere’s heating through the most minuted interactions: amplified light striking magnification lenses –
there’s nothing worth mentioning.
So that leaves you and Michael Mann, who swore in court he had won a Nobel Prize, and James Homer Simpson Hansen,
still jumping up and down swearing there’s a runaway green house effect on Venus, and that Homer Hansen was having to get to work in a rowboat toward the end of his career.
“There is no Athropogenic warming. You can not make the sky hot using fire. That’s all there is to it, and if you could,”
If you say so Kenny:
“So that leaves you and Michael Mann, who swore in court he had won a Nobel Prize, and James Homer Simpson Hansen”
Try looking at the IPCC list of contributing scientists my friend.
Oh, and you may wish to widen your internet reading habit somewhat (or not).
“… entire infrared and optical astronomy fields globally would have been screaming about it for years. There’s not even a peep from them because to the people who measure the atmosphere’s heating through the most minuted interactions: amplified light striking magnification lenses – there’s nothing worth mentioning. …”
A curious mind would find that meaningful. What happened toneB? Get a blinking cursor in the internal auto-cue? Full Blue-Screen? Get fig-leaves on that mate, a bit too embarrassing to have one’s religion do a “this does not compute” routine, kack its pants, then fall over with dissonance seizures.
“A curious mind would find that meaningful. What happened toneB? Get a blinking cursor in the internal auto-cue? Full Blue-Screen? Get fig-leaves on that mate, a bit too embarrassing to have one’s religion do a “this does not compute” routine, kack its pants, then fall over with dissonance seizures.”
No, a curious mind would have searched out science and come on here and written a reasoned and intelligle piece with links to studies backing up his case.
Oh, and “religion” requires no evidence ….. that would be like Lance and you (?) then.
Here’mine (for starters)….
http://phys.org/news/2015-02-carbon-dioxide-greenhouse-effect.html
I won’t bother posting the essentially flat line graph of global T, from Dec 1998 to Jan 2016.

“… They found that CO2 was responsible for … about two-tenths of a Watt per square meter per decade. …”
0.2 watts / m2 … error?
No, not of the instrument error, which the article tries to distract with and impute great precision in measurement for the claim due to the instrument, but of the actual measurement?
“… “We measured radiation in the form of infrared energy. Then we controlled for other factors that would impact our measurements, such as a weather system moving through the area,” says Feldman. …”
Ah … so they compensated for weather. So not all that precise after all.
Well OK, though this is in no way new we’ve known this from palaeo CO2 data lagging Global T rise, and that CO2 is also a SECONDARY forcer in its own right.
The question is, what PRIMARY mechanism is it lagging, which does the actual defrosting here?
And why are people insisting the current rise is especially different to others? Is it actually?
Well note that the peak in Feb 2016’s T transient coincides with a spike in global atmospheric water content that parallels SST:
In other words, this all time record was clearly the work of H2O’s greenhouse effect, and not CO2’s!
Do you acknowledge that fact?
Not a CO2 forcing.
Just dodging it and asserting CO2 forcing is making such a huge difference to atmospheric energy, when the El Nino is powered by stored liquid H20 energy, releasing gas-phase H20, and that’s what delivered the thermal greenhouse pulse that was recorded last month.
And will you try to deny that as global atmospheric water content drops back that the global thermal forcing will fall with it?
Or are we going to just pretend CO2 forcing drove the transient, instead?
But let’s go back a bit, do you really have no reply to this, as it’s a significant fact:
“… entire infrared and optical astronomy fields globally would have been screaming about it for years. There’s not even a peep from them because to the people who measure the atmosphere’s heating through the most minuted interactions: amplified light striking magnification lenses – there’s nothing worth mentioning. …”
A curious mind is, well … curious for an actual reply.
Some further bed time commentary replies to your link topic.
http://wattsupwiththat.com/2015/02/25/almost-30-years-after-hansens-1988-alarm-on-global-warming-a-claim-of-confirmation-on-co2-forcing/
..Oh boy !! More crayon drawings of imaginary forcings…..
The louder they yowl, the harder they’ll fall.
I was just reading one expert whom I respect, said the “pause is officially over” – due to loss of Antarctica ice. The problem I have with that is that they’re just finishing up their Summer – and it’s rather to be expected. And since they had an abundance of it (it had been growing), it’s hardly cause for alarm. The article also talked about less reflection and more absorption – but I don’t see how that’s something to be concerned about since the sun will not be a factor soon – they are heading into winter. All this focus on CO2 seems to make people forget the seasonal differences.
Bob Tisdale — I am sorry to say that all your articles are using adjusted global temperature data series. What purpose it seve? It may be worth to show the unadjusted data analysis. You know very well that the number of stations changing drastically after 1990.
Dr. S. Jeevananda Reddy
Bob,
With all due respect, I must disagree this heat spike in the NH plots is due to El Nino.
1) The temperatures in the tropical Pacific are modest at best and have been there for many months…why the sudden spike now?
2) Dr. Roy Spencer showed where the heat is – there was a broad warm temperature anomaly that stretched from the east Mediterranean up through west Russia to the Arctic (Blocking High?) I’d really like to see some convincing evidence that that specific feature was a direct result of the modest equatorial warming in the Pacific.
http://www.drroyspencer.com/2016/03/uah-v6-global-temperature-update-for-feb-2016-0-83-deg-c-new-record/
Jeff
JKrob, this is a discussion of surface temperature data, not lower troposphere data.
I find all the gyrations in response to minor squiggles pretty silly.
Agreed, Jeff. Thus this post.
seth March 16, 2016 at 5:30 am
“Being merely halfway to the 2°C limit is not comforting me.”
It seems the Minoans got on OK with warmer weather [2°C warmer than today] ……until they were sorted out by a volcanic eruption and tsunami.
http://events.uwa.edu.au/event/20160311T030251Z-1680-17331@events.uwa.edu.au/whatson/publicaffairs
GregK wrote: It seems the Minoans got on OK with warmer weather [2°C warmer than today] ……until they were sorted out by a volcanic eruption and tsunami.
Regional climate change has a much smaller effect on weather systems, sea level rise, and global biodiversity than global climate change.
Re Tamino’s latest residual, Figure 4 in post, reproduced here: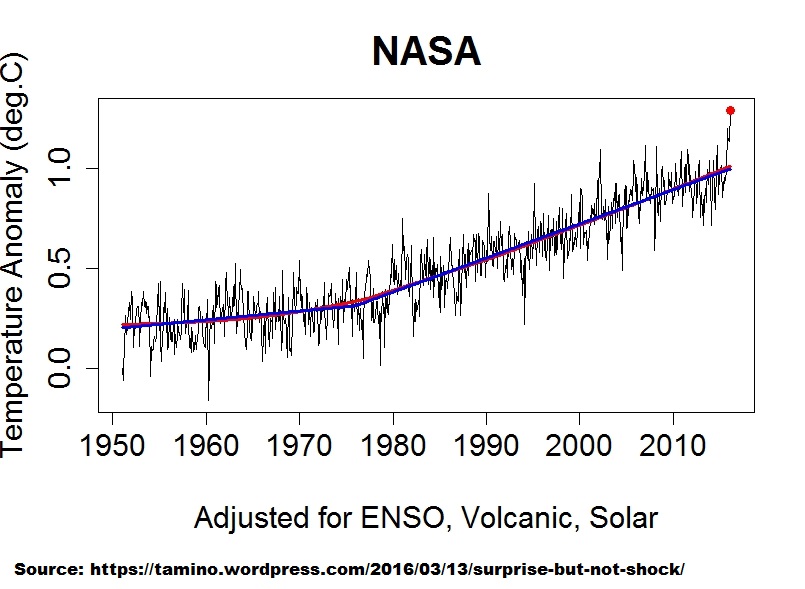
Grant Foster’s “adjusted” GISTEMP LOTI, March 2016 version
Oddly, the 2015/16 El Nino spike remains in entirety. As Bob puts it:
What is amusing is that, irrespective of the imposed trend curve (basically just 2 linear trends – look closely), the 21st century ‘hiatus’ is clearly evident from the mid-2000s onwards. All Tamino’s “adjustment” does is move the pause along in time. This would be even more clear if Foster had actually removed the 2015/16 uptick. In other words, his trend line is missing a 3rd linear trend from about 2005 onward.
Clearly, from 2010 onwards, the bulk of the data is BELOW Foster’s linear trendline.
2010 is significant here because 2010 was where the Foster & Rahmstorf (2011) residual passed through observations i.e. they “removed” very little of that spike too so the chances of Foster removing the 2015/16 spike were always going to be slim.
Foster and Rahmstorf (2011)
http://iopscience.iop.org/article/10.1088/1748-9326/6/4/044022/meta;jsessionid=EBB7865D97EA3ED94514592C4F888189.c5.iopscience.cld.iop.org
Figure 4. Adjusted data sets for all five sources, after removing the estimated influence of el Niño, volcanic eruptions and solar variations.
http://iopscience.iop.org/1748-9326/6/4/044022/downloadFigure/figure/erl408263f4
Obviously, Foster’s NEW “model” is different to the OLD F&R2011 residual in respect to GISTEMP. Note how the 2010 El Nino spike is prominent (warmest) in the OLD residual (GISTEMP, blue line) but is not a standout feature of the NEW “model”.
Even by publication date of F&R2011 it was obvious that Foster would need a NEW model because addition of the then neutral data would make his residual look silly i.e. the neutral data was flatlining and the pause/hiatus was back – embarrassing. Even a massive spike as did occur was not going to help, no, a NEW “model” was required.
So now Foster & Rahmstorf (2011) is thrown under a bus by Grant Foster himself, no less. Not much courage in his convictions.
Advanced signal analysis is rather more revealing than Foster’s inept (and therefore non-contiguous) efforts.
For example:
‘Application of the Singular Spectrum Analysis Technique to Study the Recent Hiatus on the Global Surface Temperature Record’. Diego Macias , Adolf Stips , Elisa Garcia-Gorriz. Published: September 10, 2014
DOI: 10.1371/journal.pone.0107222
Provides this:
Analysis of Global Temperature Anomalies
Compare the residual (red line, secular trend ST) to Foster’s (latest) residual above. The red Macias et al residual exhibited a negative inflexion in the 21st century that confounded the authors. Additional data, even with the 2015/16 spike, would serve to make the inflexion more pronounced i.e. the trajectory of the data is not linear as per Foster’s residual. I expect the residual to peak in the early 2020s. That means, after subtraction of the oscillatory component (MDV green line, Macias et al) from the secular trend (ST red line), continued flatlining of the reconstructed signal (ST + MDV) or close to it until the ST peak is passed i.e. flatish GMST until the early 2020s. Foster is ignorant of the oscillatory component, MDV, which will bite him from MDV-neutral 2015 onwards because MDV is in negative phase now. His residual only begins at 1950, how would he ever know?. The MDV-neutral spline in GMST is nominally (see Macias et al), in 30 year phases of the 60 year climate cycle:
MDV-neutral spline in GMST: 1865 – 1895 – 1925 – 1955 – 1985 – 2015 – 2045
It is this MDV-neutral ENSO-neutral spline that should ONLY be compared to the model mean because the models are MDV-neutral and ENSO-neutral too i.e. this is the ONLY valid apples-to-apples models-obs comparison. The model mean conforms to this spline up to 1955, after which it shoots off too warm (ignore retrospective and temporary volcanism in the model mean – why do they bother?). The IPCC admits 111 out of 114 CMIP5 simulations do not model the 21st century GMST profile. It is even worse when a valid comparison is made of the model mean to the MDV-neutral spline above.
I think it is safe to say, given solar change this century, the 2045 MDV-neutral data will be well below 2015 level.
Foster, in his ignorance, will be out of options around 2020. His blind belief that the data trajectory is his linear residual will be undone in the intervening time. Firstly by a return to ENSO-neutral conditions after the El Nino. Secondly by a very probable La Nina. Thirdly by a return to neutral after a La Nina. Fourthly by negative MDV. All of which will be BELOW his residual trendline, as was the post-2010 data BELOW his F&R2011 residual trajectory.
Foster dug himself into hole. Now he’s tying himself in knots. Schadenfreude is fun.
Grant Foster is fixated on his linear “upward” trend. It’s weird. A linear trend only represents data that is essentially linear but even he admits (below) that the GISTEMP series fluctuates.
His linear trends are externally imposed (on incomplete “data” in his adjusted series) i.e. it is extrinsic and subjective – an analyst’s assumption. A polynomial curve is also extrinsic but would represent the (raw) data better the a linear trend, and his “adjusted” series better too – but still an assumption. Signal analysis on the other hand extracts the intrinsic signals i.e. inherent internal intrinsic without analyst imposition.
Here’s Foster again at Skeptical Science in respect to GISTEMP (not his “adjusted” GISTEMP note). This time he’s truncated the series to begin 1970 (again, GISTEMP begins 1880 Grant):
If Grant Foster expects the data trajectory to continue along his red linear “trend” he’s in for a rude wake-up. Just as the data did not follow his F&R2011 “adjusted” trend post 2010, neither will post Feb 2016 GISTEMP data follow his “trend” because he has not identified the signals in the data. He hasn’t learned or progressed from F&R2011 which was cited in AR5 Detection and Attribution (i think the chapter was) i.e. he fooled himself and the IPCC.
It will be fun to track the data: El Nino back to neutral, La Nina, La Nina back to neutral, over the next few years to 2020 against Foster’s “trend”, especially given the onset of SST cooling upthread. He was wrong in 2011 and he’ll be wrong again.
I predict the post 2016 El Nino data will be BELOW Grant Foster’s “trend” out to 2020 in GISTEMP. Foster will probably still be imposing new linear “upward” trends (but slope inexorably reducing) because it’s what his belief dictates irrespective of signals and his failure to detect an inflexion in the critical signal.
Here’s a side-by-side of Tamino’s models (red curves) for the 1997/98 El Nino and the 2015/16 El Nino. I simply copied the 1997/98 blip and pasted it next to the 2015/16 blip.

As I wrote in the post:
Maybe Tamino forgot to apply his “more complex model of the el Niño effect, one which matches the 1998 outburst” to the comparably sized 2015/16 El Niño…
Of course his followers overlook his games.
Of course Tamino can’t regress away the present el Nino peak, simply because it is stronger than expected from MEI. 1997/1998 was stronger in MEI than now. Thus, there is something extra at work now, AGW, or…
Another way to deal with the issue is to look at the peak to peak trend. According to Gistemp loti the present Winter was 0.51 C warmer than 1997-1998, which corresponds to a trend of 0.28 C/ decade.
According to KNMI climate explorer the CMIP5 rcp 8.5 all- model trend for Global tas (2m) is 0.24 C/ decade for 1998-2016. However, a more fair comparison with observational indices is 71% tos (SST) + 29% land tas (2 m), which reduces the trend to 0.21 C/decade.
Hence, the present observed peak to peak increase is stronger than expected from the CMIP5:s.
The other way around, as estimated from the models, the present el Nino should peak 0.38 C higher than 1997/1998 in mixed indices, or 0.43 C in global 2m indices.. I would be interesting to compare when the whole el Nino Year is in.. ( I suggest the period September through August)
Re “Alarmism Cranked Up to Absurd Level”
Yes, following all this with interest at Richard Treadgold’s Climate Conversation Group here:
‘Hottest year ever was 2015 – But only in Ethiopia, Vietnam, Brazil …’
http://www.climateconversation.wordshine.co.nz/2016/01/hottest-year-ever-was-2015/comment-page-1/#comment-1446558
And,
‘Met Office shock forecast: warming to continue’
http://www.climateconversation.wordshine.co.nz/2016/02/met-office-shock-forecast-warming-to-continue/comment-page-1/#comment-1446559
An example in ‘Hottest year ever was 2015’ of Alarmism Cranked Up to Absurd Levels that Bob missed is this article featured in a number of news outlets (see link and downthread for sources):
This particular kind of climate emergency being inapplicable here in the Southern Hemisphere but I’m sure y’all in the Northern Hemisphere are suitably alarmed. It must be stressful.
That was posted by Peter Hannam here in Australia at the Sydney Morning Herald, with all the usual alarm and doom predictions. Also, just today, the ABC reported that Fox and Franz Joseph glaciers are shrinking so fast that only 80,000 tourists will be allowed to land and walk on them per year.
And that is amusing? Why?
There’s something you’re forgetting.
Citation in a paper is often done when correcting the previous author’s error laden waste disguised as work – like Hansen and Jones’ years of admitted falsification of official records, which they disguised as work.
If someone’s paper is cited a large number of times and they’re involved in controversial pseudo-scientific claims of
coming to work in a row boat,
and
entire regions’ heating supplies being like death trains to Auschwitz,
a large number of cites regarding them will be people CORRECTING their worthless, faulty work.
Phil Jones and James Hansen – both of whose intellectual reputations are on par with the people who created Piltdown Man – many, many of the cites regarding them are probably corrections of their kook tard ways.
You’re so naive you’ve got to be some kind of political student, or natural authority worshipper like ToneLoc.
Completely out of touch with what it means, when the state of instrumentation worldwide never utters a single word about their own instrumentation recording the warming
your leaders admitted they falsified starting in 1998.
Never a word from a single independent atmospheric sensing field.
Not one
Not ever
yet you’re both in here falling over yourselves to attach yourselves – to notoriously busted, and confessed, falsifiers of official, global records, for ten plus long years.
It sounds like someone trained you at D.A.R.E. camp to call the police on your parents, to get a ”science trophy.” A.k.a. ”a D.A.R.E. sticker.”
Nothing you say resembles anything a person of honest scientific demeanor would utter.
You’re untroubled by admitted falsification of records.
You’re untroubled by some quack saying he would be going to work in a rowboat
You’re untroubled by the same quack claiming heating supplies are death trains
You’re untroubled by any of this and the fact no other independent instrumentation field,
like say aerospace and aeronautic traffic, military, research, instrumentation,
or any of the earth based astronomy fields whose main hindrance is extreme sensitivity to rising levels of earth-frequency infrared heating of night time atmospheric air.
Those alone rule you out – as well as ruling out ToneLoc – as actual, honest readers with scientifically oriented thought processes.
So you might think you’re troubling someone by showing up praying to admitted falsifiers of data for more than a dozen years,
but the only thing you’re doing is reminding us that some people can’t be told the truth by the entire face of the earth verifying their own cult leaders’ admission that – it hadn’t been warming, they simply falsified it because if they ”said the world cooled since 1998 the scientific community would come down on them in no uncertain term.”
Oh that’s right the scientific community would come down on them because they were in the act of discussing: they’d been falsifying records for seven years by 2005.
I can’t find an email for Bob Tisdale, so I hope it will be OK just to post my comments here:
Dear Mr. Tisdale:
I’ve been reading your 2015 Ebook, “On Global Warming and the Illusion of Control — Part 1″.
Circa p. 50, I find: ” . . . the human impacts of global warming is so firmly fixed in place that it is nearly impossible to publish papers that challenge it. Scientists who question the dogma are likely to lose government funding and/or their jobs.”
Hmmm. If you get tired of global warming and still want to be cast out by publication-ruling “experts”, you might consider trying biological effects of microwaves. You can find all the controversy anyone could want in the first six pages of my “Biological Effects of Microwaves: Thermal and Nonthermal Mechanisms”, available online at http://www.scribd.com/doc/45663757/Biological-Effects-of-Microwaves-Thermal-and-Nonthermal-Mechanisms .
——————————————————————-
My own contribution to the global warming problem is online at
http://www.scribd.com/doc/36483927/Entropy-shows-that-global-warming-should-cause-increased-variability-in-the-weather . It’s actually less technical than the title would imply:
Abstract
Elementary physical reasoning seems to leave it inevitable that global warming would increase the variability of the weather. The first two terms in an approximation to the global entropy may be used to show that global warming has increased the free energy available to drive the weather, and that the variance of the weather is expected to have increased correspondingly.
“Abstract
Elementary physical reasoning seems to leave it inevitable that global warming would increase the variability of the weather. The first two terms in an approximation to the global entropy may be used to show that global warming has increased the free energy available to drive the weather, and that the variance of the weather is expected to have increased correspondingly”
I don’t follow. I would have thought that temperature and pressure differences drive weather variability. Less ‘extreme’ weather events during the cold peak of a glacial?
Occasional spike and the longer term average ?
http://www.vukcevic.talktalk.net/GISS-NOAA.gif
vukcevic, you illustrate what I was getting at upthread perfectly with that graph of 5 yr average.
Grant Foster (see upthread) thinks the data is on a linear “upward” trajectory from 1970. That NOAA 5 year average detects the 21st century inflexion that Foster misses entirely.
The inflexion is not nearly as pronounced in GISTEMP 5 yr average with only the warming half of the 2015/16 data in so far:
http://woodfortrees.org/graph/gistemp/from:1970/mean:60
But another 2 – 3 years of data will be a different profile in the 21st century part of the series. The 5 yr average neutralizes the ENSO activity. The trajectory will still be upwards (maybe) but nothing like what Foster thinks.
GISTEMP LOTI (offset -0.2) vs HadSST3 NH vs HadSST3 SH
From 1990, 5 yr mean, trends from 1995
http://woodfortrees.org/plot/hadsst3nh/mean:60/from:1990/plot/hadsst3sh/mean:60/from:1990/plot/hadsst3nh/from:1995/mean:60/trend/plot/hadsst3sh/from:1995/mean:60/trend/plot/gistemp/from:1990/mean:60/offset:-0.2/plot/gistemp/from:1995/mean:60/trend/offset:-0.2
Huge divergence in NH SST from 2000 onwards but SH essentially flat. And GISTEMP LOTI is basically just tracking NH SST.
The illusion of 21st century “global” warming is complete.
Add HadCRUT4 and HadSST3 global means to the above graph and it becomes perfectly obvious that GMST is skewed by NH Land:
http://woodfortrees.org/plot/hadsst3nh/mean:60/from:1990/plot/hadsst3sh/mean:60/from:1990/plot/hadsst3nh/from:1995/mean:60/trend/plot/hadsst3sh/from:1995/mean:60/trend/plot/gistemp/from:1990/mean:60/offset:-0.2/plot/gistemp/from:1995/mean:60/trend/offset:-0.2/plot/hadcrut4gl/from:1990/mean:60/offset:-0.07/plot/hadsst3gl/from:1990/mean:60
Fig 11:
The fact that global warming over 30-year periods, according to the GISS data, has not accelerated for more than 2-decades is a problem for the modelers.
There’s a problem period matching in this point. 20 years is less than 30. And the disparity is of an even shorter time-frame. You also don’t include the spread of forecasts. There is disparity between mean model estimates and obs, but this presentation oversells it. It’s as illegitimate, to my mind, as mapping Feb temps onto the model mean, and pointing out that it is above the mean forecast. This argument relies too heavily on short-term disparity (about 17 years) for a reference period of 30 years. It would have been better to centre the 30-year trends rather than trail them. Unfortunately, the results would not be as dramatic. Thumbs up, though, for using a reasonable time-scale (tri-decadal).
Barry, first, what you quoted has nothing to do with the recent disparity that seems to be the topic of your comment.
Second, you know as well as I do that centering the 30-year trends would only shift both curves forward in time–and not change their relationship.
Third, regarding the model spread, none of the models are simulating Earth’s climate as it exists, so a spread has no value, simply a collection of wrong models. The model mean presents the consensus of blatantly wrong models for how climate should respond to the forcings.
Fourth, regarding the short-term disparity, I noted in the post that sometime in the future people might start to realize…
Fifth, you’re welcome for the reasonable timescale. Curiously, other true-blue believers in the hypothesis of human-induced global warming on the thread above have been criticizing me because it doesn’t show the recent El Nino-related uptick. Go figure.