Guest Post by Willis Eschenbach
As a confirmed data junkie, I’m fond of hourly data. The interesting processes in the climate system unfold on the scale of minutes and hours, not years. So I picked up a project I’d started a while ago, but as is too often the case I’d gotten sidetractored by … oooh, shiny … and I’d forgotten about it until I stumbled across my code again.
This project was looking at the hourly averages of various meteorological variables measured at the observatory on Mauna Loa, Hawaii. This is the same place that the CO2 data has been measured since 1959. The data is available here.
To start with, here is the daily temperature at three different altitudes—2 metres, 10 metres, and 35 metres.
 Figure 1. Daily cycle of average temperatures at three different altitudes above the ground.
There were some interesting parts of this to me. One is that the surface temperature peaks at about 1 PM … but as you go up in altitude, the peak occurs earlier. Hmmm …
Also, I was surprised that ten metres up in the air the daily variation is less than half of that down at two metres.
Because the atmosphere is heated from the bottom, it is unstable during the day, and overturns. During the night, on the other hand, the atmosphere is coolest at the bottom, so it stabilizes and stratifies. You can see the timing of the onset and the end of the daytime period of turbulence, which starts just before nine am, and lasts until just after dark.
Next, here is the average precipitation rate hour by hour:
 Figure 2. Daily cycle of average precipitation rates, millimetres per hour.
Here, we see the typical sequence of weather around a tropical island. The big peak in thunderstorms occurs in the afternoon around three or four o’clock. You also get a much smaller number of early morning thunderstorms.
Next, I looked at the winds:
 Figure 3. Daily cycle of average wind speed, metres per second.
This shows something interesting. The “terminator”, in addition to being a series of increasingly bad movies, is the name for the line between light and dark on the surface of the planet. On one side of the terminator, the light heats the air near the surface. This makes the air rise on the lighted side of the terminator. The existence of warm lighter air on the lighted side, plus cool heavier air on the dark side, leads to the “terminator wind”. This is a wind created by the temperature difference across the terminator.
This plot shows the difference between the dawn terminator wind and the dusk terminator wind. The terminator wind always blows from dark to light, which means it always blows toward the sun. Now, the trade winds in the tropics always come from the east and blow towards the west. So at dawn, the terminator wind opposes the trade winds, because it is blowing out of the darkness in the west towards the sun rising in the east. This leads to the drop in wind speed after dawn that you can see in Figure 3.
But at dusk, the terminator wind blows in the same direction as the trade winds, and this increases the average wind speed after the end of the day. Can’t say I understand the rest of the variation, though. I do note that the wind picking up and dying down occurs at the same time as the onset and dying out of the daytime overturning.
(Curiously, I found out about terminator winds by spending lots of time at sea. The sweetest terminator wind is on a dead calm night, not a breath of air … and then the moon rises, and if you are lucky, you can feel the moon wind sweep across the ocean, always blowing towards the moon … but I digress.)
I next looked at the absolute humidity. This one was a surprise.
 Figure 4. Daily cycle of absolute humidity, in grams per cubic metre.
The reason that this was a surprise to me was that I had not expected it to vary that much. From a low of two grams per cubic metre at dawn, it more than doubles when it rises to a peak of five grams per cubic metre at three pm. Why is this important?
Water is the dominant greenhouse gas. Because it is an “L-shaped” molecule, water vapor has many ways to absorb radiation. The molecule can flex and twist and stretch in various combinations, so it absorbs thermal radiation (longwave infrared) of a wide variety of frequencies. The important point is this:
The change in the amount of longwave infrared absorbed by atmospheric water vapor is approximately proportional to the log of the change in the amount of water vapor.
And the amount of water vapor in the air varies during the day by a factor of about two and a half to one … I’d never realized how much greater the afternoon longwave absorption is compared to the absorption at dawn. Who knew? Well, I’m sure some folks knew, but I didn’t.
So I fell to considering the effect of this daily variation. The increase in atmospheric absorption will warm the afternoons, and decreased absorption will cool the early mornings as compared to the average. Now, one corollary of Murphy’s Law can be stated as:
Nature always sides with the hidden flaw.
In terms of the climate system, the poorly-named “greenhouse effect” works to increase the surface temperature. Murphy’s Law means that all related emergent, parasitic, and other losses in response to that surface warming will tend to oppose this effect. In other words, we expect the natural response to elevated surface temperature to be one of cooling of the surface.
For one example among many, when the desert surface gets hot, “dust devils” emerge out of nowhere to cool the surface by means of increased evaporation and convection. They pipe the warm surface air aloft, increasing surface heat loss. But there are no “anti-dust-devils” that act to decrease surface heat loss … Murphy’s Law in action.
Now, the radiative loss varies as the fourth power of the temperature. This means that if the temperature varies around some average value, the radiative losses will be larger than if the temperature were steady. As a result, since the variation in absolute humidity warms the afternoons and cools the early mornings, to that extent it will increase the overall surface radiative losses … Murphy at work again.
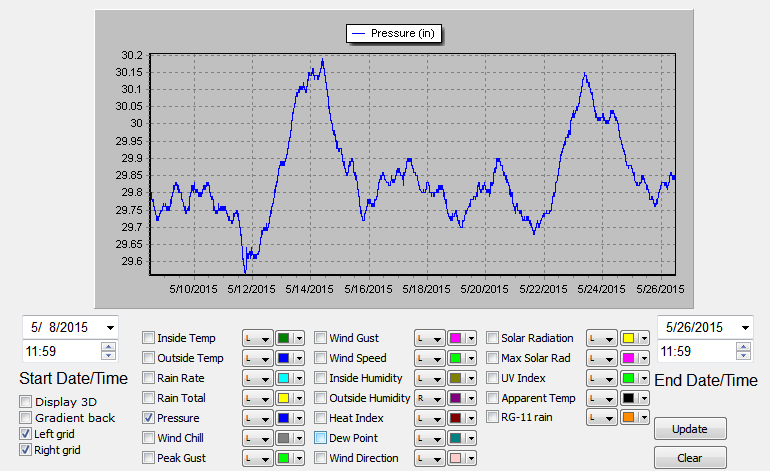
Anyhow, we’ve now finally gotten to my reason for writing this post. The figure below shows one more meteorological variable measured at Mauna Loa—the daily cycle in air pressures.
 Figure 5. Daily cycle of atmospheric pressure, hectopascals. Note that because of the high altitude of the observatory, the pressure is much lower than the ~1000 hPa pressure at sea level.
I was, and I remain, puzzled by this variation. Why should the pressure peak at both eleven o’clock in the morning and eleven at night, and be at its lowest just before both sunrise and sunset? And why would the two peaks and the two valleys be about the same amplitude? That question is why I’m publishing this post.
All contributions gratefully accepted …
w.
Further Info: The procedure used for the Mauna Loa CO2 measurements is here. For those who think Mauna Loa is a bad choice for CO2 measurements because it is an active volcano, give it a read.
My Usual Request: If you disagree with me or anyone, please quote the exact words you disagree with. I can defend my own words. I cannot defend someone’s interpretation of my words.
My Other Request: If you think that e.g. I’m using the wrong method on the wrong dataset, please educate me and others by demonstrating the proper use of the right method on the right dataset. Simply claiming I’m wrong doesn’t advance the discussion.
How about looking at daily CO2 levels at Mauna Loa? CO2 levels can change 18% in just a couple of hours, something I call “The Photosynthesis Effect”.
http://m4gw.com/29-nothing-would-be-green-without-co2/1141-the-photosynthesis-effect
http://m4gw.com/images/2013/03/The-Photosynthesis-Effect.jpg
elmer,
Here the raw hourly data of Mauna Loa and the South Pole, together with the “cleaned” daily and monthly averages for 2008:
http://www.ferdinand-engelbeen.be/klimaat/klim_img/co2_mlo_spo_raw_select_2008.jpg
Mauna Loa has positive outliers if the wind blows downslope from the volcanic vents and negative outliers when there are upwind conditions (mostly in late afternoon), which is slightly depleted by plants in the valley…
The South Pole has no volcanoes or vegetation in the very wide neighborhood, but has more mechanical problems in the harsh environment…
Source of the hourly, etc. data: the NOAA carbon tracker:
http://www.esrl.noaa.gov/gmd/dv/iadv/
Thanks, in Hawaii CO2 seems to vary about 4 to 6 ppm per day, in Minnesota I had an 84 ppm shift in 3 hours and we have no volcanoes.
Elmer,
Depends of where you measure CO2: in the first few hundred meters over land you have a lot of local sources and sinks which are not mixed well, especially when there is inversion and no wind. At night vegetation is a source of CO2, in daylight a huge sink but with more turbulence due to sunlight, CO2 mixes better.
Here the daily changes of a few calm days in a semi-rural village of mid-west Germany, Giessen, where the modern station takes half hour samples (GC) of CO2 compared to “background” stations, Mauna Loa, Barrow and South Pole:
http://www.ferdinand-engelbeen.be/klimaat/klim_img/giessen_background.jpg
Once you are above a few hundred meters over land or everywhere above the oceans, the levels are near equal all over the globe in 95% of the atmosphere, except for the huge seasonal changes, mainly in the NH. Therefore most “background” measurements are done on islands in the oceans, high on mountains or coastal with the main wind direction from the oceans or deserts like the South Pole or with airplanes, far away from huge sources and sinks…
Although Mauna Loa is on a volcano, most of the time the trade winds are blowing along the station. Occasionally the wind comes downslope from the volcanic vents. The CO2 variability then is much higher than taken from the trade winds. These data are marked and not used for daily and monthly/yearly averages, but still available as hourly averages + standard deviation of each hour.
Thank you for your post. The CO2 levels on your chart are changing by 200 PPM which is over 50% everyday, which seems like a lot to me. I know some of this is man-made CO2 but by in large I would guess this is natural or what I call the “Photosynthesis Effect”.
It seems like science is obsessed with a 1ppm annual increase in atmospheric CO2 and its effect on temperature but pays little attention to what CO2 levels are doing near the surface on a daily basis which is robust and amazing. It’s the lungs of life on the planet.
I concede that the 1ppm increase of atmospheric CO2 every year is probably caused man digging up fossil fuels and burning them. I doubt this has little effect on temperature and is mostly beneficial to the planet by making it greener.
When we dig up fossil fuels and burn them we are basically digging up ancient plants and tress, bringing them back to the surface and by burning them we are turning them back into plants and trees. Which is a good thing.
Elmer,
Indeed most of the diurnal changes is natural: especially by/from vegetation. With wind, the difference gets smaller and smaller, until with a huge storm even near surface the CO2 levels approach “background” CO2 levels.
And of course we agree that CO2 has more benefits that it causes harm. Its influence on temperature is quite modest, if not marginal…
Any relation to variations in the dew point temperature during the course of night and day? this would affect moisture in the atmosphere, it’s ability to hold temperature steady or not depending on the %humidity. It would also account for variation in atmospheric pressure.
As for tides, (forget the moon for a minute, take it away for simplicity), whether water or air, the sun’s gravity creates a tide twice per day for two reasons. One is Willis’ difference in solar gravitational force by virtue of the difference of about the diameter of the earth that he wrote about a few years ago.
The other is kinematic in regard to the sun’s gravity and earth rotating, (one I mentioned back then), that a particle on the midnight side of earth is traveling faster than earth’s solar orbit velocity (particle’s V^2/R > Sun G) tending to cause it to weigh less and a particle on the noon side of earth is traveling slower than earth’s solar orbit velocity (particle’s V^2/R < Sun G) also causing it to weigh less. (So the velocity component tangent to earth's orbital path of a particle at 6AM or 6 PM will be the same as earth's orbital velocity and therefore be unaffected by earth's rotation WRT to it's gravitational attraction to earth. I.E. it's going at the same speed around the sun as the center of earth only at those two times of day.)
We should be able to measure this using a big weight hung at the end of a very long spring, (immersed in molasses as a damper). So with no moon, things should weigh less at noon and midnight and there would still be a tide twice a day.
Are the above the reasons for the observed daily variation in atm pressure? I'd say probably…
Willis, thanks for the interesting graphs!
While you are at it, I have a long standing question from different sides about the influence of rain on the CO2 levels measured. In my opinion, there is hardly any influence, as fresh water dissolves only small amounts of CO2. As I had no rain data of Mauna Loa, I couldn’t answer that question.
If you have the time and if you like to do it, can you combine the rain data at the observatory with the CO2 data of the same hours and compare them with the CO2 data from a few hours before and after the rainfall?
Looked at the Mona Loa rationalization. Ears perked early with excuses for not treating people like adults. When they started to talk about more co2 inthe northern hemisphere because of bla bla bla.
That was the third strike! Please i saw the NASA CO2 satellite data. Go away!
1oldnwise4me,
Lots of CO2 and other data at the NOAA carbon tracker site:
http://www.esrl.noaa.gov/gmd/dv/iadv/
Standard starts with Mauna Loa, but you can choose any station on the map.
Then choose carbon cycle gases / parameter: carbon dioxide / data type: in situ data (if available) / data frequency : monthly – daily – hourly averages (if available) / time span: of your choice / submit
The graph of the data is shown with below the graph a choice to download the data. That gives the list of data files. In that list (usually with 1 item). click on the hard disk symbol below the “Data” word and the data is downloaded…
Willis, always interesting stuff nicely presented. I’ll leave the air pressure trace for someone else to resolve. What caught my eye was your statements:
“Murphy’s Law means that all related emergent, parasitic, and other losses in response to that surface warming will tend to oppose this effect. In other words, we expect the natural response to elevated surface temperature to be one of cooling of the surface…..”
and:
“….Now, the radiative loss varies as the fourth power of the temperature. This means that if the temperature varies around some average value, the radiative losses will be larger than if the temperature were steady. As a result, since the variation in absolute humidity warms the afternoons and cools the early mornings, to that extent it will increase the overall surface radiative losses”
Some will know I have been putting forward Le Chatelier’s Principle as a default position in beginning to think about any dynamic problem (economist Samuelson saw the principle in action in price/supply/demand dynamics). The broader applicability of the principle (not known to its creator at the time – he thought it a feature of a disturbed was a chemist, ) can be stated as:
“Any change in status quo prompts an opposing reaction in the responding system.”
https://en.wikipedia.org/wiki/Le_Chatelier's_principle
This idea was not given any consideration in formulation of climate science theory and I suspect this principle is not known to many climate scientists. Le Chatelier formulated it from observations of resistance to chemical equilibrium changes caused caused by alterations in parameters of the equilibrium (changes in temperature, pressure, concentration…).
At that seminal moment when scientists recognized the absorption of LWIR by CO2, it would have been helful to have then thought: “I wonder how the responding system might resist this?” Newton’s laws of motion, back EMF in an electric motor, and countless other dynamic examples would be anticipated by the principle. Your emergent phenomena are an excellent example that automatically rang true to me.
I think it would be interesting to plot the heat content and dry/wet bulbs in step with the humidity. The amount of heat changes in RH movement is quite impressive.
For those interested in atmospheric tides and pressure fields –
http://journals.ametsoc.org/doi/full/10.1175/1520-0469%281999%29056%3C3874%3ADASTIG%3E2.0.CO%3B2
Bernoulli’s principle: the terminator winds increase the relative (to the atmosphere) velocity of the local air. The relative velocity change causes a pressure decrease.
Willis, whilst I definitely agree that for a passive effect like CO2, nature will tend to oppose a change in atmospheric temperature gradient rather than enhance it, I’m not sure its an example of “Murphy’s Law” except as it relates to climate research departmental funding perhaps.
Curious question Willis. /EOPH56cEGAIgAigC/dHk2bPH9X-_4SlpLmqBgoweAyX_qjZTtQUa_UWn94go?size=1280×960&size_mode=3
I suspect the answer may be a bit more complex.
At first, I suspected a data issue with 24 hour time frames actually recorded as 12 hour sessions; (Don’t laugh, I once did find a similar issue when a data center was placing two two week data files on a tape while the receiving data center was expecting one 28 day file. The final data file was puzzling, especially since the sending data center never loaded the two week data periods in the same order.
But downloading the hourly barometric pressure into a spread sheet quickly proved your puzzling question.
Looking at the specific time frames:
The morning barometric pressure begins to rise approximately one hour after midnight on Jan 1, 2015.
Peaks, 675, at 5AM to 7AM,
Then declines until a nadir approximately @ur momisugly 1PM, 672.7,
Begins rising again @ur momisugly 2PM, rising until apex @ur momisugly around 7PM,
begins to decline again @ur momisugly approximately 9PM, declining until nadir just after midnight.
May I suggest a complex interaction:
I included the 10 meter temperature profiles. The afternoon – evening temperature profile looks closely allied to the afternoon – evening pressure profile. Pure correlation at this point, but logical that mid day heating would cause air to rise somewhat faster than humidity increases.
As humidity maximizes the pressure begins to reflect pressure inflections from the dew point cycle as the air cools. So night time temperature does have influence, but only after humidity begins condensing into dew.
No proof whatsoever so just an armchair discussion item.
I got some of my thoughts from imaging sitting outside, when the air begins to cool, when the air gets clammy, when the air begins to feel crisp and the first movements of dawn’s breeze.
I was also curious whether moon winds and breezes might also have some effects…
Just thinking. Great thought provoking question Willis!
This is a couple years of temp and rel humidity, showing the limiting effect of temp on humidity. It is land based data, there isn’t unlimited water to evaporate.
ATheoK
I get an error with your link.
Eyesonu: ?dl=0
?dl=0
My error.
ATheoK
Thank you. I’ll look at this a bit. I have that ‘need to know’ psych about me.
I hope Willis, if he has time, will cover the issue/question that he raised in the leading post and the one I can’t quite seem to grasp. I just gotta understand it.
I’ll be back!
@ur momisugly micro6500
Seems that generally the pressure drops with a drop in temp from your link. I need to ponder that for a while. My earlier thoughts were that the colder air being more dense and drier would show higher pressure.
Any explaination on this would be welcome.
here’s a good look at what happens when the polar/tropical air masses moves back and forth over my house.
But you can’t really see anything at this scale with air pressure, so, air pressure by itself.
Well … I’ve had sleep and this morning coffee and I’m still a bit perplexed with this pressure/temp thing. Could we just change the data to fit my earlier understanding? Well… maybe it would really be better for me to understand than to hide my ignorance by changing the reality/data/science/physics.
So hopefully someone can get me past this lack of fully understanding Willis’ hourly pressure chart and micro’s chart (per link February 22, 2016 at 4:56 am ).
micro, thank you.
I just posted this comment only to see that you post immediately above as I commented. Give me time to check out your graphs.
don’t know that I’d expect it to change much. But, I got a $100 weather station that does logging, I wanted to be able to measure the weather I live in, so when I look at station data, I might have a clue once in a while, it’s helped that a little I guess.
With the large daily swing in temp, I started to wonder what the difference was when within a few days you could have clear days with a 75F max, and 90F max. Solar hardly changes, the energy stored in the ground hardly changed, the daily range hardly changed.
Humidity and temp changed.
Interesting graphs, thank you Willis!
I try to reproduce those graphs but for year 2015 I got somewhat mirror image. Because I can’t find mistake in my OpenOffice spreadsheet I think you and NOAA are using different clock. NOAA some kind Greenwich clock and you a Honolulu clock.
I am talking about this data:
ftp://aftp.cmdl.noaa.gov/data/meteorology/in-situ/mlo/met_mlo_insitu_1_obop_hour_2015.txt
The “readme” text file says the data is zulu time.
Water vapor rise is due to plant respiration. I’ve experienced this first hand working on ranches. A foggy morning extends into mid day and the moment the sun comes out ge humidity jumps..
” A foggy morning extends into mid day and the moment the sun comes out ge humidity jumps..”
Fog is condensed out water droplets, when the sun comes out they evaporate, becoming water vapor.
I would expect rh is near 100% while it’s foggy, and to stay there as the fog burns off, until the temp warm higher than 100%rh after its all evaporated. Then all the available water is vapor, but due to temp rise about that point rh starts to drop, while absolute humidity stays about the same.
That should be
….. rh humidity …..
Well ….If I was the old country type, after following the comments on this thread, I would probably just hook my thumbs under my bib overalls and say that there ain’t enough info in this thread to solve Willis’ and my questions with regards to the pressure/time issue in figure 5.
It’s clearly semidiurnal tidal. The time phasing is dictated by inertia and compressibility of air. Hang a substantial weight on a long light spring or rubber band. Get the weight going up and down in a regular motion. Notice how the motion of the weight lags in phase behind the motion of your hand? (e.g. your hand starts going up before the weight has reached the bottom.
It is a density altitude or differential partial pressure effect. Water vapor is lighter than dry air, and has a much lower partial pressure than nitrogen or oxygen. As the air heats up, its volume increases and holding everything else equal its pressure increases from dawn to about noon. As it heats however, it becomes more humid if there is open water around (island!). This is counter-cyclical because increased water vapor lowers the total pressure of the combined gasses in air (Dalton’s law). Pilots use the term density altitude to describe this humidity effect.
As daytime heating continues, the pressure rise slows and then reverses. As the sun goes down, air begins to cools, and the water vapor condenses out. The latent heat of phase change is removed first before sensible heat of temperature change begins, so the air increases its pressure as it drops its water vapor load. the when it reaches its dry equilibrium limit, the air itself cooling becomes predominating until the pressure peaks and the begins to reduce pressure overnight as the air temperature drops further.
To be more precise I should point out that the volume of air wants to increase on heating but the atmospheric weight prevents expansion and so pressure rises with heating because of the volume constraint.
“the atmospheric weight prevents expansion” C’mon… If that was true then hot air balloons wouldn’t work.
I would like to see a graphical plot of the pressure at varying elevations (as Willis did in Fig 1 for temp) as well as wind speed and humidity at different elevations all plotted on an hourly basis.
I think Willis is on to something good here. I may be trying to read too much into his presentation but in consideration of comments bringing up expanding/heated air being constrained due to inertia of the atmosphere above, moisture content/humidity, atmospheric waves, etc this is very interesting.
A good research project might be to do an in-depth analysis on the lower 100 meters (+- ?) on an hourly basis at various altitude such as Willis has done to analyze in a comparative way the total effect of the various influences on the air pressure. I arbitrarily chose the lower 100 meters as the bulk of the mass of the atmosphere is closer to the ground (as opposed to higher altitudes) and the ground constrains any expansion in that direction while being the source of the heating.
I don’t think this will solve any concerns with regards to climate issues but would be interesting to know for those with inquiring minds.
Anyway, Wills thanks for the thought provoking post.
Nature always sides with the hidden flaws …
Or, as Leonard Cohen put it (in an out take from Emerson’s essay “On Compensation”) in “Anthem”: there is a crack, a crack in everything … that’s how the light gets in.