Guest essay by Dr. Roger Pielke Sr.
– FOREWORD: WUWT readers probably remember when the now head of NASA GISS, Dr. Gavin Schmidt, could not stand to be seen on the same stage with Dr. Roy Spencer. Gavin decided to hide offstage while Dr. Spencer had finished his interview with John Stossel, rather than be subject to some tough questions Dr. Spencer might have posed in a debate with him on live TV. Gavin knew he’d lose, so he acted like a child on national TV and hid from Dr. Spencer offstage. It was one of the truly defining moments demonstrating the lack of integrity by mainstream climate scientists.
 Now, Dr. Schmidt seems to be hiding from those inconvenient questions again, as Dr. Roger Pielke Sr. writes below. Dr. Schmidt also hides from me, having blocked WUWT on Twitter, so I’d appreciate it if some other WUWT readers would let him know of this publication. Dr. Schmidt is welcome to publish a rebuttal (or simply answer the questions) here if he wishes. He has my email. – Anthony Watts
Questions for Gavin Schmidt – Director of the NASA Goddard Institute for Space Studies in New York
by Dr. Roger Pielke Sr.
On March 18 2015, I submitted a set of questions to Gavin Schmidt, Director of NASA GISS, who initially seemed inclined to answer and ask some of his own. However, he now is not even replying to my e-mails. If he were a scientist without leadership responsibilities in the climate community, he certainly can choose to ignore my request. However, he is a Director of a major US federal laboratory and, as such, he (or his staff) should be responding to such requests. As of today’s date, he has not answered any of the questions.
By posting these questions, I am encouraging others to respond to the science issues I have raised, as well as be used in the future when Gavin is required to testify, such at a House and/or Senate committee. In your comments, please focus on the scientific issues and avoid any comments on motives, personal attacks etc.
My questions to Gavin follow:
Gavin,
Below are my questions that you agreed to look at in your tweet. I have copied to Judy as her weblog is an appropriate place to present this Q&A if she agrees. Judy might also want to edit and/or add to the questions.
Thank you for doing this. It shows that there is room for constructive debate and discussion on these issues.
1. There is a new paper on global albedo Stephens et al 2015
Click to access albedo2015.pdf
There is also a powerpoint talk on this at http://wind.mit.edu/~emanuel/Lorenz/Lorenz_Workshop_Talks/Stephens.pdf
Among the conclusions is that
“Climate models fail to reproduce the observed annual cycle in all components of the albedo with any realism, although they broadly capture the correct proportions of surface and atmospheric contributions to the TOA albedo. A high model bias of albedo has also persisted since the time of CMIP3,mostly during the boreal summer season. Perhaps more importantly, models fail to produce the same degree of interannual constraint on the albedo variability nor do they reproduce the same degree of hemispheric symmetry.”
Q: How do you respond to this critique of climate models with respect to the GISS model?
2. In 2005 Jim Hansen made the following statement regarding the GISS model [https://pielkeclimatesci.files.wordpress.com/2009/09/1116592hansen.pdf]
“The Willis et al. measured heat storage of 0.62 W/m2 refers to the decadal mean for the upper 750 m of the ocean. Our simulated 1993-2003 heat storage rate was 0.6 W/m2 in the upper 750 m of the ocean. The decadal mean planetary energy imbalance, 0.75 W/m2 , includes heat storage in the deeper ocean and energy used to melt ice and warm the air and land. 0.85 W/m2 is the imbalance at the end of the decade.
Certainly the energy imbalance is less in earlier years, even negative, especially in years following large volcanic eruptions. Our analysis focused on the past decade because: (1) this is the period when it was predicted that, in the absence of a large volcanic eruption, the increasing greenhouse effect would cause the planetary energy imbalance and ocean heat storage to rise above the level of natural variability (Hansen et al., 1997), and (2) improved ocean temperature measurements and precise satellite altimetry yield an uncertainty in the ocean heat storage, ~15% of the observed value, smaller than that of earlier times when unsampled regions of the ocean created larger uncertainty.”
Q: What is the GISS update to this summary including the current estimates for the imbalance?
3. There are questions on the skill of the multi-decadal climate prediction models in terms of their use for regional impact studies for the coming decades. These models have been tested in hindcast runs. What are your answers to the following:
When run in hindcast (over the last few decades) where the forcings of added CO2 and other human inputs of greenhouse gases and aerosols are reasonably well known:
Q: What is the quantitative skill of the multi-decadal climate projections with respect to predicting average observed regional climate statistics?
Q: What is the quantitative skill of the multi-decadal climate projections with respect to predicting CHANGES in observed regional climate statistics?
Q: What is the quantitative skill of the multi-decadal climate projections with respect to predicting observed regional extreme weather statistics?
Q: What is the quantitative skill of the multi-decadal climate projections with respect to predicting CHANGES in observed regional extreme weather statistics?
4. The issue of value-added by regional downscaling has been discussed in
Pielke Sr., R.A., and R.L. Wilby, 2012: Regional climate downscaling – what’s the point? Eos Forum, 93, No. 5, 52-53, doi:10.1029/2012EO050008. http://pielkeclimatesci.files.wordpress.com/2012/02/r-361.pdf
Among our conclusions is that
“…downscaling has practical value but with the very important caveat that it should be used for model sensitivity experiments and not as predictions….. It is therefore inappropriate to present [downscaling of multi-decadal climate projections] results to the impacts community as reflecting more than a subset of possible future climate risks.”
Q: Can regional dynamic and/or statistical downscaling be used to increase the prediction (projection) skill beyond that of available by interpolation to finer scales directly from the multi-decadal global climate models predictions?
5. There is considerable debate as to where heat has been going in recent years since the temperature increases at the surface and troposphere have flattened. On example of this discussion is in the post
Cause of hiatus found deep in the Atlantic Ocean
Q: Since it is claimed that a large fraction of the heat from human input of CO2 and other greenhouse gases has been going into the deeper ocean over the last 10-15 years (as an attempt to explain the “hiatus”), why is the global average surface temperature trend still used as the primary metric to diagnose global warming?
6. The paper
Matsui, T., and R.A. Pielke Sr., 2006: Measurement-based estimation of the spatial gradient of aerosol radiative forcing. Geophys. Res. Letts., 33, L11813, doi:10.1029/2006GL025974. http://pielkeclimatesci.files.wordpress.com/2009/10/r-312.pdf
writes the following
“This paper diagnoses the spatial mean and the spatial gradient of the aerosol radiative forcing in comparison with those of well-mixed green-house gases (GHG). Unlike GHG, aerosols have much greater spatial heterogeneity in their radiative forcing. We present a measurement-based estimation of the spatial gradient of aerosol radiative forcing. The NGoRF is introduced to represent the potential effect of the heterogeneous radiative forcing on the general circulation and regional climate.The heterogeneous diabatic heating can modulate the gradient in horizontal pressure field and atmospheric circulations, thus altering the regional climate.”
The paper
Mahmood, R., R.A. Pielke Sr., K. Hubbard, D. Niyogi, P. Dirmeyer, C. McAlpine, A. Carleton, R. Hale, S. Gameda, A. Beltrán-Przekurat, B. Baker, R. McNider, D. Legates, J. Shepherd, J. Du, P. Blanken, O. Frauenfeld, U. Nair, S. Fall, 2013: Land cover changes and their biogeophysical effects on climate. Int. J. Climatol., DOI: 10.1002/joc.3736. http://pielkeclimatesci.files.wordpress.com/2013/07/r-374.pdf
…shows that such heterogeneous forcing also exists for land use/land cover change.
Q: What is the relative role of land use/land cover change relative as well as added aerosols with respect to added CO2 and other greenhouse gases in affecting local and regional climate and changes in regional climate statistics?
6. In our post at Climate Etc
An alternative metric to assess global warming – http://judithcurry.com/2014/04/28/an-alternative-metric-to-assess-global-warming/
we wrote
“We present this alternate tool to assess the magnitude of global warming based on assessing the magnitudes of the annual global average radiative imbalance, and the annual global average radiative forcing and feedbacks. Among our findings is the difficulty of reconciling the three terms.”
Q: Please provide your best estimate for the terms.
7. The book
DISASTERS AND CLIMATE CHANGE Rightful Place of Science Series
Consortium for Science, Policy & Outcomes by Roger Pielke, Jr.
http://sciencepolicy.colorado.edu/publications/special/dcc/index.html
discusses the role of changes in climate in recent decades on disasters.
Q: What is your conclusion on the role of changes in extreme weather as they affect society during the last several decades?
Roger Sr.
dbstealey said “No matter what you say, no matter what you believe, no matter what you preach, there is one central fact that deconstructs all of it:
Global warming stopped many years ago.”
The evidence says that the only precise version of your statement which is true would read “the lower tropospheric temperatures provided by the RSS dataset show no rising trend over a period of 20 years.”
My version of a cherry picked (to suit me) statement (which is equally valid to your statement) is that the Cowtan and Way hybrid temperature data set shows a solid 1.1 degrees C per century rise between 1997 and 2013. My statement has equal validity to yours. The conclusion I can draw, equally validly to you, is that AGW is real and ongoing.
However, the truth is that neither on their own looks at a broad enough picture – a better prediction of the AGW trend will use as much available evidence as possible.
Now let us define some terms :-
WARMING is the condition where more energy (strictly power) enters the top of the atmosphere from the sun than leaves the top of the atmosphere into space. The outgoing radiation includes both high energy reflected sunlight and low energy wavelengths consistent with surface and atmospheric temperatures.
Now whether the earth’s surface is warming or not, there is an imbalance at the top of the atmosphere. In virtually every case 95% and more recently higher than this) goes into warming the oceans which have fourth thousand times the heat capacity of the atmosphere for the same temperature rise.
Now the culture here is to look at only surface temperature rises, specifically from whichever surface temperature dataset gives the lowest temperature trends (RSS currently, though this was not always flavour of the month). However, the law of conservation of energy says that the earth as a whole is warming because more energy is entering the earth system than is leaving it. It does not really matter where the energy ends up.
Current best estimate of such energy imbalance (radiative forcing) is around +1.9 Watts /sq m, up 0.4 from +1.5 W/sq m in 1998. Any positive number implies warming of the earth, and it is clear from the numbers that the rate of warming is increasing over time.
The surface temperature datasets contain huge random fluctuations in temperature (known in the trade as “noise”) and against this the AGW component (“signal”) is small, so to obtain a good reading of the AGW signal component of surface temperature datasets you have to look as broadly as you can – the more readings over the longer timescales the more chance you stand of picking out what is happening.
Nate Silver’s book “The Signal and the Noise” has a very good section on climate changes, which I am only part-way through reading. However, the argument he makes is that predictions based on real physical laws are far preferable to those which are entirely data driven. The mainstream climate science is based greenhouse warming for which the laws have been known for 150 years. Any predictions based on one (or even multiple) high-noise low-noise temperature data sets by contrast are much more liable to error.
The obvious conclusion is that AGW warming is real and ongoing, and that you only dispute that because you are looking too narrowly.
Oh and Nate Silver also cautions that overconfidence (such as yours) is one highly significant cause of failed predictions (such as “Global warming stopped many years ago”).
Try to understand a little more of how to get a better assessment of such matters, rather than producing the standard catch phrases which are much in vogue here. Then you may begin to see why AGW is based on a concensus and a whole slew of research evidence, rather than a single totally narrow surface temperature data set.
Apparently real, ongoing and mild, this AGW, a net benefit for the whole biome, not to mention the greening, omigaia! Observations and models both useful, but observations will give best clues to as yet unknown natural variations.
==========
CP, that’s a lotta pixels trying to explain away what everyone knows:
Global warming stopped many years ago.
You try to refute that with an assertion:
The obvious conclusion is that AGW warming is real and ongoing…
No, it isn’t. That is your own belief system, but it has nothing to do with reality. Here is a chart from data recorded by Dr. Phil Jones, an über-Warmist:
http://s10.postimg.org/64lz3lyu1/HADCRUT4_from_2000.png
Even the AGU now refers to “the Global Warming Hiatus”, which means that global warming has stopped. Go argue with them if you want. You’re making zero progress here with your baseless assertions.
dbstealey. The problem you have in spades is focusing on only one metric of AGW – which is short/medium term surface temperatures, rather than looking at energy flows.
The science says that, since the sunlight entering the earth’s atmosphere is more or less fixed, the energy imbalance at the top of the atmosphere cannot come into equilibrium unless the long-wave (infrared) radiation leaving the earth increases, and this needs an increase in surface temperatures. Not necessarily today or tomorrow, but at some point in the future. Nothing can avert that (unless we start removing CO2 from the atmosphere which would allow upper stratospheric temperatures to increase).
So we have a scenario where you are claiming warming has stopped. You would like to pretend it is for all time, but there is not a shred of evidence that warming will not restart, since even you would admit it was rampant prior to 1997.
Further the energy imbalance (radiative forcing) is still increasing. The strong conclusion is that therefore warming is bound to start up again some time – this year, next year, next five years, next decade. And that is why we have to take action on CO2 and other GHG emissions.
And the larger the radiative forcing imbalance is when the surface warming restarts the faster surface temperatures are going to start rising when the sea stops taking as much the excess heat. Radiative forcing is increasing all the time.
So, even if your treble cherry-picked RSS surface temperature “pause” is valid at present it has to be a transitory state which cannot last.
And it is therefore crucial that the countries of the world do something about it, before we make the world significantly harder for humans to inhabit safely and peacefully.
Nope, anthropogenic warming, to the extent man can do it, will only be a net benefit to the total biome and to human society. The greening is icing on the cake.
Who but humans can sustain the atmospheric CO2 concentration? Who renews it but us?
===========
Also, Pauvre Pete, your scenario ignores possible cooling climate variations. You are really doing no more than delineating the properties of CO2 in a sealed flask in the laboratory, and describing the theoretical warming of its greenhouse effect.
Kiddo, there is way more than that going on. Like I’ve told Ken Rice: ‘and Then There’s Everything Else’, which encompasses a great deal more than the physical radiative effect of one simple chemical compound. ‘Everything Else’ also includes a great deal of poorly understood atmospheric, oceanic and other systemic physics.
How sure can you be, Pete, that the only effect on climate for the near and medium term will be the rising CO2 concentration? You seem to believe that, but just why mystifies me.
==============
kim says:
How sure can you be, Pete…
Pete isn’t just sure, he’s certain.
He’s also wrong, as Planet Earth is showing him.
Global warming stopped a long time ago. But rather than admit it and try to find out where the alarmist crowd’s premise went wrong, they ‘say anything’.
A real scientific skeptic would try to find out what went wrong with his premise. He would ask other scientists to help — and they would be happy to help him, because any real scientist is interested in knowledge, first and foremost.
But CP and the rest of the alarmist cult aren’t interested in knowledge. They demand to be right. Since the planet is making it clear that their premise was wrong, they will “say anything” rather than admit they were wrong.
The bottom line: Global warming stopped many years ago. C. Pete just cannot admit that fact. So he will say anything to avoid admitting that he was wrong.
That’s not science. That is a combination of politics and religion, and rational arguments cannot convince someone like that.
His, and others’, problem is that even if his energy balance scenario is correct, then the ‘missing’ energy seems to have gone so deep as not to re-appear short of the onset of glaciation. This deepsixes the catastrophe if so and probably isn’t so because of clouds reflecting the ‘missing’ energy. So, he’s wrong about catastrophe even if he’s right about energy balance and wrong about catastropohe if he’s wrong about energy balanace.
He might as well accept the future’s understanding of man’s pitiful little aliquot of fossil CO2. It has done, and will continue to do, far more good than harm.
======================
Meh, the problem Climate Pete and others have in the spades that will dig the grave of their catastrophic consensus is the unholy focus on only one climate forcing. What makes it so unholy is the focus is on the one thing that the Earth cannot sustain itself with, and that is an adequate atmospheric concentration of CO2.
Double heh, the Holy Wars over the ideal concentration have just begun. The plants are already organizing their home grown militias, and regulating their drills.
====================
Climate Pete says:
WARMING is the condition where more energy (strictly power) enters the top of the atmosphere from the sun than leaves the top of the atmosphere into space.
Give it up, Pete. Moving the goal posts only confirms that you will “Say Anything”, rather than admit that your CO2=cAGW conjecture could be wrong.
Warming = higher temperatures.
Global temperatures have not risen for over 18 years.
Therefore, global warming has stopped.
So now you’re off on a heat flow tangent. Just like lawyers, you can “say anything”. But the only ‘metric’ worth beans is global temperature, which is the same now as it was 18 years ago.
If you’re so good at predicting the future, try the stock market. But be careful, because you’ve been WRONG about global warming for at least 18 years now. Just like the boy who cried “Wolf!!”, no one believes you any more. Your credibility is gone. Kaput.
Once more for the slower students:
Warming = higher temperatures. That has not happened. Therefore, there is no global warming. QED
dbstealey.
You used averaged HadCRUT4 data in a graph above, without ever reading the metadata associated with the temperature data set. If you had read the metadata you would realise a more sophisticated approach is needed because HadCRUT4 does not include all 5 x 5 degree grid points, therefore the spatial averages you get are wrong.
There are various ways of filling in the missing points in order to get a better global average temperature anomaly. One of them is kriging, which is what GISTEMP uses. Cowtan and Way supply a kriged version of the HadCRUT4 data set (as well as the hybrid one). Here is the global average chart and trend from their kriged version of the HadCRUT4 data.
http://api.ning.com/files/8KOwdycLvXQNaQ*PQOm9glxGbvU7ELR24JZDN2Ok7HcHdjCmIDmpPJT3qoA5c0sZT9RmNrbJjOo2evQyWy0Lpg1XE1G3WHwv/CW1997To2015Moyhu.jpg
The chart was screen captured from Nick Stokes excellent Moyhu temperature trend viewer at http://www.moyhu.blogspot.com.au/p/temperature-trend-viewer.html
As you should be able to see for yourself (though I am beginning to have doubts), there is a clear trend withe expectation value of 1.07C / century and confidence interval from 0.4t to 1.67 C/ century.
This gives the lie to your statement there has been no warming recently.
Further, if you pay some attention to what is going on with the current El Nino, you will find it is now expected to last the whole of the summer, and possibly until the end of the year. Smoothed 12 month global temperatures tend to lag the Nino3.4 area temperature by around 4 months, although the two temperature changes will not be equal. However, it is now pretty inevitable that 2015 global average temperatures are going to take an upwards hike, and that 2015 is likely to be the hottest year ever. This may even be true on your favourite RSS dataset. In fact, expert opinion is not ruling out the possibility that surface (and lower tropospheric) temperatures could take a hike by as much as 0.5 degrees C.
So be afraid – be very afraid – your “warming has stopped” position, which is not even true right now, may be just about to crumble into dust before your very eyes.
And once more for the really really slow students…
The important thing is the rate at which the earth as a whole is accumulating excess heat. At some point physics says that this has to be translated into increasing surface temperatures, but the basic physics does not say precisely when. DBStealy ignores this ticking time bomb every time he maintains surface temperatures are the only valid measure of AGW.
You say ticking time bomb and I say gentle fertilizer. Let’s call the whole thing off.
R Gates used to call yours the Human Carbon Volcano; I, mine, the Human Carbon Cornucopia. Your goggles, they do not work. Here, try mine.
==================
Pete, please explain why the IPCC based on the full AGW hypothesis, that they EXPECTED for the world to warm at least .20C per decade,to possibly .30C per decade:
“For the next two decades, a warming of about 0.2°C per decade is projected for a range of SRES emission scenarios. Even if the concentrations of all greenhouse gases and aerosols had been kept constant at year 2000 levels, a further warming of about 0.1°C per decade would be expected.”
http://www.ipcc.ch/publications_and_data/ar4/wg1/en/spmsspm-projections-of.html
But RSS and HadCrut4 thinks there is no warming the first 13 years and 4 months of this century.
http://www.woodfortrees.org/plot/hadcrut4gl/from:2001/to:2015.4/plot/hadcrut4gl/from:2001/to:2015.4/trend/plot/rss/from:2001/to:2015.4/plot/rss/from:2001/to:2015.4/trend
You can’t claim this is a cherry pick because I am matching up with the same years that the IPCC chose to check on the veracity of their modeled temperature projection.
It is Epic Fail in the making.
C. Pete,
You are twisting yourself into a pretzel trying to explain why Planet Earth refuses to do what you want.
Dr. Phil Jones’ HadCru data is only one database. There are others, including the most accurate global temperature data from satellites:
You say:
So be afraid – be very afraid…
And:
DBStealey ignores this ticking time bomb
Um, you’ll excuse me if I am not alarmed. Measurements showing that MMGW is a serious problem would alarm me, and cause me to change my mind. But there are no such measurements! Despite your excessive number of pixels used to try and convince us otherwise, the ultimate Authority — Planet Earth — is busy debunking your “dangerous man-made global warming” scare. The only “ticking time bomb” is in your imagination.
If we eliminate your cut and pasted talking points, your “right-wing think tanks”, your “Koch brothers” nonsense, and your Big Oil “fossil fuel companies” arguments, what are we left with?
We are left with your measurement-free Belief. So listen up:
In science, DATA IS ESSENTIAL. Measurements are data.
But there are no measurements quantifying man-made global warming (MMGW). Not a single one. Despite thousands of scientists diligently searching for verifiable measurements quantifying MMGW (because it would bring them a Nobel Prize, along with fame and fortune if they found any such evidence), no one has ever found any verifiable, testable measurements quantifying AGW.
What does that mean? It means one of two things are possible:
Either MMGW does not exist, or MMGW is just too small to measure. In either case, it can be completely disregarded.
Now, it’s clear that you buy into the belief that dangerous MMGW is a serious threat, despite having no measurements showing that it even exists. So I have a question for you:
What would it take for you to admit that your ‘dangerous MMGW scare has been deconstructed? That it isn’t a problem?
How about a full twenty years of no global warming? How about über-Warmist Dr. Phil Jones admitting that statistically, global warming has stopped? Would that convince you? How about another ten years with no testable measurements of AGW being produced? Or, how about glaciers a mile thick covering Chicago again? Would that convince you that your CO2=CAGW conjecture is wrong?
Or would nothing convince you? There are people like that: nothing can convince them that dangerous MMGW does not exist. Are you one of them?
If not, be specific: what, exactly, would convince you you’re wrong?
Philip Finck,
This has been endlessly discussed, and put to bed. Sorry you missed it.
But the short elevator speech:
RSS and UAH use slightly different data and calibration algorithms, but they both show the same thing within a tenth of a degree or so. And they are converging.
Which one is correct? They are both satellite measurements, so take your pick. Both RSS and UAH are more accurate than any land based data.
Also, you can play with the WoodForTrees site to get just about anything, as you show by selecting year 2000 in your example. But if we go back 13 years with UAH, we get this. And going back a decade we get this.
What is indisputable is the fact that global warming stopped many years ago. That fact certainly puts about four or five torpedoes into the ‘SS Man-Made Global Warming ship’. She’s going down.
Hmmm, ‘raw’ satellite data. Ooh what I’d(the world’d) give for raw surface data.
============
I see that both Climate Pete and Philip Fink, are missing a central problem of having little to zero warming from their own temperature charts, that helpfully undermines the numerous AGW based temperature models they seem so fond of.
Quoting Pete, who seems to lack logical thinking here, since he has actually smashed his own position by showing the little warming he is holding hard onto is well below the IPCC chimp5 models temperature ensemble of much higher warming than the 1.07C warming per century, Pete is drawling on:
“As you should be able to see for yourself (though I am beginning to have doubts), there is a clear trend withe expectation value of 1.07C / century and confidence interval from 0.4t to 1.67 C/ century.”
The IPCC has SPECIFICALLY stated at least .20C to .30C warming PER decade! is EXPECTED, this BASED on the AGW hypothesis.
Fink, seems to miss it too that he as well is damaging the AGW hypothesis by showing far less warming than the IPCC and hypothesis said it should.
He posted a RSS temperature chart for years 1995 to 2015, which does show a tiny warming trend, that is a total of just…. he he he…. .1C over 20 years! which is waaaaay below what the AGW hypothesis said it should be doing. The IPCC has long stated it should warm at least .20C per the recent decades and it never has since 1990.
DR. Jones himself admits that ALL short warming trends are very similar with each other in his BBC interview with Roger Harrabin,showing that the latest warming trend,from 1979-1998 is not unusual or alarming:
He was asked this question:
“A – Do you agree that according to the global temperature record used by the IPCC, the rates of global warming from 1860-1880, 1910-1940 and 1975-1998 were identical?”
His reply in part was,
“So, in answer to the question, the warming rates for all 4 periods are similar and not statistically significantly different from each other.”
Go see HIS temperature chart in the link:
http://news.bbc.co.uk/2/hi/8511670.stm
.
I still find it quite miraculous that that question was asked by Harrabin and answered by Jones. It was in the media shock after ClimateGate, and briefly, I thought that the two of them were going honest.
A very important and revelatory question. Where is man’s effect on those three nearly identical slopes of rise?
==============
kim,
Yes, Dr. Phil Jones shows that global warming steps are the same no matter what the CO2 levels are:
http://jonova.s3.amazonaws.com/graphs/hadley/Hadley-global-temps-1850-2010-web.jpg
That pretty much debunks the “carbon” scare, no?
Only in the last quarter of the last century has the correlation between temperature rise and CO2 rise been any good at all. This whole extraordinary popular delusion may only be the grandest example yet of the ‘Post Hoc, Ergo Propter Hoc’ logical fallacy. Better, to the degree that the warning of warming is extravagant is the delusive bubble.
Face it: Mild warming and magnificent greening is the hallmark and will be the legacy of Anthropogenic Warming. It’s all good.
So now that you can relax about that, get back to work. There’s plenty of that and we’ve been burning sunlight, so if you want any supper, get busy.
======================
Climate Pete here is the evidence. Why don’t you refute each point with data ,not theory to prove I am wrong. You will not do it because there is no supportive data. I would hardly call all these blunders SELECT EVIDENCE.
AGW theory has predicted thus far every single basic atmospheric process wrong.
In addition past historical climatic data shows the climate change that has taken place over the past 150 years is nothing special or unprecedented, and has been exceeded many times over in similar periods of time in the historical climatic record. I have yet to see data showing otherwise.
Data has also shown CO2 has always been a lagging indicator not a leading indicator. It does not lead the temperature change. If it does I have yet to see data confirming this.
SOME ATMOSPHERIC PROCESSES AND OTHER MAJOR WRONG CALLS.
GREATER ZONAL ATMOSPHERIC CIRCULATION -WRONG
TROPICAL HOT SPOT – WRONG
EL NINO MORE OF -WRONG
GLOBAL TEMPERATURE TREND TO RISE- WRONG
LESSENING OF OLR EARTH VIA SPACE -WRONG? I have a study showing this to be so.
LESS ANTARCTIC SEA ICE-WRONG
GREATER /MORE DROUGHTS -WRONG
MORE HURRICANES/SEVERE WX- WRONG
STRATOSPHERIC COOLING- ?? because lack of major volcanic activity and less ozone due to low solar activity can account for this. In addition water vapor concentrations decreasing.
WATER VAPOR IN ATMOSPHERE INCREASING- WRONG- all of the latest data shows water vapor to be on the decrease.
AEROSOL IMPACT- WRONG- May be less then a cooling agent then expected, meaning CO2 is less then a warming agent then expected.
OCEAN HEAT CONTENT TO RISE- WRONG – this has leveled off post 2005 or so. Levels now much below model projections.
Those are the major ones but there are more. Yet AGW theory lives on.
Maybe it is me , but I was taught when you can not back up a theory with data and through observation that it is time to move on and look into another theory. Apparently this does not resonate when it comes to AGW theory , and this theory keeps living on to see yet another day.
Maybe once the global temperature trend shows a more definitive down trend which is right around the corner (according to my studies ) this nonsense will come to an end. Time will tell.
Greenhouse score card showing more blunders
http://www.warwickhughes.com/hoyt/scorecard.htm
Past historical data showing no correlation.
http://wattsupwiththat.com/2012/04/11/does-co2-correlate-with-temperature-history-a-look-at-multiple-timescales-in-the-context-of-the-shakun-et-al-paper/
Current data not agreeing with what AGW calls for.
http://patriotpost.us/opinion/34748
Salvatore,
Mostly you do not understand the significance of the things you are listing, so probably don’t understand whether they are fundamental to the greenhouse effect or not. I’m not going to cover the stuff with links, but here are brief comments on the others.
Measurements have confirmed just about every physical process is correct, including the additional forcing caused by increase in CO2. This has been done in two specific areas. See http://www.nature.com/nature/journal/vaop/ncurrent/abs/nature14240.html
Sure, the climate has made much bigger changes in the far historical past than anything we will see in the next few hundred years, even if you guys will not let the rest of us stop it.
The thing that is unique about the current AGW changes is the speed at which they are taking place – decades to a couple of centuries instead of many thousand years.
And your logic is faulty. The fact such changes have taken place before in no way disproves that they can be taking place now. In fact it probably adds extra credence, would you not say?
There is a feedback here. Warming can cause CO2 release and the additional CO2 can then cause further warming. So CO2 can both lag and lead warming.
The logic flaw is that of false dichotemy – leading and lagging are not mutually exclusive choices. You can have CO2 both leading and lagging warming.
Too vague to comment on.
Too vague to comment on.
Tropical hot spot is not a fundamental aspect of greenhouse gas warming. Such a hot spot would be predicted too if the earth’s orbit changed and more warmth came directly from the sun. So irrelevant.
You are surely making this one up. I have never seen a claim before that AGW will cause more (or longer) El Ninos and therefore fewer (or shorter) La Ninas. The ENSO phase is regarded as random at present, though someone may discover enough about it to be able to predict it better in the future.
What is true is that an El Nino event causes surfaces temperatures to rise in phase with the El Nino, independent of any additional AGW effect. Generally there is a 4 month lag between the El Nino “marker” Nino 3.4 area temperatures and 12-month smoother global average temperatures. We are about to see whether this is true with the current El Nino. Currently the expectation is it will be fairly mild, but will last at least until the end of summer. However, it could last until the end of the year and become stronger, in which case hold on to your hats – you are going to need them to fend off global temperature rises of up to 0.2 degrees C.
See C&W kriging graph above. Just as valid a representation as the RSS graph. All should be regarded only as indicative of real temperature whereas here the RSS graph is treated as gospel and all others rejected.
http://www.nature.com/nature/journal/vaop/ncurrent/abs/nature14240.html
There’s nothing about AGW which says temperatures have to go up everywhere – only that the global average has to go up. Nor does AGW science make predictions about the Antarctic sea ice area. These predictions come from guys who wish to challenge AGW and decide to say things like “AGW should mean warmer Antarctic and therefore a smaller extent or area of sea ice”. So this is pretty irrelevant.
Sea ice is not much to worry about as the sea level does not rise when it melts. However, land ice is much more concerning e.g ice on Greenland, West and East Antarctica would cause 6m, 7m and 60m (from memory) sea level rises if it all melted – which it won’t in the time we are talking about.
The Antarctic is warming slightly. The East Antarctic ice sheet is stable. It is melting faster but the warming produces more snow on top too, so the mass of it is pretty constant.
The West Antarctic ice sheet is starting to melt and lose mass which is not balanced by more snow.
The Antarctic sea is is growing in area, but probably because a) fresh water from West Antarctic melting freezes at a higher temperature than good old sea salt water b) offshore breezes fan out the ice, giving it a bigger area but not much more volume.
Drought increase 1900 to 2002.
Again, this is not a fundamental part of AGW. There is a plausible argument for it which goes that higher temperatures will allow more water to evaporate, putting more energy in the atmosphere. But this is all a bit crude. So it’s not logical to say no increased hurricanes = no AGW.
There is some evidence of increased frequency of very heavy rainfall.
No. Variations in sunlight can’t explain both the surface and stratospheric temperatures generally moving in opposite directions, which is what has been happening for quite a while now. Stratospheric cooling is a fundamental signature of AGW.
http://www.skepticalscience.com/images/Cooling_Stratosphere.gif
And again your logic is faulty. The point is that ongoing stratospheric cooling is happening and is also expected if AGW is real. Only a lack of stratospheric cooling could cast doubt on AGW.
It may not hold true at other lattitudes, but here’s a graph for 20N nto 20S.
http://www.gfdl.noaa.gov/blog/isaac-held/files/2014/07/tropical_wvp.png
You can see it tracks the RSS dataset reasonably.
The phrase “may be” includes a large degree of uncertainty. “May not be” is also a possibility. Some of these things are not easy to measure. That’s just the way it is. If you cannot measure it accurately you cannot use it to cast doubt on AGW.
http://d35brb9zkkbdsd.cloudfront.net/wp-content/uploads/2015/05/heat_content2000m.jpg
NOAA had to extend the y axis from previous charts.
On looking at it again the drought graph was not the one intended because it does not show the change. Here’s the correct image to show drought is increasing.
http://climatechange-foodsecurity.org/uploads/PDSI_increase_drought.png
Climate Pete says:
On looking at it again the drought graph was not the one intended because it does not show the change.
Oh, well then you’d better cherry-pick another one from your confirmation bias file.
And:
Salvatore,
Mostly you do not understand the significance of the things you are listing, so probably don’t understand whether they are fundamental to the greenhouse effect or not.
After that insufferable, ad hominem statement/attack, I would like to see “Climate Pete” post his own CV.
CV
– Researching for a PhD in physics (not climate or atmospheric physics related) at Imperial College London at the age of 60 after a career in IT.
– Keen interest in AGW and energy for about 5 years which motivated me to do the PhD research in the first place
– Among other courses have recently attended an atmospheric physics course (not part of the PhD)
– Attend as many of the Grantham Institute for Climate Change, Energy Futures Lab seminars as I can.
– Friends with Jo Haigh and Arnaud Czaja.
So you’ve learned about power density and the destructive role of power intermittency in grid stability?
=============
Ask about it in class if you haven’t. C’mon, I dare ya’.
=================
Climate Pete says:
CV
– Researching for a PhD in physics
Hey, me too!
And:
– Keen interest in AGW and energy for about 5 years
Same here! What are the odds, eh? The only difference is that I’ve been immersed in this subject for twenty years, ever since global warming took a short jump in ’97, and my working carreer was highly technical and weather related.
And:
– Among other courses have recently attended an atmospheric physics course
Once again, a truly amazing coincidence! And you took “an atmospheric physics course”. Take another one. Can’t hurt. Might help.
And:
– Attend as many of the Grantham Institute for Climate Change, Energy Futures Lab seminars as I can.
You got me there. I haven’t been spoon-fed Grantham’s propaganda like you have.
Gavin Schmidt — I Got The Data In Me
(most sorry Kiki Dee
I got no troubles at NASA
I’m a rocket nothing can stop
Survival’s always the first law
And I’m in with those at the top
I heat up
I cool down
A site I don’t like I discard it
The high and the mighty can frown
So say what they want they reward it
Man is the measure
Of all things that be
The Progressive Alliance
And it New Age Science
Say I got the data in me
I work in the mists and the fogs
By methods that none can review
To hide like a fox from the dogs
The premise of all that I do
The thermometers all want skilling
If their readings are not alarming
As the early ones all need chilling
So the later ones all need warming
Man is the measure
Of all things that be
Protagoras said
What Nietzsche read
So I got the data in me
An apple
In a garden hangs
From the lowest branch of a tree
Why reach for anything higher
It fills my every desire
I got the devil —
I got the devil —
I got the devil in me
Eugene WR Gallun
damn
In a garden hangs an apple
From the lowest branch of a tree
Eugene WR Gallun
Man is the measure
Of all things that be
Friedrich Nietzsche read
What Protagoras said
So I got the data in me
In a garden hangs an apple
From the lowest branch of a tree
Why reach for anything higher
It fills my every desire
I got the devil —
I got the devil —
I got the devil in me
Eugene WR Gallun
Climate Pete says:
There’s nothing about AGW which says temperatures have to go up everywhere
No, but it says global temperatures have to go up, and for many years they haven’t. Sorry about your Belief, Pete. You say:
The thing that is unique about the current AGW changes is the speed at which they are taking place
Climate Pete’s mind is closed tighter than a submarine hatch. But for readers with an open mind, let me repeat:
There are no measurements of AGW.
Therefore, “AGW changes” is meaningless speculation. With no measurements, no one knows the “speed” of any changes — or whether there are any changes. Or whether AGW exists, for that matter.
And:
Nor does AGW science make predictions about the Antarctic sea ice area.
Nor about Arctic ice. But CP and his crowd make those predictions all the time.
‘Climate Pete’ still doesn’t understand that there are no verifiable, testable measurements quantifying AGW. Thus, AGW is merely a conjecture. If it exists (and I think it does) it must be so minuscule that no one has been able to measure it, despite decades of searching. Therefore, AGW can be completely disregarded as an insignificant, 3rd-order forcing. It just does not matter at all.
As for water vapor, we’ve been over all this many times before. Specific humidity has been declining for decades:
Relative humidity has also been declining:
http://www.climate4you.com/images/NOAA%20ESRL%20AtmospericRelativeHumidity%20GlobalMonthlyTempSince1948%20With37monthRunningAverage.gif
And as Dr. Roy Spencer shows, sea surface temperatures are flat:
http://www.drroyspencer.com/wp-content/uploads/TMI-SST-MEI-adj-vs-CMIP5-20N-20S-thru-2015.png
Next, ‘Climate Pete’ purports to show that ocean heat content is rising. But that is flatly contradicted by real world ARGO data:
http://tumetuestumefaisdubien1.sweb.cz/ARGO-sea-temperature-max-max.PNG
C. Pete makes other claims. He cherry-picks certain atmospheric layers to try and show global warming. But as the rest of us know — and as many others including the recent head of the IPCC and arch Warmist Dr. Phil Jones have admitted — global warming stopped many years ago. Climate Pete’s cherry-picking is just his confirmation bias at work. It isn’t reality.
Now, “Climate Pete”, let’s see that CV of yours, if you’ve got one. Are we discussing this article with someone educated in the hard sciences? Or are you just another alarmist lemming who gets his talking points from a thinly-trafficked blog run by a neo-Nazi? Post your CV, Pete. If you have one. Make it verifiable for a change. Because when we try to verify your other links, we see that they’re just dog-whistle links for CAGW True Believers.
dbstealey
CV is posted above as a reply to the first request for it. I’m in the CMTH department and my surname is not Fox. Look me up in the information on the college web site, send me an email and I’ll verify my identity.
I keep posting graphs on this, some from other sources and some from my spreadsheets which say the best evidence is that temperatures have continued to go up slowly over the last 20 years and went up pretty fast before that. You ignore them. The point is not that one graph is right and another wrong, but that the temperature signal is NOISY, with a small AGW SIGNAL. It’s highly likely the signal is not going to show up in graphs from every temperature data set, particularly over a short period such as 20 years of RSS data.
I suggest you read Nate Silver’s book “The signal and the noise” .
You post only the RSS LTL temperature graph or a HadCRUT4 graph which omits a number of Arctic temperatures and therefore misses Arctic warming and is therefore clearly wrong. See http://onlinelibrary.wiley.com/doi/10.1002/qj.2297/pdf for details. This seems to be a deliberate policy by the data providers – they want to provide only high quality data at grid points or none at all, leaving the user to fill in missing data according to the use which will be made of the output.
There are a number of ways of completing the HadCRUT4 data set before averaging it, but completed it must be. Cowtan and Way offer a kriged version (same technique as GISTEMP) and a hybrid version based on satellite snapshots. Nick Stokes on Moyhu has done an analysis based on just filling missing points with the mean temperature for that lattitude which he says provides very similar global averages to either Cowtan and Way method.
The one thing you cannot do is add up the HadCRUT4 gridded data and divide by the number of grid points, because that is equivalent to replacing missing points with the average temperature of those points which are provided. Yet that is what happens in graphs time and time again.
Then you just ignore graphs from other temperature data sets as if they did not exist and claim no warming, without stating the uncertainty in the overall conclusion or really looking for the best statement that can be made which would have to take into account both surface and LTL temperature data sets.
Just you saying something does not make it true. Here are some of the measurements that come to mind. Doubtless you could Google a more complete list if you wanted to :-
– CO2 levels because for over 100 years you have been able to do an approximate calculation of eventual temperature rises from just this single figure.
– Rise in average global surface temperatures over time (not just the last 20 years)
– Upper stratospheric cooling
– Estimates of radiative forcing (energy imbalance)
– Ocean heat contents (not just the first 10 or 100m either, but down as far as the measurements allow).
– Changes in sea level rise rate (i.e. discounting the base rise before AGW took hold)
I’ve given you five indicators above plus CO2, and there are plenty of measurements to support each of those. But the weather signal creates a lot of noise over quite long periods of time and the short-term AGW signal is weaker, so either you have to do a very careful analysis over a short period, or you have to look over longer periods. And sure, there is no black and white proof of either “AGW is real” or “AGW is not happening at all”. The proof is statistical in nature, which means that you have to put a probability on it somewhere on the line.
The mistake you make is this. The data gives a 95% probability to the statement “AGW is real and caused by human CO2 emissions”. You think that means because it is not certain so you can say “there is no AGW”. But the only statement you can actually make is “There is a 5% chance there is no AGW”. So it is a balance of probabilities thing. That’s why you need to know more rather than less about the big picture to get the judgement right.
As for specific humidity, it’s not one of the areas I’ve researched on the web. But I can tell you where the flaw is in your approach. Specific humidity dictates how much greenhouse warming water vapour is responsible for. But this warming will come mainly from the hot low lattitude regions and hardly at all from the poles. So a graph of average global humidity isn’t going to tell you what you need to know. You need something which is much more skewed to the equator to work out the contribution of any change to water vapour to the overall radiative forcing.
Similarly most of the additional evaporation caused by AGW will be close to the equator and hardly at all at the poles, so you need the same skew of relative humidity data to draw conclusions.
Your approach is too superificial. Models don’t stay in phase with actual ENSO (El Nino) phase, so cannot do a good job of predicting sea surface temperatures in the short term. If you control for that by selecting model runs which match ENSO phase or adjust actual sea surface temperatures to eliminate the effect of ENSO-caused temperature variations then you get a reasonable fit of models versus adjusted actuals. If you don’t understand why this is the right approach then why not read Nate Silver’s book.
The oceans have an average depth of 2km. The graphs you have displayed from the ARGO data are for the surface of the sea – it says so very clearly at the top of your graphs. So whether the ARGO data actually contradicts my statement we certainly won’t find out from my graphs.
What happened here is symptomatic, of course. You accept evidence for your viewpoint as gospel whether it is high quality or relevant or not, then completely ignore evidence for AGW , as has been the case with the various temperature charts I have put up. No recognition that they have been displayed, no attempt to explain why you think your data is better.
Climate Pete says:
I attend… as many of the Grantham Institute for Climate Change, Energy Futures Lab seminars as I can.
Ah. You’re an acolyte of someone who has a talent for guessing the markets correctly (and who was/is heavily invested in fossil fuels). But Jeremy Grantham is a scientific illiterate, so if you’re proud of learning from someone like that, you shouldn’t be.
Grantham is very liberal in spreading his money around universities and ‘think tanks’. As Upton Sinclair wrote:
It is difficult to make a man understand something when his livelihood depends on not understanding it.
Next you say:
I’ve given you five indicators above plus CO2
And I have solidly refuted every one of them, to the point that you’ve got nothing left but your misinformation. For just one example you say:
The oceans have an average depth of 2km. The graphs you have displayed from the ARGO data are for the surface of the sea
The ARGO graph I posted was done to debunk your nonsense that oceans are warming more than usual since the LIA. ARGO is real world, empirical data. Since you are nitpicking everything, here is a 0 – 2000 metre ARGO map that shows recent, deep ocean COOLING:
Next:
As for specific humidity, it’s not one of the areas I’ve researched on the web.
I posted real world data showing that both relative humidity and specific humidity have been declining for decades. That debunks the misinformation you posted. But as usual you ignored it, because your own misinformation feeds your confirmation bias. But by all means, keep ‘researching on the web’. Try Wikipedia, I hear you can’t go wrong there.
Next:
You post only the RSS LTL temperature graph or a HadCRUT4 graph
Wrong again. I have posted numerous graphs from many different sources, showing that global warming has stopped. Many of your alarmist pals now admit that fact, including Dr. Phil Jones. Go argue with him if you don’t like what Planet Earth is clearly telling us.
Next, you emit:
The data gives a 95% probability to the statement “AGW is real and caused by human CO2 emissions”.
That is nonsense. I challenge you to post testable measurements explicitly quantifying the fraction of global warming attributable to human emissions. If you do, you will be the first, and on the short list for a Nobel Prize.
But of course, you can’t. You have no such measurements, because they do not exist. Your cut and pasted quote above is a falsifed prediction, promoted by the IPCC which — as global T refuses to do as they incessantly predict — has doubeld down in every assessment report, raising their opinion of AGW as the cause of (non-existent) global warming.
But that is ALL it is: an opinion that has been bought and paid for by governments craving new carbon taxes. It is hard to understand how anyone with the least bit of formal education can be that gullible and credulous. It is clear that you have never seriously asked yourself: Cui bono?
Next:
I keep posting graphs on this, some from other sources and some from my spreadsheets which say the best evidence is that temperatures have continued to go up slowly over the last 20 years
Wrong as usual. Even Dr. Pachauri, recent head of the UN/IPCC, now admits that global warming has stopped. Go argue with him if you don’t like what the real world is telling us.
Finally, you assert:
What happened here is symptomatic, of course. You accept evidence for your viewpoint as gospel whether it is high quality or relevant or not, then completely ignore evidence for AGW
As they say, there is no fool like an educated fool. Your psychological projection, and the DK symptoms you exhibit in that statement are yours alone.
Listen up, “Climate” Pete:
In science, DATA IS ESSENTIAL. Measurements are data. But…
There are no measurements of man-made global warming.
AGW may exist. I think it does. But despite decades of searching by highly trained scientists and metrologists using the most advanced instrumentation, there are still no measurements quantifying AGW. There are only opinions; conjectures. Guesstimates.
If there were testable, verifiable measurements quantifying AGW, and if CO2 had the claimed effect, then we would know the climate sensitivity number with enough precision to accurately predict ∆global T. But the sensitivity guesstimates range from more than 6ºC, down to zero (Miskolczi et al), and everything in between, depending on who you ask.
Therefore, AGW must ipso facto be so minuscule that it can be disregarded and ignored. It is merely a tiny, 3rd-order forcing that simply does not matter. That is why, despite the steady rise in CO2, global temperatures are the same now as they were almost twenty years ago: CO2 simply does not have the claimed effect.
‘Climate Pete’, an honest scientist is a skeptic, first and foremost. But it is clear that you have swallowed the “dangerous man-made global warming” narrative, despite the obvious fact that there is nothing unusual or unprecedented happening. It is clearly your religious belief, based on your assurance that we are headed to hell in a handbasket. You just want to BELIEVE in your CO2=CAGW fantasy, even though it does not stand up to even the mildest scrutiny.
Dr. Gavin Schmidt has probably just discovered discovered something important – You can fool some of the people all the time. You can fool all of the people some of the time. You cannot fool all of the people all of the time.
dbstealey,
You will find I am a very fast learner, and can read too.
You really must think not only me, but also all the readers here were born yesterday. You put up this pretty coloured graph (which has changes in ocean temperature 0-2000m from 2005 to 2012). Then you claim it shows ocean cooling. I guess you are hoping everyone just looks at the colours and accepts your word for it.
Unfortunately for you, the graph title actually contains a definitive figure for the average ocean temperature rise, excluding land and polar seas.
In this case it says “ocean 0.02 degrees C per decade”. For the benefit of anyone reading this, a positive number shows warming and a negative number shows cooling.
So dbstealey’s graph which he claims shows cooling actually shows warming.
What have you to say, dbstealey? Were you the one born yesterday, or were you hoping everyone else was?
Where’s the beef?
==============
I love it when you alarmists post skeptic talking points.
============
Exercise for the student. At that ocean heating rate, how long will it take the oceans to boil? Now, for extra credit, speculate on what else may happen to energy balance and flows in the meantime?
================
The beef is this.
For the same temperature rise the oceans (which are up to about 4km deep) can retain around 4,000 times as much heat as the atmosphere – maybe 2,000 times down to 2000m only though this is going to be an underestimate. So 0.02 degrees C ocean warming down to 2km equates to 40 degrees C atmospheric warming in terms of the heat. Normally at least 95% of excess AGW heat goes into the ocean, probably more recently at least 99%. So 0.02 degrees C per decade ocean temperature rise is equivalent to around 0.4 degrees C per decade of atmospheric warming. That is 4 degrees C per century.
So the ocean have a huge multiplier in terms of heat energy compared to the atmosphere, and it doesn’t do to take it lightly. There is very much a case for dbstealey to answer with even such a small degree of ocean warming.
Pete,
The oceans are up to about 11 km deep, not four.
The mean depth of the oceans is indeed around 4 km, however. Maybe that’s what you meant.
When you figure out why it’s not going into the atmosphere, let me know.
And please tell me how your calculations fit in with Trenberth’s ‘missing heat’ assertion.
==================
So Pete, what do you conclude from this with respect to atmospheric warming ?
I have an interim conclusion, which is that science is not your calling. Have you thought about other career choices?
He’s coy about what sort of physics he does study. Perhap physics for the bowels of constipated skeptics.
=========
Pete, I explained that the map showed “recent” cooling, which it does. You referred to decadal changes, which are so minuscule that they’re within error bars.
philincalifornia is right when he notes that science isn’t your calling. You wrote above that you get your sciency info from stuff you’ve “researched on the web.” Try Wikipedia, I hear they’ve got lots of climate information for folks like you.
Yes it shows a TINY warming trend,that is less than it was 15 years ago. The ocean water is warming less and less over time.
Climate Pete didn’t answer kim’s question.
Instead he said this:
Normally at least 95% of excess AGW heat goes into the ocean, probably more recently at least 99%. So 0.02 degrees C per decade ocean temperature rise is equivalent to around 0.4 degrees C per decade of atmospheric warming. That is 4 degrees C per century.
The first sentence is a baseless assertion. “Climate Pete” has never responded to may question, asking him to produce testable measurements quantifying AGW. So of course he cannot make credible assertions like “95%” or “99%”.
And: “normally”?? There is nothing abnormal happening! Nothing unusual, and nothing unprecedented is happening. The climate Null Hypothesis has never been falsified.
The second “Climate Pete” sentence is falsified by the global temperature record. If it was true, global T would have risen by 0.8ºC — as much as in the preceding 150 years.
It hasn’t. Instead, global warming has stopped.
Now “Climate” Pete will emit more nonsense, explaining why empirical evidence doesn’t count. Maybe he’ll claim that the heat is “hiding” somewhere. Or something. Whatever the current alarmist talking points are.
Anything, except admitting that the CO2=CAGW conjecture has been thoroughly debunked by the only Authority that matters: Planet Earth.
dbstealey said :
Jeremy Grantham does not supply the science, and would not pretend to be a scientist. He supplies some of the funding. He is a businessman.
The science comes from climate experts such as my friend Jo Haigh who is one of the two co-directors. She has impeccable climate science qualifications, including a spell as president of the Royal Meteorological Society of which she is now a vice president. She is also a Fellow of the Royal Society which means her contribution has been recognised outside climate science circles as well as inside. http://en.wikipedia.org/wiki/Joanna_Haigh.
And the key point about climate scientists of such an era is that they did a lot of very good but unpopularised work in the1970’s and 80’s, when the field was a quiet backwater for dedicated researchers who wanted only to find out as much as possible as to how the atmosphere, climate and weather worked. The US conservative politicisation of climate science came later, once Mann had published the Hockey Stick paper in 1998.
Manabe and Strickler’s 1964 paper – http://www.gfdl.noaa.gov/bibliography/related_files/sm6401.pdf – provided a very good working calculation of the atmosphere temperatures with height and showed you could only get it right if you take into account both greenhouse effects and surface heat convection (which stops at the tropopause). Since this was pre-conservative politicisition of the area, the basic greenhouse gas theory was established and confirmed before IPCC, Michael Mann or Heartland Institute. And such a solid base of climate science is still not understood by guys such as you, yet contains just about all the theory and information needed to refute your claims above. And it is old old old.
If it’s gone deep it’s not coming out ’til the surface cools; if it’s been re-radiated, it’s gone. In either case, no catastrophe, except for cooling ones.
I’m happy to accept the mild warming of AGW which seems to be the expression of all of the physics, known and unknown, and of course, the great greening.
Why can’t you accept it and glory in it? Is it fear? Guilt? Surely not greed or lust for power, I would not so suggest, though surely there are some with those weaknesses.
Increasing carbon dioxide is a boon to the whole biome. It is possibly the most necessary substance on Earth that the Earth is incapable of sustaining an adequate atmospheric concentration for. And you would try to abolish and and derogate it as pollution. Kiddo, that’s sick.
========
Heh, betcha Grantham doesn’t mistake his greed and lust for power for a weakness. You are the sort he needs to point that out to him. Are you up for it?
============
Pete,
CACCA was born politicized, by the same pro-communist crew as “Nuclear Winter”.
‘Climate’ Pete says:
Jeremy Grantham does not supply the science, and would not pretend to be a scientist. He supplies some of the funding to promote the alarmist narrative.
There. ^Fixed it^ for you. Grantham cares nothing about science, or he would be a skeptic.
Next, you say M&S “get it right”. That’s utter nonsense. No one was able to predict the current 12 – 18 year long stasis in global T. No one ‘got it right’.
Finally, your comment “pre-conservative politicisition of the area, the basic greenhouse gas theory was established and confirmed before IPCC, Michael Mann or Heartland Institute” makes you a parody of the wild-eyed alarmist nuts that occasionally show up here. You mntioned Heartland, but you forgot the Koch Brothers. You’re slipping.
But you did manage to throw in: US conservative politicisation of climate science came later, once Mann had published the Hockey Stick paper in 1998.
Are you that clueless? MBH97/98 were fatally flawed. The IPCC can no longer publish Mann’s original ‘Hokey Stick’ chart. There aren’t many journals that force the author to publish a Corregendum admitting his methodology was nonsense, but Michael Mann made the cut. And you can bet that if anyone else but Mann himself had written the correction, it would have been much worse, and more to the point. Now, would you like to discuss Mann’s Tiljander proxy?
The fact that you have dragged politics into a science discussion says it all. This is politics to you.
Finally, you cite your pal as having “impeccable credentials”. In the UK it is who you know over what you know. Name someone who was president of the Royal Meteorological Society in the past couple of decades who got there based on merit, and not on who they knew. Contrast that with the recent head of M.I.T.’s atmospheric sciences department, who has published twenty dozen peer reviewed papers on the climate — and who rejects your bogus climate alarmism politcs.
You stray into politics because you have decisively lost the scientific argument. You cannot even quantify AGW, yet you write as if it is an established fact. I have repeatedly challenged you to post testable, verifiable measurements, explicitly quantifying the fraction of global warming attributable to human emissions. You avoid that like the plague, for the simple reason that no one has ever produced such measurements.
And without measurements, your entire CO2=CAGW conjecture is nothing more than an opinion.
Climate Pete, this is a site for scientific skeptics. Skeptics are the only honest kind of scientists. But I haven’t see one word of skepticism from you about your “dangerous man-made global warming” beliefs since you started posting. As Prof Richard Feynman warned: you are the easiest person to fool.
But maybe you want to fool yourself because the alternative is terrifying to you: you would find out that your cherished belief system is built not on testable science, but on a political narrative.
Either that, or you’re on Grantham’s payroll. Oh, well. It pays the bills, right?
So, knowing his agenda, do you:
1) Tell him there are no measurements of AGW, thus it is an unproven conjecture
2) Sell your soul
Philip Finck,
Doesn’t it seem strange to you that the IPCC — which absolutely LOVED Mann’s original chart — no longer uses it?
Mann’s chart was arresting. It was perfect for its intended use: alarming the public. There has never been a better, more effective visual tool available to the IPCC. But they stopped using it.
Why would they cease publishing it? Now, they use much inferior spaghetti charts which are merely confusing, and not nearly as scary.
If you’ve followed the Mann saga at all, you know the answer: Mann’s chart was based on bogus proxies. Mann has an M.O. on that. He cherry-picks his proxies, and rejects those that don’t support his agenda. Often, he rejects the majority of available proxies.
Take Mann’s Tiljander proxy. Ms. Tiljander informed him before he published that she had discovered that the lake sediments had been overturned due to construction decades before, thus as a climate proxy they were no good. But Mann used them anyway because the upside-down, corrupted proxy gave him the hockey stick shape he craved.
That’s your HE-RO. The guy has no ethics, which is typical of the clique of climate alarmist of scientists that Mann leads. Mann also controls the climate peer review system, as proven in the Climategate emails. But you try to defend a reporobate like that. Why?
Perfect example of the corruption. MBH 98&99 should have long since been retracted. So called subsequent confirmatory studies need either split bark bristlecone or upside down varves to demonstrate the hockey stick.
Look at this closely, pal; you should be appalled.
==============
What I thought was particularly smooth and subtle was the way he presented one series with split bark, and another with flipped varves, but none with neither. Quite deliberate. Now, you deliberate.
He stumbled over a crook’t stick of credulousness which is now whackin’ the both of ye.
====================
Deliberatin’ ain’t in it for you, huh? Better to dreamily bloviate the consensus agenda and chew your well deserved cud.
=================
dbstealey
Here are the result from the Moyhu interactive temperature viewer
http://www.moyhu.blogspot.com.au/p/temperature-trend-viewer.html
which is kept up to data by Nick Stokes. The Wood for Trees viewer seems to have no further development on it and is missing the BEST land and ocean data and the new UAH 6 data set (which dbstealey no doubt was hoping would give lower 20 year trends than the old one).
All 20 year land and ocean trends from April 1995 to April 2015
UAH6 beta – 0.232°C/Century; CI from -0.764 to 1.227
RSS – 0.272°C/Century; CI from -0.660 to 1.204;
Cowtan & Way with kriging -1.456°C/Century; CI from 0.931 to 1.981;
GISTemp – 1.205°C/Century; CI from 0.713 to 1.697;
BEST – 1.246°C/Century; CI from 0.705 to 1.786;
HadCRUT4 – 1.129°C/Century; CI from 0.580 to 1.678; (but this is incomplete and should be replaced by C&W kriging or hybrid).
All the datasets show an average warming trend. The satellite dataset confidence intervals span zero, but the upper confidence limits are 1.227 and 1.204, so they do not exclude a warming trend of more than 1 degrees C per century. Bear in mind that the lower tropospheric temperature from the satellites covers a significant band of heights, so is not the same reading as the surface temperature. It is the surface temperature which causes problems for humans with AGW.
Meanwhile all the average trend values for the surface temperature datasets are all above 1 degree C per century, and the confidence intervals fall within the confidence intervals of the satellite datasets.
This is the skeptical scientist picture – look at all the evidence and reach a conclusion. And the conclusion from it is that 20 year warming is highly likely. Because this is what the overall picture of trends is telling us. We can even say that there is about 1/3 chance that there has been no warming or cooling just in the two satellite datasets alone, because zero trend comes about 1/2 sigma into the confidence interval.
By contrast DBStealey would ignore all but the RSS dataset and still try to claim no warming over 20 years. This is a case where the conclusion came first and the justification comes second, and includes a great deal of cherry picking about which data and bounds are regarded as sound and which are not. It smacks very much of bias rather than scientific skepticism.
dbstealey said
The corrigendum related only the MBH98 supplementary material. What did the corrigendum have to say about the actual paper and results?
“dbstealey said
The corrigendum related only the MBH98 supplementary material. What did the corrigendum have to say about the actual paper and results? ?w=700
“None of these errors affect our previously published results (1)”
http://www.meteo.psu.edu/holocene/public_html/shared/articles/MBH98-corrigendum04.pdf
where (1) points to MBH98.
Add to that that dbstealey has never even admitted that Mann’s results were confirmed by later studies. A true skeptic would have noted that for all to see and, if still convinced MBH was flawed would have explained why. In fact a good scientists would have written a paper explaining the flaw and what the correct results are, then submitted it for publication. The fact there is no such paper published says that Mann’s results should stand, since they have been corroborated.
The lack of noting confirmatory later results for MBH98 proves that dbstealey is not a skeptical scientist – just biased.
Now there is yet another piece of disinformation come to light. dbstealey says the IPCC AR5 no longer can publish Mann’s hockey stick graph.
Of course they would not be publishing the original any more because the results have been corroborated and enhanced by others, so a better chart is what they should be publishing. And here it is, straight from the AR5 WG1 Technical Summary paper.
http://www.ipcc.ch/report/graphics/index.php?t=Assessment%20Reports&r=AR5%20-%20WG1&f=Technical%20Summary
And now we come to the infamous chart discussed above.
The question dbstealey has to answer to retain any credibility with the audience here is :-
“Did he know when he claimed it showed cooling, that, in fact, it showed warming? Or did he want it to show cooling, so therefore assumed it did, without checking?”
My money is on the second on this. The first is too risky.
Now, since I had already put up the NOAA chart showing heat going into the oceans up to 2000m, the correct thing for a true skeptic would have been to look for a third source of information before making up his mind on ocean cooling. Does he do this? No he doesn’t. He just ignores the NOAA chart because it does not say what he wants it to say, and goes solely with his chart. Big mistake in this case.
So that is yet another piece of information that dbstealey is not a skeptical scientists, but just shows bias – failure to look at the evidence is not a sign of a true skeptic.
Gad, Pete. Belief in the Piltdown Mann’s Crook’t Stick with its inherent myth of attribution is hazardous. It is iconic, and false.
Also, go check out Bob Tisdale’s examination of the latest ocean heat content paper. You might learn a little.
=====================
Climate Pete says:
Add to that that dbstealey has never even admitted that Mann’s results were confirmed by later studies.
Mann falsely attempted to erase the MWP and the LIA. If ‘Climate Pete’ actually believes that those events did not happen, or were “confirmed” by anything in the real world, he’s not only a lunatic, but he contradicts decades of research.
I note that ‘Climate Pete’ also doesn’t dare to try and defend Mann’s use of the upside-down Tilajander proxy. That was so thoroughly bogus and dishonest that Michael Mann’s reputation has never recovered. His colleagues are still snickering behind his back about that one.
‘Climate Pete’ continues to dig his deep hole even deeper, trying to ‘explain’ why the IPCC has stopped publishing Mann’s discredited chart:
Of course they would not be publishing the original any more because…&blah, blah, etc.
I fully explained what happened in my comment above: 5/24 @4:54 pm. The IPCC LOVED Mann’s chart, repeatedly publishing it. Then when it was debunked, they suddenly stopped using it.
I am embarrassed when someone makes a major fool out of himself. ‘Climate Pete’ should at least argue things that are disputable to some degree. The fact that the IPCC cannot use Mann’s chart any more is such a weak argument that it puts ‘Climate Pete’ into the ‘Seekers’ category explained by Leon Festinger.
p.s. A better link for the very large multiple hockey stick image AR5 is
http://www.ipcc.ch/report/graphics/images/Assessment%20Reports/AR5%20-%20WG1/Technical%20Summary/FigBoxTS.5-1.jpg
One of my favorite jokes with moshe is that I tell him that once upon a time I had this whole climate thing figured out, but have since forgotten, so you have to read the blogs. You have a decade of Climate Audit to catch up with.
It’s destruction, in massive detail, of the hockey sticks; it’s a shambles.
========================
kim,
If ‘Climate Pete’ ever read Climate Audit, his head would explode from cognitive dissonance.
Well, Philip, you might, but I mightn’t. I’ll regard your suggestion as a gesture of goodwill, though misplaced. Now, a return gesture; read McIntyre.
==============
Where is Dr. Manns “Hockey Stick” coverage for the SOUTHERN Hemisphere?
LOL!!!
The recent weblog post, and comments, at And Then There’s Physics [ATTP]
https://andthentheresphysics.wordpress.com/2015/05/20/watt-about-rogers-questions/#comment-56471
illustrates a remarkable lack of understanding of the alternative approach we have proposed to diagnose and monitor global warming.
Our approach was presented, for example, at Climate Etc in
http://judithcurry.com/2014/04/28/an-alternative-metric-to-assess-global-warming/
At the end of the set of comments between me and the anonymous weblog host at ATTP, the remarkable statement was made by that person
“I also don’t think that the term forcing in climate science is quite equivalent to a force in physics.”
https://andthentheresphysics.wordpress.com/2015/05/20/watt-about-rogers-questions/#comment-56598
The piling on of the lack of understanding of the physics (and the vitriol) by commenters on ATTP, including the host, accelerated towards the end of the exchange of comments (and continues after I left it). Gavin Schmidt presented the first comment (which avoided answering the question posed, then promptly disappeared from the debate). As with the weblog Skeptical Science, these weblogs are simple partisan attack websites with a veneer of science.
The host of ATTP hides behind being anonymous to hurl personal attacks. For a short time I thought perhaps the climate tribal wars were not going to occur at ATTP. However, I was wrong. I am going to forgo going back onto that poorly run, biased weblog.
On WUWT in this comment, however, I want make it very clear and document what is meant in physics by the term “radiative forcing” and how we have used that fundamental concept in proposing our alternative approach to assess global warming.
The IPCC defines the most fundamental form of radiative forcing (RF), in a form they do NOT use, as
“Alternative definitions of RF have been developed, each with its own advantages and limitations. The instantaneous RF refers to an instantaneous change in net (down minus up) radiative flux (shortwave plus longwave; in W m–2) due to an imposed change. “
[https://www.ipcc.ch/pdf/assessment -report/ar5/wg1/WG1AR5_Chapter08_FINAL.pdf
That is the definition that we used.
However, the IPCC has adopted a variant which is
“In both the Third Assessment Report (TAR) and AR4, the term radiative forcing (RF, also called stratospherically adjusted RF, as distinct from instantaneous RF) was defined as the change in net irradiance at the tropopause after allowing for stratospheric temperatures to readjust to radiative equilibrium, while holding surface and tropospheric temperatures and state variables such as water vapour and cloud cover fixed at the unperturbed values . RF is generally more indicative of the surface and tropospheric temperature responses than instantaneous RF, especially for agents such as carbon dioxide (CO2) or ozone (O3) change that substantially alter stratospheric temperatures. To be consistent with TAR and AR4, RF is hereafter taken to mean the stratospherically adjusted RF.”
They adopt this approach because the
“Instantaneous RF or RF is not an accurate indicator of the temperature response for all forcing agents…”
There is a lot more discussion of this subject in the IPCC report. However, a clear distinction exists between what we have proposed and what the IPCC uses, which was ignored at ATTP.
At ATTP they apparently are deliberately obfuscating or they really do not understand basic physics regarding this distinction. In past exchanges with Gavin Schmidt, he seemed to understand the distinction, but than just ignored any value to what we are proposing. His comment at ATTP shows he continues to ignore the issue we have raised.
Our approach assesses the global top-of-the-atmosphere space-time integrated instantaneous RF which is the appropriate one to use in our radiative imbalance assessment. When we use the ocean heat stage to assess the top of the atmosphere (TOA) radiative fluxes, it is, of course, correct there is a lag if we are assessing the top of the atmosphere radiative fluxes based on the ocean heat content changes. We essentially eliminate this concern by averaging over space and over time periods (months to years and longer).
Also, in our estimates for the global average radiative forcings and feedbacks, we used the IPCC and related estimates [even with their different definition], as we are not aware of any other estimates. The space-time averaged instantaneous (for each time step in the models) radiative forcings and feedbacks can be extracted from the climate models, of course, but despite requests in the past from GISS, this was never provided. Gavin just tells me I should obtain them myself from their archived data [which would be fine if I were funded by someone to do this].
Our approach is described in the paper
Pielke Sr., R.A., 2003: Heat storage within the Earth system. Bull. Amer. Meteor. Soc., 84, 331-335. https://pielkeclimatesci.files.wordpress.com/2009/10/r-247.pdf
which builds on the paper
Ellis et al. 1978: The annual variation in the global heat balance of the Earth. J. Geophys. Res., 83, 1958-1962. http://pielkeclimatesci.files.wordpress.com/2010/12/ellis-et-al-jgr-1978.pdf
See also
Pielke Sr., R.A., 2008: A broader view of the role of humans in the climate system. Physics Today, 61, Vol. 11, 54-55. http://pielkeclimatesci.wordpress.com/files/2009/10/r-334.pdf
See also
Douglass and Knox, 2013: Ocean heat content and Earthʼs radiation imbalance. II. Relation to climate shifts. Physics Letters A Volume 376, Issue 14, 5 March 2012, Pages 1226–1229. http://www.sciencedirect.com/science/article/pii/S0375960112001600
Finally, as to where the questions are going with respect to ATTP and Gavin, they apparently find them too inconvenient.
ATTP wrote
“I can see no reason why Gavin would spend any time answering the questions. They’re – in my opinion – almost certainly not asked in good faith.”
https://andthentheresphysics.wordpress.com/2015/05/20/watt-about-rogers-questions/#comment-56749
In other words, they do not really want to have an honest scientific discussion on the issues I have raised. Such is the sad state of climate science.
[Thank you. .mod]
Stonewalling has worked so well and so long for them that they can’t see the mortar dissolving between the rocks, and the rocks turning spongiform. It’s sad and troubling. What will become of them?
===================
ATTP is not anonymous. He’s Ken Rice of the Royal Observatory in Edinburgh.
It was my sad task to inform the pore fella that he lived in a world without consensus enforcers.
==============
dbstealey misquotes
Pete, when you defend the indefensible, that is Mann’s Hockey Stick, you ruin your credibility elsewhere. Besides, you’ve been far less than definitive about ocean heat content. Enjoy your illusion of knowledge; I’d hate to ruin your pastoral dream.
=================
Go read Tisdale on Lee et al, and weep, if you’re able.
============
Saying that MBH 1998 is wrong is a fashionable meme among those who would rather AGW was not a fact. However, that does not mean the criticism is justified.
As far as I can see, the history is that Mann publishes in 1998. McItrick does an analysis in 2003 to see if he can cast any doubt on it and he and McIntyre make various derogatory comments on it, complaining that the PCA (principal component analysis) is not correct. Eventually in 2003 they get something published in “Energy and Environment” – the contrarians favourite journal.
Picking up from http://en.wikipedia.org/wiki/Hockey_stick_controversy
It turns out had McKitrick used a different convention with the same processing of the data then he would have obtained the same results as Mann.
Of all the various accusations and rebuttals, the one carrying the most weight with me is the NRC report because it “consisted of 12 scientists and statisticians from different disciplines” and “went through a rigorous review process involving 15 independent experts.”
Now, sure, the culture here is to disbelieve MBH98. However, the weight of the evidence is that the conclusions of MBH98 are generally sound.
To disbelieve MBH98 means you are putting your faith in two specific guys with whose views you happen to agree with, rather than a plethora of expert climate scientists and independent experts. It is a strange conclusion to come to for anyone who would claim to be a skeptical scientist.
Hah, hah, ‘last four centuries’. Keep your faith, fella; it’s misplaced.
==========
Er, ‘preceding four centuries’. If I weren’t laughing so hard I could pull you out of the hole you’ve thrown yourself into.
=====
Here’s one you didn’t learn in your restricted schooling: ‘Ignore the millennial scale changes at your perennial’.
===============
What’s not been disclosed yet to you is that Mann’s crook’t stick is extremely poor evidence for attribution. You should be outraged to be so used.
Perhaps you will be someday.
============
Here’s Richard Muller of BEST (I suppose you’ve heard of them, right Pete?) on Mann’s Hokey Schtick.
In an October 2004 Technology Review article, Muller discussed blog postings by McIntyre and McKitrick alleging that Mann, Bradley and Hughes did not do proper principal component analysis (PCA). In the article, Richard Muller stated:
McIntyre and McKitrick obtained part of the program that Mann used, and they found serious problems. Not only does the program not do conventional PCA, but it handles data normalization in a way that can only be described as mistaken.
Now comes the real shocker. This improper normalization procedure tends to emphasize any data that do have the hockey stick shape, and to suppress all data that do not. To demonstrate this effect, McIntyre and McKitrick created some meaningless test data that had, on average, no trends. This method of generating random data is called “Monte Carlo” analysis, after the famous casino, and it is widely used in statistical analysis to test procedures. When McIntyre and McKitrick fed these random data into the Mann procedure, out popped a hockey stick shape!
That discovery hit me like a bombshell, and I suspect it is having the same effect on many others. Suddenly the hockey stick, the poster-child of the global warming community, turns out to be an artifact of poor mathematics. How could it happen?
You quote the ridiculous 97% consensus BS, you desperately cling to ‘pause/hiatus/plateau/etc.’ denial, and clearly you wouldn’t recognise an error bar if you were beaten over the head with it.
You flaunt your shiny little certificate as if you were the only person ever to acquire one and actually seem to believe it gives you the right to pontificate on subjects about which you clearly haven’t a clue, and to patronise posters who actually know what they are talking about.
If your mind was even half open, hell, a quarter open would be a start, you might actually have learned something about climate science. But it wasn’t. And you haven’t.
Sad, really sad.
Climate Pete says:
It turns out had McKitrick used a different convention…&blah, blah, etc.
Here’s a ‘convention’ for you: Dr. McKitrick has never been forced to publish a Corrigendum like Mann was.
Citing Wikipedia is like citing Mann himself. It’s a complete waste of time for anyone wanting to understand what Mann really did. And of course, Mann hides out in his ivory tower. He doesn’t have the cojones to come down and meet with his critics. But in science, addressing your critics’ concerns is a necessary part of the process.
Michael Mann is what is known as a “charlatan”. He used unreplicable hocus-pocus to come up with fantastic results that no one else can reproduce by using the available proxies.
‘Climate Pete’ says:
Saying that MBH 1998 is wrong is a fashionable meme…&etc.
Mann cherry-picked only those proxies that supported his fake chart, while hiding all the rest. For example, Mann buried the biggest number of proxies in an ftp file labeled “censored“.
If Mann had used the available proxies, there would have been no ‘hockey stick’ shape in his fabricated chart. So he played games, because he wanted to show something that wasn’t there.
That isn’t science. That’s cherry-picking the data to arrive at a conclusion that Mann already decided that he wanted. And to this day, Mann has never released all his data, methods, metadata and methodologies to other scientists requesting them.
That’s not what a scientist does, that’s what a charlatan does.
Climate Pete says:
Grantham Institute exists to promote the conclusions of mainstream climate science, confirmed by 97% of the climate expert.
Why read any more? If CP actually believes that nonsense, it isn’t worth reading the rest of his nonsense.
I advise “Pete” to do a simple archive search here, keyword: “97%”. He will find out right quick that the things he believes are thoroughly debunked idiocy of the first order.
Even asking anyone with common sense if “97%” of a large group believe in one specific thing will give Pete his answer: try asking a thousand Italians if the Pope is Catholic, and you will not get 97% to agree.
Pete is a religious True Believer. Michael Mann himself could have an epiphany, and tell ‘Climate Pete’ that his Hokey Stick graph was wrong. It wouldn’t matter to ‘Climate Pete’.
Dr. Leon Festinger provides the answer of why people like ‘Climate Pete’ believe in what have turned out to be nutty ideas. When Mrs. Keech’s ‘Seekers’ had sold all their worldly possessions, and were awaiting the imminent arrival of the flying saucer that would take them to safety while the world was destroyed, what happened when the flying saucer didn’t appear?
They didn’t admit they were wrong, or had been bamboozled. Instead, they doubled down, becoming even more certain that the flying saucer had been merely delayed. Their beliefs became even stronger.
‘Climate Pete’ fits that template exactly. The earth could plunge into another great Ice Age (which sometimes happens within a decade or two). It would not matter to Climate Pete. He is a True Believer, and as glaciers a mile thick once again descended on Europe and the mid-west U.S., Climate Pete would be making his same ridiculous arguments. Because martyrs will die to be right.
The plain fact is that the man-made global warming scare has turned out to be 100% wrong. It didn’t happen, it is not happening now, and there is zero indication that it will happen. Climate Pete has staked out his position, and he’s ready to be a martyr to the cause, no matter how silly he looks to the rest of us.
Climate Pete,
Regarding your earlier screed, I didn’t ‘misquote’ anything. I explained that I changed the quote to make it more honest. But if there’s anything that matters to you less than honesty, I don’t know what it could be. Next, you say:
The main reason you do not get more dissenters from the views propagated on WUWT are that they are hardly made to feel very welcome, as your diatribe above demonstrates.
Wrong, as usual. We don’t get very many ‘dissenters’ here because the true consensus (for whatever that’s worth in science) is heavily on the side of skeptics of man-made global warming (MMGW).
You are one of just a handful: part of a self-serving clique who benefits from Grantham’s loot. Don’t try to deny it, he funnels money to organizations that employ propagandists like you.
Also, you get to comment here. On the majority of alarmist blogs I and many others are censored out. So whining about being one of the only ones trying to defend a conjecture that is being falsified every day by Planet Earth just makes you look silly and impotent.
Finally, you advise us to sell our souls like you did, and suck up the MOOC propaganda. Why would we want to hear only one side of any debate?? Only fools and religious True Believers want to do that. Scientific skeptics want to hear all sides of a debate. That’s how we sift the truth from the propaganda.
Your mind is made up and closed tight, there’s no doubt about that. You post reams of cherry-picked factoids that feed your confirmation bias, but you disregard everything else — including the central fact that there is no global warming, as was predicted incessantly by people like you. You were all flat wrong. And now you are even preposterously trying to claim that global warming is continuing as always! Truly, you exist in your own bubble of misinformation.
Please keep posting, Pete. Your nonsense is so easy to debunk that anyone can do it with half a brain. That keeps it fair, no?
Well he’s not that bad, but he’s got some amazing blind spots. A little more seasoning in the minors and he may be ready for the bigtime. Clue, fella. Lose Mann, understand Tisdale.
=============
Kim, Tisdale does some good stuff on ENSO here, but that’s all.
Did you see his take on Lee et al(2015) over at Watts Up? Oops, that’s here, heh.
Do you understand what the clouds did?
==============
dbstealey appears to be reverting to talk of “belief” and “religion” rather than addressing the substantive science.
He is even accusing me of being lying about being paid by the Grantham Institute!!!
There’s one standard response of guys like dbstealey – someone comes up with something that doesn’t fit his ideas so what does he do? Answer, categorise that person as part of an organised climate science conspiracy theory (which if it were to exist would have to be the biggest, best organised, most tightly-knit and most secretive conspiracy ever! And my part in it is to take money from the Grantham Institute, apparently.
So, dbstealey, you claim you are a skeptic, and therefore evidence driven. What evidence do you have that I am paid by the Grantham Institute?
Making accusations on the basis of no evidence is not what skeptic or skeptical scientists do.
Most of the rest of your last two posts would be better delivered from a pulpit.
And lastly he says
Logical fallacy here – false dichotomy – that investigating the case from one side prevents you from continuing to look at the case for the other side .
If you were a true science skeptic then you would wish to examine both sides of the debate, and taking a formal course such as a MOOC in atmospheric physics would be a natural part of that. My education and information exposure includes trips into WUWT and formal education on mainstream atmospheric physics and climate science topics.
So if you want to hear all sides of the debate then you need to hear the other side, and this does not stop you from listening to the side you are also on. In the meantime, you have no case for calling yourself unbiased or a skeptical scientist because you have just said you are not willing to expose yourself to education from the other side.
My intense suspicion is that you do not wish to expose yourself to formal education in atmospheric physics or climate science because it will undermine your current belief set – you are scared. Whereas I am here and engaged with the contrarians like you on this site. And that is the difference between us.
You are not behaving as you would describe a skeptical scientist should.
Climate Pete says that I’m…
…accusing me of being lying about being paid by the Grantham Institute!!!
Pete, before your head explodes, pay attention to what I wrote: I said that you benefit from Grantham’s largesse. And you do. Whether it’s directly, or indirectly through the organizations you inhabit.
Then you say I’ve accused you of being “part of an organised climate science conspiracy”.
Heh, it’s all in your fevered imagination, Pete. I never said that, either. What you’re doing is fabricating things I never said, and then arguing with them. That’s called a strawman fallacy, and it’s all you’ve got. You certainly don’t have reality on your side. For sure, you don’t have the necessary data. You’re winging it. You are bluffing.
Everything you wrote above is amusing. Like: If you were a true science skeptic then you would wish to examine both sides of the debate, and taking a formal course such as a MOOC in atmospheric physics…
I don’t need to be spoon-fed your propaganda, Pete. It’s wasted on me; readers learn far more here than in your propaganda course. I am not interested in anything that doesn’t include both sides of the debate, including verifiable facts and evidence — and that’s where you and your gang fall flat on your collective faces. Because you don’t have the necessary data.
Clearly this hasn’t sunk in yet, so try to sit up straight, and pay attention:
In science, DATA IS ESSENTIAL. Measurements are data.
But there are NO verifiable, testable measurements quantifying the fraction of man-made global warming (MMGW) out of total global warming from all sources including natural climate variability.
Do you understand that, Pete? (I ask, because up to now it seems you don’t understand.)
Without verifiable empirical DATA, the entire MMGW scare is just a baseless conjecture. An opinion. Nothing more. Science is not done by assertion, and the CO2=CAGW conjecture is nothing more than a data-free assertion.
Your entire argument — in fact, your entire Belief system — is based on a mere OPINION! Now tell us: how is that any different from a religion?
Finally, you say:
There’s one standard response of guys like dbstealey…
There is only one credible response, Pete, and it is this: produce empirical, testable measurements quantifying the fraction of total global warming that you believe is caused by human CO2 emissions.
If you can do that, you will be the first, and I will man up and concede that you win the argument, and the whole debate.
But if you cannot produce those empirical measurements, then you lose the debate. Because all you’re doing is emitting a data-free assertion: claiming that human CO2 emissions cause dangerous global warming. But without verifiable data quantifying MMGW, you deserve to lose because you’re fooling no one here.
Best get started finding those real world measurements, Pete. Finding them is the only way you can rescue any credibility.
dbstealey,
It’s not clear that you even understand that there are two sides to the picture. Certainly you appear to have outright ignored without acknowledgement all evidence which challenges your beliefs.
You certainly make some very dogmatic statements, don’t you. I put up evidence and you ignore it and claim I have submitted no evidence.
So let us do an exercise. All you have to do is answer a few simple questions, for which the answers are in the thread above
Q1. What, in your view, do I (Climatepete) believe the two strongest pieces of evidence for warming since 1998 are?
Q2. What one piece of evidence do I believe best represents the different human and natural contribution to warming?
Q3. And what supporting paper do I link to, to show that at least two locations in the world support the major finding of the piece of evidence in Q2?
Let’s see whether you have actually been reading anything I said.
Do you understand what the clouds did?
==============
Climate Pete is assigning me homework!
heh ☺
Oh, I know. I wouldn’t mind but he’s neglecting what I’ve assigned him. I wish him a magic cloud ride.
========
OK, let’s do this the easy way
Let us use a single chart to estimate the radiative forcing from 1998 to 2012, a period where DBStealey says there was no warming.
Here’s the chart :
http://d35brb9zkkbdsd.cloudfront.net/wp-content/uploads/2015/05/heat_content2000m.jpg
We are going to use the blue line which is the 5-year average line, mainly because it is clear and present for the time periods we are talking about. So the final point on the chart is for 2012 which represents the average for the five years between 2010 and 2014.
The figure for OHC in 1998 was 6 x 10^22 J. The figure for OHC in 2012 was 18 x 10^22J. The difference between these two figures is 12 x 10^22 J. (If we took the red line for the end of 2014 which stood at 23.5 x 10^22 J then we would get a bigger answer out of the calculation, but we are not going to do this).
The earth’s area is 510 million square miles or 5.1 x 10^14 square metres.
There are approximately 31 million seconds in a year, so in 14 years there are 430 million seconds approximately.
So, if it is all going into the oceans, the average accumulation of heat over the whole earth in that time is
12 x 10^22 / (5.1 x 10^14 x 4.3 x 10^8) = 12 / (5.1 x 4.3) = 0.55 Watts per square metre.
Since this is not zero, then it is clear from the OHC figures that there has been warming between 1998 and 2012. Whether the figure should be higher because more heat was being stored below 2km we don’t know.
Therefore the inescapable conclusion is that global warming continued between 998 and 2012 at the rate of at least 0.55 Watts per square metre.
QED
And that is the basic evidence that dbstealey keep demanding, presented in the simplest way I can think of.
‘Climate’ Pete:
Posts a chart that he says will …estimate the radiative forcing….
Pete, what will it take to get you to pay attention? ‘Estimating’ something is not data.
In science, data is essential. How many times do I have to repeat that? It hasn’t sunk in yet, so you may never understand. Everyone else understands. But you don’t. Why not?
Data is essential, and measurements are data. But you have produced no measurements of man-made global warming (MMGW). And here you only posted a screed estimating radiative forcing. Furthermore, you call it “evidence”. It’s not what we need. We need data. That means measurements. But you have no testable measurements quantifying the fraction of MMGW you claim exists. You are just winging it. <–Planet Earth agrees.
If you cannot produce empirical, testable measurements quantifying MMGW, then everything you’re arguing about is no more than your opinion. A data-free conjecture.
Without measurements you’ve got nothing. QED
Very disappointed that you haven’t added to your understanding of the reason for that temp rise. I gave you so many clues.
Very disgusted that you’d assume that any missing heat is below 2km.
Jordanesqe, you may dribble and shoot magnificently, but you ain’t hittin’ the ball.
=============
DBStealey is now trying to redefine words to suit his own biased conclusions.
My “estimate” is in fact a calculation from the data, as he could see full well for himself if he wasn’t blind.
If you want to be nit picking about it, which you so clearly do, then..
The calculation of radiative forcing from the graph of data from the ARGO floats shows that between 1998 and 2012 the radiative forcing was at least 0.55 W/m^2.
Climate Pete, wake up:
http://www.washingtonpost.com/blogs/capital-weather-gang/files/2014/06/newchart.jpg
Global warming has STOPPED.
All your long rants are just a diversion from reality. It is you who is trying to redefine words to suit your own biased conclusions.
Your endless tap-dancing is just deflection. The man-made global warming scare has been debunked. You just cannot accept that fact, because your mind is closed to what’s happening in the real world.
Kim,
The calculation from the ARGO data completely falsifies the theory that there has been no warming since 1998.
Understand that and you will have come a long way.
Levitus et. al. is not data. Its a reanalysis. A reanalysis is a data initiated model it is not data. Reanalysis can be useful for infilling missing data with model estimates but it is not data.
Warmmoner scientists know that reanalysis is not data but they will carefully parse their words so ignorant people such as yourself who don’t know what reanalysis is will confuse it with real data.
Ok…um…you DO realize that your Global Ocean Heat Content measurement of from 0-2000 Meters involves a VOLUME calculation per heat joule that is much different from a surface area heat/joule calculation right?
You ran your global warming calculation as if the ocean is “flat” and all of it’s heat is contained in the “surface area” that is part of your statement that “Earth’s area is 510 million square miles”.
ARGO data:
http://www.friendsofscience.org/assets/documents/FOS%20Essay/Argo_Heat_Content.jpg
More ARGO data:
http://icecap.us/images/uploads/argodata.jpg
http://tumetuestumefaisdubien1.sweb.cz/ARGO-sea-temperature-max-max.PNG
Climate Pete, understand that and you will have come a long way…
…but I’m not hopeful.
Well, I’m waiting for him to tell me Tisdale doesn’t talk about clouds.
==============
http://d35brb9zkkbdsd.cloudfront.net/wp-content/uploads/2015/05/heat_content2000m.jpg
This shows at least 0.55 W/m^2 is entering the earth system.and is being stored 0-2000m in the oceans. That is warming as climate scientists and all true scientists understand it.
Throwing irrelevant graphs out at random does not affect this fact. If you can’t tell the difference between what is relevant and what is not you shouldn’t pretend to understand science.
The sea surface is defined as between zero and up to 20 metres deep. That is 1% of the ARGO float depth ranges, so the heat from the surface is almost irrelevant to working out how much heat is going into the ocean.
And surface temperatures (aland or ocean) are just a reflection of where the warming is going – they do not define the warming. The warming is defined by the energy entering the earth system. Which has been at least 0.55 W/m^2 from 1998 through 2012.
The worry is what happens when a larger fraction of the new net heat entering at the top of the atmosphere starts to go into surface warming instead of into OHC. You might feel reassured that this fraction has been lower recently, but there is not indication at all that it will remain low as the long-term average is much higher than at present.
OK, 2X4 time. Pete? Ya see that cloud up there?
============
Pete the True Believer says:
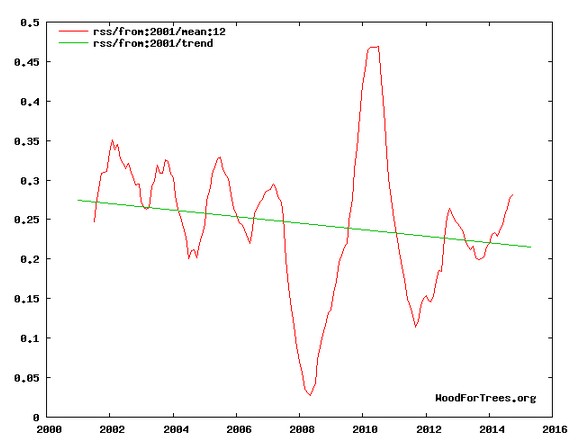
This shows at least 0.55 W/m^2 is entering the earth system.and is being stored 0-2000m in the oceans. That is warming as climate scientists and all true scientists understand it.
‘Climate Pete’ hasn’t been right yet. ‘True scientists’ understand that the trend shows whether there is warming or cooling.
“Warming” is determined not by assertions like Pete’s, but by the temperature trend recorded by thermometer equivalents. Pete doesn’t understand that. He claims there is warming in the oceans based on ARGO data — even after I posted several charts of ARGO data showing that is flat wrong.
Next, government entities like GISS, NOAA and USHCN “adjust” their data:
Interestingly, almost every “adjustment” ends up showing more warming than the raw data shows.
‘Climate Pete’ has been doing a lot of tap-dancing, trying to claim that his “calculations” show global warming. But the only thing that matters is the temperature trend:
He also seems to not understand that “radiative forcing” takes place between the atmosphere and the surface of the planet and the ocean’s surface layers, and not between the atmosphere and great ocean depths.
http://www.21stcenturysciencetech.com/articles/ocean.html
TNX for the diagnosis. I was mopping up his diaphoresis, but didn’t see so clearly the morbid causes.
=======
Radiative forcing is normally defined as the difference at the top of the atmosphere between the incoming solar radiation (which is virtually all the incoming) and the total outgoing radiation which is a mixture of the high-energy solar wavelengths and lower energy infra-red wavelengths.
So, the sun is sending in more radiation than the Earth is sending back into space. Which according to the laws of physics means that the Earth system is out of balance with the Sun, and has some warming up to do, in order to catch up with the Sun’s incoming energy. And, according to the laws of physics, as the Earth systems temperature rises, the amount of energy that Earth radiates back out to space will increase too. That’s not so hard to understand is it?
Most of the energy from radiative forcing (the net energy coming in at the top of the atmosphere) will generally go mainly into ocean warming, which is just as well. If any significant fraction of it went into surface warming we would all fry pretty quick.
Wanted vaunted homiliettes, will settle for scramblied yeggs. You make yokes of words.
lol!