Guest essay by Mike Jonas
In January 2012, my article “Peak Oil – the R/P Ratio re-visited” was posted on WUWT. 3 years on, maybe this ever-controversial subject is worth (re-)re-visiting.
In 2012, I said that it was getting ever more difficult to increase production, and that I suspected that we were already at or close to Peak Oil, but that it was still mathematically possible that Peak Oil was many years away. Do I still think that? In a way, yes, but … well, read on …
In this article, I look at the major factors affecting oil supply, look at past oil market behaviour and how the future may develop, see what lessons can be learned from Hubbert’s Peak, and speculate on when Peak Oil will occur and what it may feel like.
Some of the controversy generated by the 2012 article came from different interpretations of “Peak Oil”, so this time, I will start with the definition and a bit more background.
Definition of “Peak Oil”
The definition I am using is simply :When the rate of oil production reaches its maximum.
Please note:
· In this definition:
Peak Oil is not : “when we run out of oil“.
This is not a useful definition, because we’re not going to wake up one morning and find that yesterday’s oil has all gone.
Peak Oil is not : “when we can’t increase the rate of oil production“.
This isn’t very useful either, because “can’t” is always open to argument.
· The period over which the maximum is determined is not specified, so this still isn’t a precise definition. Certainly, any period less than a year is irrelevant. We very likely won’t know when it was until several years afterwards.
· The reason for oil production reaching its maximum is not specified, and possible reasons will be discussed below.
· I am not talking about fossil fuels generally, and I am not talking about oil and gas. I am talking specifically about oil. That does include gas liquids and “unconventional” oil, but not biofuel. (“Unconventional” oil is described later.) s` qA
· Peak Oil is not necessarily a disaster, it could even be a positive. This also will be discussed below.
One idea which surely is not open to argument is the fact that oil production will peak. Here is a long term graph of past and predicted future fossil fuel production – peak production rate is defined as 1, and the red star represents where we are now (or were recently):

Figure 1. World Total Fossil Fuel Consumption, past and predicted – the long view. [1]
Even if those future estimates are very inaccurate, it is inconceivable that fossil fuel production can keep increasing for thousands of years. The graph for oil must fit inside the graph for fossil fuel.
But predicting Peak Oil has always been an unrewarding exercise. As critics love to point out, various people have predicted Peak Oil for over a century and have been wrong every time.
Factors affecting oil supply
The principal factors affecting oil supply are:
- Geology
- Politics
- Demand
- Price “The solution to high prices is… high prices.” – T. Boone Pickens (h/t John Garrett)
- Technology
Geology is obviously a factor – geology dictates much of where the oilfields are, how much oil is present, its quality, and how difficult it is to extract.
The other factors are all interdependent, so it is arguable how much impact each factor has.
· Many if not most oilfields now belong to nation states, not to oil companies. Consequently many of the decisions affecting oil supply are political. There are also involuntary political impacts such as wars.
· Demand has grown fairly steadily for many decades, due to living standards increasing in developed nations and many other countries accelerating their economic development.
· To the extent that supply is flexible, production tends to be driven by demand.
· Price is the major balancing factor. High oil prices increase the attractiveness of bringing new sources into production, but can also suppress demand. Low oil prices increase the attractiveness of using more, ie, they tend to increase demand, while discouraging high-cost sources of supply.
· Technology is a two-edged sword. Oil production technology has seen tremendous advances since the start of the oil era, allowing ever more oil to be found and produced, thus boosting supply. But technology also helps to make oil use more efficient and other energy sources more competitive, thus reducing demand.
Should I have listed Discovery as a major factor? Maybe I should, but I chose to regard it as a subset of Geology, perhaps with Politics, Demand, Price and Technology as modifying factors.
Hubbert’s Peak
Most people are by now familiar with Hubbert’s Peak. M King Hubbert’s theory [5] says that for any given geographical area, from an individual oil-producing region to the planet as a whole, the rate of petroleum production tends to follow a bell-shaped curve. In 1956, Hubbert famously predicted that US oil production would peak in about 1970. His prediction was remarkably accurate over the next 50 years.

Figure 2. Hubbert 1956 prediction vs US Oil Production . [5]
Predictions that are that accurate over 50 years are quite rare.
For the global bell curve, the upward slope tends to be limited by demand, ie. as much as can be sold at a reasonable price. The downward slope, for regions and fields that have reached it, tends to be limited by geology, ie. the maximum production rate consistent with maintaining reservoir viability. [NB. I’m only referring to general tendency. There are many exceptions of course.]
The overall bell curve is the sum of its components, each of which is a bell curve. Thus a region’s bell curve is the sum of its fields’ bell curves, and each field’s bell curve is the sum of its individual wells’ bell curves. This pattern is demonstrated in, for example:

Figure 3. Historical extraction of crude oil by discovery/field for the Norwegian Continental Shelf (NCS), 1970-2013, plus forecast. [6]
Note that the “bell curves” for the individual fields have a wide variety of shapes. Note also that once a peak has been passed, even a very large field like Johann Sverdrup (Norway’s 4th-largest discovery at 2.9bn barrels) may only produce a brief delay in the decline.
Unconventional Oil
One notable exception is the USA, where very large quantities of “unconventional” oil have recently become viable thanks mainly to technological advances and high oil prices: This surge in “unconventional” oil production can be seen from around 2007 in Figure 4:

Figure 4. USA oil production 1965 to date. [2]
What is “unconventional” oil? A-simple definition is “oil collected by other means than simply drilling for it” [7]. Willis Eschenbach put it differently:
The strange part is, when you open a barrel of unconventional oil to see what conventions were broken in its creation, you find it is indistinguishable from conventional oil. [8]
Both are right, in a sense, but I’ll stick loosely with the “unconventional” idea simply because it’s a useful word for the oil which even under current technology is much more difficult and expensive to produce than the oil we’re used to that satisfied all demand until recently. The definition is loose, but some pictures [9] might help:

Figure 5a. An oil rig blowout in Turkmenistan. The easiest “conventional” oil to produce (with care!) is under pressure.

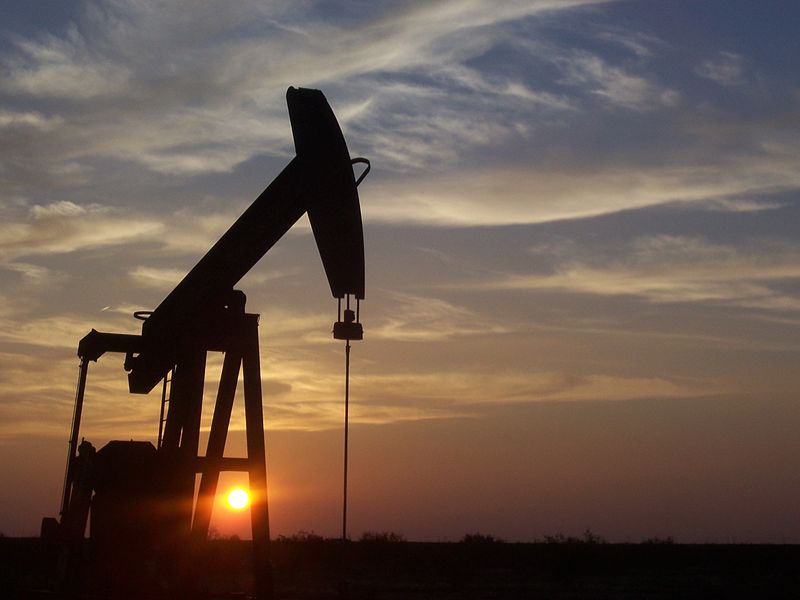
Figure 5b. West Texas pumpjack. Some “conventional” oil has low pressure and has to be pumped out.

Figure 5c. “Unconventional” oil such as the Alberta Tar Sands are currently being mined.
“Unconventional” oil also includes shale oil, which can be drilled for rather than mined, but tends to be in very tight rock formations that are difficult and expensive to produce from, and tends to require techniques such as horizontal drilling and fracking [11].
Past Oil Production
Before I show the graph of past oil production, it will be helpful to show the graph of oil price. It’s from data in BP’s June 2014 report [2], so doesn’t show the recent fall back towards $40.

Figure 6. Oil Price from 1965. [2]
Looking at the first half of the graph –
· The first major disruption in this period occurred in 1973, when OPEC quadrupled the price of oil.
· The second was the Iranian revolution in 1979 and the Iran-Iraq war starting in 1980.
· These disruptions helped to bring on a massive recession in 1981-2, the most significant recession since the Great Depression.
· Reduced demand because of the recession resulted in the oil price fairly quickly returning to “normal”.
In the second half of the graph:-
· For a decade or so after the start of the 21st century, supply struggled to keep up with demand and the oil price went up …
· … apart from a short sharp dip at the time of the GFC.
· Not shown is the recent sharp price decline, caused by surging US “unconventional” oil production and exacerbated by Saudi Arabia’s decision to maintain high production.
But in spite of the economic booms and busts, it is clear that although the oil price has been volatile at times, oil demand and/or supply have been relatively inelastic:

Figure 7 – Oil Production.[2]
Oil Reserves
Oil reserves are very much a function of technology and price. A generally-accepted definition [3] of Reserves, also called Proved Reserves or Proven Reserves, is:
the estimated quantities of oil which geological and engineering data demonstrate with reasonable certainty to be recoverable in future years from known reservoirs under current economic and operating conditions
In my 2012 article, I paid too much attention to proved reserves. That was partly because I was responding to a Willis Eschenbach article about the R/P Ratio (Reserves / Production), but mainly because in my mind I overestimated the importance of Proved Reseserves. What really matters is the Technical Reserve (“TR”, the total amount of oil that might be able to be produced at some future time), rather than the more narrowly defined “Proved Reserves”.
So – how much oil is there? That number is surprisingly difficult to find (well for me it is, anyway). The USA is it seems the only country that tries to estimate it. The U.S. Geological Survey (USGS) puts it at 732 Bbbl excluding the USA (565 conventional, 167 gas liquids) [12], plus 42 Bbbl in the USA (32 conventional, 10 gas liquids) [13]. But unfortunately USGS says “Unconventional oil and gas resources, such as shale gas, tight oil, tight gas, coalbed gas, heavy oil, oil sands, may be significant around the world, but are not included in these numbers.“.
Total USA shale oil is put at 2,175 Bbbl plus “significant volumes of heavy oil in the oil sands of northeast Utah” [14]. Outside the USA, total unconventional oil is put at 335 to 345 Bbbl, but with much information missing [15]. [Note: The source here is Wikipedia, but (a) the data isn’t particularly controversial so Wiki should be OK, and (b) accuracy isn’t very important, only the general level.]
Total oil production to date is about 1,440 Bbbl [16].
A possible estimate of global initial TR is therefore about 5,000 Bbbl:
| Bbbl | |
| Past production | 1,440 |
| USA conventional | 32 |
| USA gas liquids | 10 |
| USA shale etc | 2,175 |
| Non-USA conventional | 565 |
| Non-USA gas liquids | 167 |
| Non-USA shale etc | 345 |
| Total | 4,794 |
Peak Oil date
Looking back at Hubbert’s Peak in Figure 2, it is striking just how accurate Hubbert was for 50 years, and equally striking that after 50 years of impressive accuracy, it went badly wrong (see the production surge from 2007 in Figure 4). So – what happened, and are there good lessons to be learned?
If you read Hubbert’s paper [5], you will note that he bases his estimates on very few numbers. The most important number was the total amount of oil. For the graph in Figure 2, total oil in the USA was put at 200 billion barrels (“Bbbl”). Hubbert didn’t actually know what the correct number was, so he estimated for 150 Bbbl and for 200 Bbbl. The graph for 200 Bbbl proved remarkably accurate.
Where Hubbert went wrong (50 years later) was that he did not make proper allowance for the “unconventional” oil, even though he knew of its existence. The combination of technological advance and high oil prices resulted in a massive surge in USA production of “unconventional” oil from around 2007. There was therefore a major departure from Hubbert’s predictions for the USA (Figure 4).
Put simply, all we have to do in order to correct Hubbert’s predictions for the surge in “unconventional” oil is to update the figure for total oil TR. The other principal figures Hubbert used were current production rate and rate of demand growth, and of course new values for those should be used too.
Hubbert put initial global TR (today’s TR plus all past production) at 1,250 Bbbl, and predicted global Peak Oil in 2010, based on the theory that Peak Oil occurs when about half of the TR has been produced. 2013 production rate was around 32 Bbbl per year, so using Hubbert’s theory and our new figure for TR, we can do a rough calculation on an “all other things being equal” basis, of when Peak Oil will occur (see spreadsheet [16]):
If global initial TR was 5,000 Bbbl and future production growth rate is 3% pa, then Peak Oil occurs around 2036. At lower growth rates (2%, 1%) the date is only slightly later (2038, 2041). The truly fascinating aspect of these figures is that a quadrupling of initial TR from 1,250 to 5,000 Bbbl only adds about 30 years to the likely Peak Oil date.
Over the last few decades, oil production has grown at around 1.3% pa [2] on average. In spite of the recent surge in USA “unconventional” oil production, global oil production has slowed a bit in recent years to about 1.1% pa. With USA shale/tight oil production expected to decline from 2020 [17], it may be difficult to maintain a positive global production growth rate from then on. Peak Oil is when the global growth rate hits zero.
Variations
The above calculation putting Peak Oil at around 2036 is simplistic, of course. It implicitly contains some big assumptions about future demand, technological advances, massive mining operations from Alabama to Utah, and a few others no doubt. It is probably reasonable to view it as giving an upper limit.
But maybe we can get more realistic if we look at some of the major factors again:
· Politics : Already, fossil fuels are under savage attack from the Greens worldwide. Hopefully, sanity will prevail, but there is clearly some risk of a politically-enforced early Peak Oil date (and peak everything else). That could be very painful indeed, a disaster on a scale that is hard to imagine. On hopefully a lesser scale, political instability in oil-producing countries is a potential threat to oil supply.
· Demand : From 2000 to 2013, production has gone up from 74,983 to 86,808 bpd [2], an average increase of little over 1% pa. There are increasingly plentiful and cheap supplies of natural gas, which may well eat into the demand for oil. Greater efficiencies, possibly driven by the oil price, may also help to limit demand. However, a period of global cooling, as some think likely, may increase oil demand for heating. Also, a period of renewed global prosperity would surely push up the demand for oil.
· Note: The relationship between demand and Peak Oil date is interesting. In the simple calcs [16] a higher production growth rate gave an earlier Peak Oil date. But under higher demand, if the oil price is strong (but not so high that it knocks demand down again), it is likely that more of the TR will get produced and hence Peak Oil date could even be later.
· Price : The full incremental cost of oil production – the cost of a barrel from new sources taking up-front capital costs into account – is now probably above $US70/bbl [17]. This view is reinforced by the oil futures market, where oil for delivery in future years is in Contango, ie. higher than the spot price by more than the storage cost [19]. For global oil production to keep increasing, a greater proportion of production will have to come from “unconventional” sources, and that does look likely to push the cost up further. As the cost of oil rises, so alternatives such as natural gas become more competitive.
· Technology : Will technology be able to keep ahead of demand by both (a) reducing the cost of production of “unconventional” oil, and (b) increasing the rate at which it can be produced? If it cannot, then Peak Oil occurs earlier. Technology may also work to reduce demand for oil by, for example, replacing it with gas or electricity for some uses, and by enabling more efficient use of oil.
With all these conflicting factors, the future for oil looks difficult to pin down.
Conclusions
A Peak Oil date cannot, I think, be predicted with any reasonable certainty. Although it is mathematically possible for Peak Oil to occur after say 2040, it looks unlikely to be as late as that, and may well be much earlier.
Major advances in “unconventional” oil technology are needed to forestall Peak Oil for more than a few years. Technology has always delivered in the past, and it is reasonable to assume that it can continue to deliver in future.
But there is another possibility : The price of oil is still likely to increase. If alternative energy sources such as natural gas (or even nuclear or solar energy) are available in sufficient quantity, and if the technology is developed for them to compete for some uses of oil, then Peak Oil occurs early and everyone benefits.
So Peak Oil doesn’t have to be regarded as a disaster. With any luck it will be a massive non-event that no-one even notices.
Discussion
Prediction is very difficult, especially about the future [18]. So I won’t make any predictions. Instead, I will offer some scenarios (don’t take them too seriously, consider them as using “artistic licence”, a bit like climate model “projections” but hopefully more realistic):
Scenario 1. The marginal cost of oil (driven mainly by “unconventional” oil) stays high, while alternatives such as gas become increasingly available at attractive prices. Heating at first, then transport, start converting to the alternatives. Peak Oil occurs early, but the total amount of energy available just keeps increasing while prices remain fairly stable, so there is net economic benefit.
Scenario 2. US shale oil production increases sharply until 2020, then declines. Together with other new sources of supply, the US shale can more than keep pace with declines in existing fields until 2020, but then it is found that other “unconventional” oil sources simply cannot ramp up production enough to keep pace. Total oil production declines quite sharply. In this scenario, Peak Oil occurs around 2020 and the oil price soars. There is then a painful transition period while other fuels scramble to make up the shortfall.
Scenario 3. Technological advances continue to reduce the marginal cost of “unconventional” oil production and to allow ever-increasing production rates. Technological advances also allow increasingly efficient uses of the oil, fuelling economic advances world-wide. A lot more “unconventional” oil is discovered in various parts of the world, and oil production continues to increase steadily until well past 2040. Oil production peaks around 2050, but gas, coal and nuclear keep the energy supply increasing for many more years after that, while solar technology matures and eventually everything (except possibly air transport??) runs on nuclear and solar.
Scenario 3 should be the most likely, but if our politicians continue to get ever more adept at stuffing things up, then the unpreparedness of scenario 2 may be the best we can hope for.
As always, I will be happy to be proved wrong!
###
Mike Jonas (MA Maths Oxford UK) retired some years ago after nearly 40 years in I.T.. He worked for BP in the 1960s and 70s, including 3 years in Abu Dhabi.
References
[1] OilPrice.com “Declining Fossil Fuel Supplies and the Energy Trap“, Tom Murphy, 31 Oct 2011. http://oilprice.com/Energy/Energy-General/Declining-Fossil-Fuel-Supplies-and-the-Energy-Trap.html
[2] Data is from: BP Statistical Review of World Energy June 2014.
http://www.bp.com/content/dam/bp/pdf/Energy-economics/statistical-review-2014/BP-statistical-review-of-world-energy-2014-full-report.pdf
[3] BP: Oil Reserve Definitions.
[4] US Energy Information Administration (EIA): Petroleum & Other Liquids.
[5] From Wikipedia 3/9/14: Hubbert peak theory. The graph matches the graph in Hubbert’s 1956 paper, Figure 21, for assumed initial reserves of 200 billion barrels.
[6] Norway crude oil production 1970-2013. Data is from the Norwegian Petroleum Directorate (NPD).
[7] heatingoil.com Unconventional Oil Reserves in and Around the US.
[8] wattsupwiththat.com Conventional Wisdom, Unconventional Oil, Willis Eschenbach, February 2, 2013.
[9] Oil rig blowout photo from Azhargd Gdin. Pumpjack photo from Wikimedia. Alberta Tar Sands mining photo from Photobucket.
[10] Paleofuture article We’ve Been Incorrectly Predicting Peak Oil For Over a Century
[11] The Bakken Shale Oil Field, North Dakota. http://bakkenshale.net/
[12] USGS Global Estimate for Undiscovered, Technically Recoverable Conventional Oil and Gas Resources US Department of the Interior Press Release.
[13] USGS U.S. Oil & Gas Reserve Growth Estimates US Department of the Interior Press Release.
[14] Wikipedia Oil Reserves in the United States.
[15] Wikipedia Unconventional Prospective Resources.
[16] Spreadsheet.
[17] Business Insider Australia Breakeven Oil Prices For America’s Shale Basins. Keystone XL Project Draft Supplemental Environmental Impact Statement (Figure 1.4.6-8 Mining Breakeven Oil Price. Note also Figure 1.4.4-8 showing US shale/tight oil production expected to decline after 2020)
[18] Niels Bohr, from The Quotations Page http://www.quotationspage.com/quote/26159.html
[19] Futures Magazine Contango crude markets.
1998 Campbell & Laherrere Peak Oil Model Accuracy
In 1988, Jean Laherrere EXCLUDED unconventional oil. Aleklett shows their model to be much more accurate than critics claim.
How correct were Colin Campbell and Jean Laherrère when they published “The End of Cheap Oil” in 1998?
Declining Oil Growth
Actuary Gail Tverberg in The End Of Cheap Oil & Its Impact On Financial & Energy Security found oil production increased 7.8%/year from 1965-1973, but the growth rate declined to only 0.4%/year from ~2006-2012.
Depletion rates
PeakOil.Net links to numerous studies on oil production and disssertations e.g., M. Höök, 2009 Depletion and Decline Curve Analysis in Crude Oil Production
Regional Peaking
See James Hamilton showing production graphs for each State etc., Oil Prices, Exhaustible Resources, and Economic Growth,” in Handbook of Energy and Climate Change, pp. 29-57, edited by Roger Fouquet. Cheltenham, United Kingdom: Edward Elgar Publishing, 2013. Working paper version here.
Oil Price Shocks Increase Unemployment
Note the impact of: “Historical Oil Shocks,” in Routledge Handbook of Major Events in Economic History, pp. 239-265, edited by Randall E. Parker and Robert Whaples, New York: Routledge Taylor and Francis Group, 2013.Working paper version here
Now I wish to add a comment I like to make once in a while: if we use a “reasonable” estimate of fossil fuel “economic recoverable” resources, and project it into the future, we can estimate peak CO2 concentrations. I used my numbers and I arrived at something around 630 ppm.
I didn’t write the figure expecting anybody to use it. I think most of us can grab a spreadsheet and prepare an estimate. Don’t forget that natural gas liquids aren’t oil, that a lot of petroleum is used for chemicals, and some is used to make roads. Whatever you use, I’m sure 97% of scientists will agree the IPCC “business as usual” (RCP8.5) oil production forecast is baloney. This means most of those papers predicting rabbit extinctions and sea level rise up to the Statue of Liberty’s neck are a waste of time.
Finally, although I’m not as familiar with coal, I’ve been reading about the peak coal concepts. And I think we aren’t nearly as comfy as many people think (my 630 ppm figure includes coal emissions).
Fernado, Gaia’s Limits provides a long summary of peak oil, and overviews of gas and especially coal. Coal groundtruthed by country. Extensive footnotes for you. Agree that there is no way RCP could eve be reached. Nor the earlier AR4 SRES A2 ‘business as usual’. Did not bother to try computing peak CO2. Way too complicated with changing sinks. And no need withnlower observational sensitivity.
Rud, I simply extrapolated current sink ability to withdraw CO2 from the atmosphere. I studied the carbon cycle to see if I could simulate it, but it’s a can of worms. For example, how the heck do we simulate the addition rate of magnesium ions to sea water due to erosion? Evidently that would change if extreme precipitation events increase. I’m starting to think this system has built in dampers.
Actually there is only one limit in this complicated system. On the end all Carbon should end up as calcium shell (CACO3) on the bottom of sea in sediments. There is nothing left for biosphere. There must be some mechanism how to convert limestone back to atmosphere CO2. Is it only coincidence that oil is found on places where marine sediments are?
There must be pure natural way how to process stored Carbon deposits in form of natural gas, oil, coal back to biosphere cycle.
By burning oil we are just helping this natural cycle.
Peter
That is a correct assessment. With time, sinking of plankton with calcareous shells, to form limestone, depletes the atmosphere of CO2, which is bad. Thus in a real sense humanity on behalf of the biosphere discovered fossil fuel burning “just in time” considering that in the last Wisconsin glaciation atmospheric CO2 fell to about 180 ppm, dangerously close to 150ppm the level where plant growth gets severely limited. The recent evolution of C4 photosynthesis with more efficiency also shows a biosphere stressed by low CO2.
Burning fossil fuel does indeed complete the carbon cycle to the benefit of the whole biosphere.
Peter, you are correct. But those carbonate sediments get recycled along the tectonic subduction zones, and re emitted by the resulting volcanism. It is estimated that without this process, photosynthesis (so life) would become impossible in about 2.5 million years.
Yep. Continental drift seems to be required for life.
That means that CO2 level is exactly dependent on how much limestone is momentarily entering tectonic subduction zones. So current CO2 levels depends on how much marine life was there some millions years ago.
And another idea, there are places on Earth which are basically untouched for hundreds of millions years. African plate etc. Continents are floating on Earth mantle and are not part of limestone recirculation. There is for sure less limestone deposit on those continents, but there is. Snail shells, bones… And all this sequestration is taking CO2 from atmosphere, but without returning it back as sea floor. So there should be longer life cycle, where all Carbon will end up buried on continents without quick returning to life cycle.
I don’t see “peak oil” ever happening in the manner in the traditional sense. If you look at it only as a finite resource that eventually runs out, sure, the discussion makes sense. I just don’t see that happening. Here’s a couple of game changers:
1. Batteries; Yup, batteries. Oil and its immediate derivatives gasoline and diesel are of value precisely because their energy density is so high and refueling so short. This makes them immanently practical for all manner of applications ranging from commuter cars to cargo ships. If advances in energy storage (which may well be something other than batteries) provide a medium that rivals or exceeds oil in energy density and refueling time, then suddenly oil is easily replaced (may even have a hard time competing!) with everything from nuclear to coal to wind.
2. Synthetic oil; Hey, the stuff is just H and C! It isn’t IF synthetic oil is possible, it is a question of cost, Someone comment upthread that it might be practical at $200/bbl. Well, at $200/bbl, quite frankly, that’s cheap. Oil is pretty much the cheapest commodity on earth. The economy was fine at $100 bbl, it will be fine at $200 bb, even $300 bbl. At those prices, the alternatives such as labourers back in the fields to produce food are STILL not just more money but orders of magnitude more money. So, as cost of synthetic continues to drop (and it will) it will at some point make it easily practical to switch from the stuff we pump to stuff we make with the energy sources being nuclear, solar, coal, even wind.
That’s just the game changers that come to mind. I’m nowhere near smart enough to come up with a comprehensive list, I’m sure there are more out there.
DH, good points. The $200 per barrel equivalent is for Fischer Tropsch liquids synthesis. Largest existin plant is Shells Pearl in Qatar. Exxon claims $180 for its alternative methanol route, but there is not even a pilot line to validate those numbers. Another consideration is ‘peak coal’ Alaklett at Uppsala, Dave Rutledge at Caltech (his presentations are on his website) and Patzek of U. texas have all studied that and concluded it comes sometime between 2040 and 2060. That is a problem for coal to liquids subbing for oil.
Gas is hopeful. First, shale recovery factors are running 15%; for oil it is 15%. Second, there is more gas than oil shale. Simple function of the oil window. So if Siluria works at scale, thenworld buys several decades in which to work on things like better batteries and better nuclear. There are a number of good gen 4 nuclear prospects.
But having been involved in batteries and energy storage for more than two decades, I can assure you batteries are very difficult in the Japanese sense of very difficult. Death of a thousand papercuts in each of the possible electrochemistries to get suitable combinations of energy and power density and cyclelife needed for transport electrification beyond Tesla toys. The chemical equivalent in fuel cells, ditto. Hydrogen issues solved by methanol FC, but then efficiency is shot. SOFC way to many issues for vehicles. As Bloom Energy shows, not very viable for stationary locations either.
iPad typo alert. Shale oil recovery factor is 1.5 %, a tenth of shale gas. A simple viscosity/porosity issue. And that is only in the better basins like Bakken. #2 Eagle Ford is running 1% according to Oil and Gas Journal.
ristvan
SASOL III was put on line with a break even cost of $20 per barrel, and guaranteed $27 per barrel whatever the going price was. At the time, that was ‘expensive’. At $50/bbl they were making a killing. How did someone con a government into thinking it was $200? Good grief. I don’t have a cost per bbl for the Mossel Bay nat gat to liquid fuels. Maybe someone can comment.
It seems everyone is playing up how expensive it is http://stateimpact.npr.org/pennsylvania/2014/04/11/economics-may-hinder-berks-county-gas-to-liquids-plant/ but indirect process conversion plants are popping up all over. Could it be that, like nuclear, they are deliberately made as expensive as possible to keep the cost high – feeding the construction and maintenance industries well into the future?
I hope you are right. The ideal situation is that oil starts getting replaced with something better, cheaper and more plentiful well before we struggle to increase the oil supply. That’s how Peak Stone, Peak Horse, etc, happened, and it’s all good. We don’t want oil to follow the Peak Cod path (https://en.wikipedia.org/wiki/Collapse_of_the_Atlantic_northwest_cod_fishery).
I completely agree. But fear based on research over now 6 years and part of three books that the peak cod scenario is more likely. Even if Siluria proves out (heavy hitter investment is a promising indicator, but still ‘mad money’ for those large corporations) it buys a few decades, not more. And electricity storage improvement, whether directly or through chemical intermediates like hydrogen for fuel cells, is just very, very difficult. Gabillions of R&D has been thrown at both routes. I have been on the front lines, with lots of battle stories to tell. None good.
One can never rule out another Einstein. But electrochemistry (batteries, supercapacitors, pseudocapacitors, fuel cells) is a well trampled field for over 100 years. And all the nanotechnology hype in the field (nanotubes, graphenes, self assembled nanostructures [behind the A123 failure]) have failed to pan out for what in hindsight were fundamental physical and chemical reasons.
How about biological batteries? You know, after the electric eel?
/Mr Lynn
Synthetic oil has two serious problems. 1) it’s ERoEI is negative. 2) it cant be ramped up to meed all our demands.
The Soviet Moho drilling attempt on the Kola Peninsula ended at a depth of 12,260 metres (40,220 ft), and along the way encountered primary water bubbling with hydrogen. Such a magnificent attempt has yet to be replicated. Why?
Because the rocks down there are extremely hot and the experts think there’s nothing to be found at 12260 thousand meters. The Soviet Union fell for very good reasons.
Hot rocks and “experts think” = Nothing to see here, move along? What is it about rocks being hot that precludes chemical reactions?
Seemingly, the Soviet Union fell for very good reasons that are apparent in hindsight, but which no one foresaw, or recognized, until after the fact.
Deep drilling appears to be one of those reasons – do I have that right? – but it seems that the mine shaft gap was on the Western side, so are you arguing that we in the US suckered the USSR into going broke by squandering money on pointless deep-drilling operations?
Fernando
I like it – the “experts” at what is to be found at 12 km down are of course, obviously, not the ones who actually drilled down 12 km.
Your “experts” don’t think. They just have louder mouths than the rest.
Steve, the Soviets were communists. They didn’t understand much about economics. I realize you don’t seem to like experts. But I’m one of those experts. Let’s just say that drilling 12000 meters costs a bundle, and we experts don’t like to risk money that way. However, if you want to drill 12000 meters feel free to ask me for advice. I can think of a couple of places where you’ll find diamonds.
Fernando Leanme April 19, 2015 at 2:04 pm
Russia suffered horribly under the Communist yoke, but it did not make Russians stupid. In any event, membership in the CPSU never exceeded about 10% of Russia’s population.
Recall that one of the main tenants of communism is redistribution of wealth, so I would take issue with your statement that the Communists didn’t know much about economics. In fact, communism is all about economics, same as the CAGW scam.
It’s a common mistake to conflate Soviet Communism with the Russian people. The Red Army may have marched under the communist banner, but Stalin was able to rally the Russians in WWII by appealing to patriotism, not politics. It is true, however, that most Red Army formations in The Great Patriotic War were backed up by NKVD troops, just in case love of Mother Russia began to falter in the front-line troops.
(my bold)
Scientific experiments are usually run to gain information, and not necessarily with an eye to any immediate economic benefit.
Until we have better understanding of natural forces at play in the depths of the planet’s interior, I think it best to keep an open mind about abiotic oil.
Thanks for your comments here, and for keeping an even keel in responding to others. I commonly listen to experts, but reserve the right to think for myself.
-sp-
Good grief – the Peak Oil aficionados still banging on about their discredited ideas.
Meanwhile . . . on planet Earth . . . US oil production is back at 1970 record levels and still increasing. If the only country where fracking is common can do that in the 3 years since Jonas’ last screed you can safely ignore everything he says.
I am a peak oil professional. I really didn’t start thinking about this until 1990, when I realized oil exploration was a loser, and we were going to need much higher prices to justify keeping the large exploration department we had.
Later we saw prices climb as the world approached peak, and the higher prices sure came in handy. To keep producing more oil we will need much higher prices, and eventually marginal consumers won’t be able to afford it. Simultaneously we will see other energy sources try to plug the gap. This is what leads to peak oil. But I suppose amateurs in this business have difficulties grasping all these moving parts.
You can knock the EIA predictions, but here is the historical plot.
The 1970 production peak is expected to be exceeded in 2015 and the curve is showing a steep slope up which will likely turn due to price decline and fewer oil rigs.
This is data.
http://www.eia.gov/dnav/pet/hist/LeafHandler.ashx?n=PET&s=MCRFPUS1&f=M
Ah, well there you go. You are a professional, and us amateurs can’t grasp what you, in your professional manner, are talking about. No sense in us even talking to the likes you. It is settled then.
Are you sure you aren’t also a climate change professional, you talk just like them.
Actually, Fernando is predated by Richard Malthus if the 18th century.
Tom, the dude called me an amateur. I happen to be a professional. This means when I can charge for working out numbers, writing stuff, and giving talks about oil related stuff. I just want to make sure it was clear that when it comes to oil I’m the buzz saw.
FergalR –
9,367 bbl/day in 1970 , 8680 bbl/day in 2014 – but definitions changed to include natural gas condensates and unconventional oil. etc. See above.
It was 9,320 bbl/day in March – 13% up on last March – close enough for anyone reasonable.
Why wouldn’t the definition include unconventional oil – since it is oil?
Why do you object to using lease condensates when they are interchangeable with oil for so many applications?
FR, you apparently do not understand the geophysics of shale oil. The trick is the steep decline curves. That is where Harvard’s Maugeri lost the plot in 2012. Fracked shale well output declines 70-75 percent in 12 months, and reaches not more than 10% of initial production in less than 3 years. Stripper status ‘forever after’. Refracking only helps a little sometimes. Prior to the Saudi engineered price squeeze using 1.6mbpd overproduction on a base daily demand of about 93 at present, US shale production would have peaked in 2019 and fallen by 80-90 percent in three years thereafter. With the US rig count halved, that shale peak is pushed back to about 2024. Still within the next decade. Expect oil prices back to ~100/bbl before end of 2016. (Saudis know what they are doing. The shale well decline curves are public information for Bakken, Barnett, and Eagle Ford).
Us drilling rig count has halved in the last 9 months.
If you’re right – for once – US production will be in the toilet in a few short months.
Better get your next excuse ready.
On the BP figures, US oil production in 1971 was 11.156m bpd. In 2013 it was 10.003m bpd. (I don’t have 2014 data). In spite of the US spike in production, global production in recent years hasn’t been far above flat, and the US will not necessarily be able to keep increasing production for more than a few years. Sure, if everyone develops every oil deposit to its maximum then oil production can keep increasing for some decades. But … that might not happen and, as I tried to indicate, whether Peak Oil is beneficial or painful then depends on why it doesn’t happen.
“US oil production is back at 1970 record levels”
Yes, but the population and the demand for oil had doubled since.
If some seer could tell me the future prices of batteries and their charge rate, then predicting future oil demand would be easy.
Hubbert’s blunder wasn’t the concept of “Peak Oil”. The blunder was the conclusion that the curve was bell shaped, and symmetric. If you assume symmetry, you can make forecasts about the future that you cannot make if you assume a right skew.
I’ve meant to look into it and have never found time and interest at the same time. But my impression is that Hubbert was more interested in suggesting a better way to predict future oil production than the look at known reserves and guess how long it will take to drain them with current demand approaches that were common in th1940s and 1950s … and were always really wrong.. I believe that Hubbert initially put up a chart with a bell shaped curve and didn’t specify the nature of the curve. He was more interested in making the valid point that production for any resource starts at zero and ends at zero. I think that only when pressed did he suggest using what has come to be known as the Hubbert Curve.
It’s always seemed to me that there is no reason the production curve’/time has to be a tidy mathematical entity and that it’s shape for any resource is likely to be determined things like cost of production, importance of the resource, willingness of consumers to pay what the product costs and the availability of cheaper or more satisfactory alternatives.
But what do I know?
Absolutely correct. He used symmetrical logistics functions (which have fatter tails than bionomial ‘normal’ bell curves). Wrong, proven by North Slope and North Sea basins. (essay Peeking at Peaks explains.) The ‘correct’ functional form is a gamma distribution having a long declining tail. Has to be fit with two parameters, but easy to do empirically in Excel.
BUT, the front side (up to the peak production) of gammas that reproduce actual history do not vary significantly from logistics functions. In other words, peak production timing is not much affected. There is a (thank goodness) substantially longer slower glide path to exhaustion thereafter. That is quite important for post peak production estimates, and how rapidly the ‘peak’ pinches. The IEA’s WEO2008 contains some additional important observational insights on this. Essay IEA Fictions.
Except for MRC wells.
Murrayv, MRC horizontal wells are one of several EOC things enabling long tail gamma distributions, mostly in carbonate rather than sandstone conventional reservoirs (2/3). True. But do not much change timing of peak production. Since to avoid water cut, pumping still must be slowed.
I just prepared an estimate of Venezuela’s oil reserves. Just for kicks I added an oil rate versus cumulative oil curve. It sure has lots of ups and downs. An interesting issue about Venezuela is the sheer size of its “oil country”. It has tranches of oil reserves associated with three groups go giant pools. I tend to agree the symmetry isn’t necessary nor a given.
Peak Oil: Peek and ye shall find.
“…but gas, coal and nuclear keep the energy supply increasing for many more years after that…”
“Energy” is not one big pot of mashed potatoes, but more of fruit salad. These various sources are not easily nor cheaply interchangeable. Coal is for electricity. Oil/gasoline is for transportation. NG is for residential/commercial/power production. Crossing outside these current applications will not be easy or cheap.
Agree. But maybe a bit of lateral thinking can suggest some crossings ….. much transport will occur within city boundaries, ie. over modest distances, and electric vehicles may become economically viable for that. Then we will have gas, coal and nuclear energy powering transport. Heating is another oil market, and it is easy to see gas eating into that.
Per EIA oil for heating is a tiny percentage.
Can’t envision much electric transport on the I-10, I-40, I-70, I-80 corridors. “Modest distances” does not apply west of the Mississippi.
Ponder the copper needed to electrify the transportation sector. The industry is running short as is. And the amount of central station power to charge them all. Big NG demand = big NG price.
Doesn’t have to be all, just some. And we don’t know how new technologies will transform the picture.
Mike, Heating represents only about 5% of US oil usage and that amount is shrinking — limited by the fact that changover to cheaper natural gas requires expending some capital. So it tends to only get done when the furnace needs replacing anyway. Furnace lifetimes are around 20 years. And it requires access to NG, which is expanding, but far from universal
Electric powered vehicles are limited primarily by battery technology and secondarily by charge time. PR puff pieces notwithstanding, batteries suck and are improving only slowly. However, improvement in vehicle mileage has been steady and seems likely to continue for at least a few more decades. It is also perfectly possible to run vehicles (but probably not jet aircraft) on natural gas. Conversion of fleet vehicles and trains to NG is proceeding in the US. Passenger cars can run on NG and a lot of them do in Iran and Pakistan(!!!). In North America, NG conversion is discouraged by a lack of fueling stations and an unfortunate emissions control regulatory structure that makes conversion unnecessarily expensive.
I can not imagine a geological reason why Non-USA shale etc will only be 345 while USA shale etc totals 2,175.
IMHO opinion much more likely Non-USA shale etc will turn out to be multiples of the USA shale etc number.
The US shale number is wrong. It confounds oil with kerogen. See upthread. The most recent EIA global shale oil estimate (TRR, 6/10/13) was 345Bbbl. That is overstated by more than 100Bbbl, just based on Monterey, Bahzenov, and Sichuan misestimates. Details in the Blowing Smoke essays. The devil is in the details.
The overestimates seem to be based on compartmentalizations (the blocks are too small to fit the horizontal wells), and oil properties. But I wonder if someday we may not have some sort of mini drill motor driven with latex mud, hung at the end of coil tubing, cased with some sort of super plastic liner? We could drill a zillion little wells from a single mother bore?
Yes, but I couldn’t find any more credible-looking numbers. There don’t appear to be any, and I thought that making them up wasn’t too good an idea. Maybe there’s a lot more oil elsewhere, or maybe some like the Monterey will “disappear” (http://www.latimes.com/business/la-fi-oil-20140521-story.html – “U.S. officials cut estimate of recoverable Monterey Shale oil by 96%” – caution, it refers to “existing technology”). Perhaps the key point is that large changes in TR give relatively small changes to Peak Oil date.
You are mathematically correct, using either logistic or gamma distributions. A large variance in abundance makes a small change to peak oil production timing. This is basically because so much has already been undeniably consumed. See essay Peeking at Peaks for some calculations using simple logistic functions.
US Government Predicts Peak US Oil
Compare US EIA’s projection that US oil production will peak ~ 2019.
David L. Hagen
Funny. For a moment there I thought that I had seen that quote before. For 1919’s oil production.
“Oil reserves are very much a function of technology and price.” – Very good and correct. Good article, I enjoyed reading it. You make some very good points, but leave out some key points. We should all reflect that the first estimates of the end of oil were made in the 1920’s, this has been repeated (incorrectly) periodically since. The value of work provided by a gallon of gasoline varies, but a reasonable number is around $400 on average. One gallon of gasoline and a chainsaw can do the work of 20 men in a logging operation, for reference. This is a primary support for our standard of living. Unconventional oil, what is that? Oil from shale, oil from water floods of existing reservoirs, oil from Carbon Dioxide floods, NGL floods, bacterial floods, steam floods, surface mining of oil sands in Canada and other places. For all practical purposes the TR reserves are infinite. I’ve seen, up close, enormous untouched reserves in Russia, Venezuela, Argentina, Indonesia, Canada, Europe, the US and other places. These are all awaiting regulatory approval, the right price, and the financing. To get the financing most of these reserves need a stable government that is reasonably corruption free and will stick by signed contracts. Most technically recoverable oil in the world that I know of is trapped by either corruption (think Venezuela) or regulation (think US and Europe) or extortionate contract terms (Russia, China, Indonesia, Malaysia, most of Europe. The oil is there, the technology is there, eventually the governments will be there. The difference in the value of the oil versus the alternatives is too high to ignore. Besides technology and price, the cost of corruption and regulations need to be considered. Often they are decisive in the development decision and the financing. I’ve seen many projects abandoned for these reasons. War and instability make a difference in many places also, Syria, Chad, Nigeria are examples. The USGS estimate of technically recoverable reserves is very conservative, way too low in my opinion.
Should the world economy collapse because of the debt bomb, there wont be enough liquid credit to develop those deposits.
As always, I will be happy to be proved wrong!
Regrettably Mr Jonas, even though I enjoyed your analysis, you are wrong as you have left out transformation technologies and innovation.
Coal to liquids has been mentioned. The oil price has dropped significantly but the thermal coal price has too. So as far as I know the CTL plants in South Africa and China are still in production.
The amount of coal in the world is huge: trillions of tonnes were recently found under the North Sea.
It is correct that price is always going to be an issue but it is not that much of an issue since the cost to transform coal to oil is (a) relatively fixed by the technology and (b) likely to decline about 1% per year as it does for all other industrial processes – due to innovation, automation and cost control. Therefore all that will happen is a plateau in price will occur as CTL becomes the swing producer, then eventually the main producer.
There is enough coal around the world for many centuries of use. CO2 is not an issue because ECS is low, below 1 C/doubling. Which means it is harmless. After coal becomes uneconomic the same replacement can occur to nuclear, for which we almost certainly have tens of millenia of fissionable fuel, then millions of years of deuterium once fusion is cracked. And it is relatively easy to produce a liquid fuel such as methanol using nuclear power.
Bruce, you say I have “left out transformation technologies and innovation“. OK, I didn’t exactly emphasise them, but the intention was to recognise them in statements like “technology also helps to make [..] other energy sources more competitive” and “if the technology is developed for [alternative energy sources] to compete for some uses of oil“. In a smart world, the field would be open for all alternatives to compete, rather than having governments trying to pick winners or enforce losers.
Bruce, I wrote specifically about those misreported Norwegian coals in essay Much Ado about Nothing. They lie in the Haltenbanken, 150-200 km offshore, 2400 to 4600 meters under the seafloor with water depths from 300-1200 meters. Source ‘rock’ for the Haltenbanken deepwater oil fields-why the drill cores existed. TRR is zero, likely for all time.
Over time most people came to the conclusion that there’s a lot at play in oil production, and that simple fact like “we’re seeing the number of rigs dropping” doesn’t mean it is inevitable. Yet you still see the doom-mongers leap in with their absolute insistence it is inevitable and soon. Apparently some people just can’t help projecting their own fears on the rest of the world.
So facts don’t matter. The conventional Peak Oil in 2005 didn’t matter and the global economy is doing just fine. Russia’s Peak Oil in Nov. 2013 doesn’t matter. Saudi Arabia inability to raise production for the last six years despite the Libyan crisis, high prices, and increased drilling doesn’t matter. The shale oil beating due to low prices doesn’t matter. The decrease in global oil exports doesn’t matter. If we just close our eyes and don’t look at what is happening we won’t feel any fear about the future. Everything will be fine because oil is too important to us.
I’ve got news for you. Facts do matter. Our global economy is going to get crushed again, and then we will have a debt implosion because debts that are too big are not serviceable during economic crisis (ask the Greeks), and then we will have a monetary crisis because money is supported by too much debt and too much paper and too little actual goods. By then we won’t be needing much oil so we won’t mind that Peak Oil took place a few years before. Few people will recognize that the cause was that we hit Peak Oil and the blame will be placed on the usual suspects. With diminishing oil, economic recovery will not be possible and we will be just happy to stabilize things for a while.
Where I live (Southern Europe), I look through the window and I see Peak Oil taking place: >20% unemployment, lower salaries, 25% less oil consumption, electric energy overcapacity, more expensive electric bills, underused infrastructures, deflation. Welcome to Peak Oil. It is here. It is now. You think you can escape because US has some shale oil? Good luck with that. We live in a global economy nowadays and most countries are going to start rolling over, taking the rest with them.
So, peak oil is the scape goat for the uneconomic policies that resulted in the crash?
Why am I not surprised.
What you see is not oil peak, but death spiral caused by European government taxation and social programs. All this is cause by energetic poverty, caused by inflating gas prices by taxes. Market price for 1l of gas is 70 eurocents, but anyway government is causing selling by 1,5 Euro.
Europe is shooting herself to both legs by not allowing people access to cheap energies.
You are both deceiving yourselves if you think that with different economic policies you can escape the inevitable energy descent of Peak Oil. It is not the price at which oil is sold that matters since that is determined by supply/demand. It is the cost of oil production that matters. If the cost of production is high and you sell it cheap you destroy production as it is happening now. If the cost of production is high and you sell it expensive you first destroy consumption and then production. We are running out of cheap to produce oil. Our economy will not grow with increasingly expensive and diminishing liquid fuels. The reduction in ERoEI gets reflected in an increasing cost of production.
That you are not able to see that the end of conventional cheap to produce oil is behind all our global economic woes does not surprise me. But it is a physical limitation and therefore it cannot be solved. We have reached the Limits to Growth.
The sum of uneconomic and hostile business policies is a drop in GDP.
No escaping that fact.
Some astute peak oil guys will make 10 fold their investments in beat up junior oil/gas stocks over the next 4 years. The first double off the bottom has already happened. (COS). The rest of you.. well.. enjoy being a believer in new energy miracles.
I put my pencil to it and bought in January. Now I’m waiting for the Guardian’s divestment campaign to get traction, so I can buy more shares. But this takes patience, the overhang in supply should be over by early 2017 at the latest.
?Who do you like in this field, good management and reserves available at a low cost in a stable even if all hell breaks out country?
“Prediction is very difficult, especially about the future…” Really….
We have 1315.2 billion barrels of oil equivalent, not counting one hundred billion barrels of heavy oil and the two hundred billion barrels of oil discovered in North Dakota and Ohio within the last decade.
The US has easily replaced Russia as the world hydrocarbon resource leader, not counting the grinding up the Rocky Mountains for oil laden rock and not counting the extraction of vast reserves of methane hydrate on the ocean floor.
See U.S. Fossil Fuel Resources: Terminology, Reporting, and Summary
“Bbls of oil equiv.” is nonsense, just confuses the issue. Makes as much sense as pounds of chicken equivalent or pounds of tomatoes equivalent .
Includes coal and natural gas.
The conversion is in document, if you are interested.
You are confusing resource in place with technically recoverable reserves (at any price). Very bad.
I am not confusing anything.
Read the Senatorial report which provides much clarity on the distinctions that you make.
i have 10,000 expensive-whisky-equivalent bottles for sale. $10 each. I take credit cards.
“One idea which surely is not open to argument is the fact that oil production will peak.”
What if the planet extracts heat energy from the planet, carbon from the atmosphere and hydrogen from the sea and stores it all as oil? This would leave only oxygen to find it’s way to the ozone hole an be ionised by the same UV the hole lets in. Problems would only begin if oil production is ever allowed to peak.
Just a few technical comments on the article.
1) Hubbert’s model was based upon a single geologic basin that was expanded to include the US lower 48. The basic premise of his model is that the bigger more prolific fields are discovered and developed first and the subsequent smaller fields will not produce enough to offset the decline of the bigger fields. The model does not include the effects of pricing & technology.
2) The “Shale plays” have been grossly over estimated as far as their deliverability and long term effect. The increase is more of a result of $100 oil and vast amounts of capital being available rather than any wonderful new technology. The technology in the shale plays has been utilized in the same areas exploiting the coventional carbonate reservoirs that abut the shales above and below the shale source rocks. In fact, it is more likely that the “shale wells” are actually producing oil from these same carbonates as the hydraulic fracturing is going up and down out of the shale horizon.This developement had just about hit the wall anyway such that had drilling continued at the same rate the new production would only be able to offset the rapid decline. Look for a massive deliverability drop in the next 12 months as the rigs are layed down.
3) As far as world peak oil, there are vast amounts of oil that are not being exploited because they are controlled by government national oil companies. These conventional resources if developed by a free market as in the US would actually increase daily production enormously.
4) The real wild card on oil is the Arctic once the technology is in place to exploit, that the Russians are pursuing. This virtually untested basin could be a real game changer, just looking at the results of the minimal exploration on the fringes.
Billy Jack, I worked developing projects in the Russian Arctic. What technology are you thinking of, and where do you think all this oil will be found? The Kara? Chukchi?
Also, I’m sort of an expert in Venezuela. Is that what you have in mind? I don’t think Venezuela can kick in to make much of a difference, it won’t get online fast enough to avoid a peak sometime within the next 20 years.
Coal liquefaction should push the graph a couple of hundred years or so o the right.
Also, converting natural gas to jet engine fuel. See http://en.wikipedia.org/wiki/Gas_to_liquids
Kind of moving backwards. Any feel for the energy and cost to actually stuff the genie back in the bottle?
The technology evolves whenever their is a disparity in price between the two.
Not enough coal. We are headed for peak coal too.
Fracced tight oil wells, even in naturally fractured rock, decline rapidly and the potential for secondary recovery is very limited. So shale oil, IMHO, will flounder sooner than we would hope unless prices are high. Also, infill conventional wells that have been drilled and completed over recent years in response to high oil prices will begin declining as will the older neighboring wells in the same reservoirs, and owing to their small drainage areas will not justify any further production enhancements. My gut feel after 37 years as a petroleum engineer is that the current low price / high production status will reverse within 12 months, not completely but significantly. It had better, then I can go back to work!
Who are these guys making such an authoritative analysis of future oil production?
“On the internet, nobody can tell you’re a dog.”
Well, in my case I like to join peak oil and global warming at the hip. I happen to think CO2 causes some warming, but I believe the IPCC has a serious disconnect with reality. Maybe this global warming scare is intended to make us cut back because the real EIA (not the fake EIA we know about) says we are about to reach peak oil?
How about running vehicles on natural gas, as is common in South America and increasingly common for trucks in the US?
Coal liquefaction is promising IMO if its cost in energy can be reduced, but gasification seems like a better deal to me.
Whatever may be the case with crude oil, the planet’s hydrocarbon reserves appear to me effectively limitless. And of course with enough fission or fusion power, hydrocarbon products could be made to order from sources of carbon and hydrogen.
Not enough gas. If we start using gas like that we will reach peak gas in a hurry. Somebody needs to tell President Obama.
Seventy percent of the Earth’s surface is covered by oceans. Right now it’s only feasible to extract oil from land, or from shallow seas. But surely the technology to retrieve oil from the ocean depths would not be impossible to develop—imagine crawlers that begin drilling, not from the ocean surface, but from the sea bottom.
/Mr Lynn
The ocean depths are generally abyssal plains far from the biological detritus that washes into basins such as the Gulf of Mexico. Lots of luck finding commercially viable hydrocarbons there.
Ocean floors are young basalt emerging from spreading ridges.
Ah, but not all oil may be sedimentary in origin. See ladylifegrows’ comment here:
http://wattsupwiththat.com/2015/04/18/peak-oil-re-visited/#comment-1911175
I want to thank Jonas for a great article and all the commenters for their humourous, if not bizarre, opinions.
I feel compelled to add my own, so here it is: biocrude will, sooner or later, run our world and it will be a better world.
Thanks but Hmmm. Current global oil production is over 4 billion tons pa. Current global wood production is hard to find, but it’s maybe a bit over 1.5 billion tons pa including firewood (https://en.wikipedia.org/wiki/Wood_economy (1.5bn cu m / 45%) * say 0.5 tons/cu.m). So quadrupling the global wood production would do the trick. For a while. Good luck.
For ‘exact’ biofuel ‘calculations’ read my simple essay Bugs, Roots, and Biofuels.. Only need to estimate three numbers. Done.
Sorry, can’t find “Bugs, Roots and Biofuels”. Link?
Mike, it is an essay in the energy section of ebook Blowing Smoke: essays on energy and climate. Foreword is from Dr. Judith Curry. Available iBooks, Amazon Kindle, Nook, Kobo,…
Many other essays that would also interest you and provide information for your next post here on this important topic. And, thanks for this one.
Wish I would have commented up-thread, if only to be included in the “humourous, if not bizarre, opinions”
you mention.
I’m sure it wouldn’t have taken much effort on my part 🙂
One of the thoughts on why the Roman Empire collapsed was they ran out of wood. It was all either burned for fuel or used for construction. England also suffered from deforestation. They had to look outside the UK for ship building wood.