Guest Post by Bob Tisdale
First: Congratulations to the teeny-tiny 2014/15 El Niño. It’s now official. NOAA included it as an “official warm event” on their Oceanic NINO Index this week.
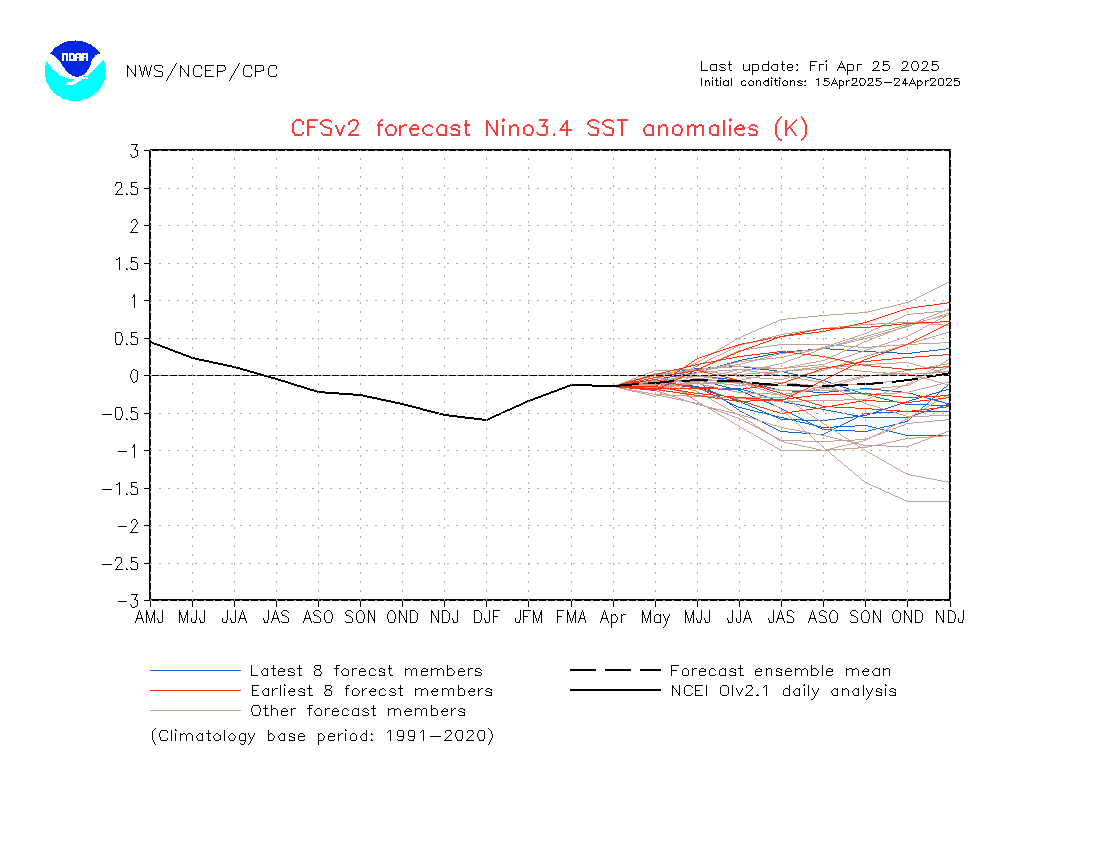
NOAA’s CFS.v2 model (dated April 9, 2015, source here) is now forecasting a strong El Niño for this upcoming ENSO season, or as blogger Alec, aka Daffy Duck called it, “a supercalifragilistic el nino” when he brought the forecast to my attention here. See Figure 1. That forecast is noticeably higher than the one that shows up on page 25 of the NOAA weekly ENSO update, which was dated April 4th.

Figure 1
If you live in California and are hoping for drought relief, I wouldn’t get my hopes up just yet. It’s still (boreal) springtime, and ENSO forecasts have a hurdle called the “spring prediction barrier”. Basically, El Nino forecasts have a bad history during and before boreal spring. [See of Torrence and Webster (1997) The annual cycle of persistence in the El Niño/Southern Oscillation for more info on the spring prediction barrier.] The spring prediction barrier is especially true for El Niño development predictions…not so much for El Niño decay or La Niña development and decay. [See Duan and Wei (2013) The ‘spring predictability barrier’ for ENSO predictions and its possible mechanism: results from a fully coupled model.]
There are a number of aspects that may help in the development of a stronger El Niño this year than last. (1) This year’s downwelling Kelvin wave is a little later in the year, so it will be impacting equatorial sea surface temperatures later in the normal ENSO development “season”. Keep in mind that El Niño events are normally tied to the seasonal cycle. [See the post Why Do El Niño and La Niña Events Peak in Boreal Winter?] (2) The eastern tropical and equatorial Pacific (surface and subsurface) are warmer this year than last. [See the March 2015 ENSO Update – Will the 2014/15 El Niño Become the 2014/15/16 El Niño?] (3) The downwelling Kelvin wave making its way across the equatorial Pacific is a little weaker than the one last year, but it’s still a reasonably strong downwelling Kelvin wave.
But as we saw last year, the development of an El Niño can be suppressed by a lack of westerly wind bursts over the course of the year. Strong westerly wind bursts early in the year only initiate the process. They are needed throughout the rest of the year to strengthen the El Niño. Also, the upwelling (cool) Kelvin wave that should come next can offset the strength and impacts of the existing downwelling (warm) Kelvin wave. So part of the development will depend on the strength and timing of that upwelling (cool) Kelvin wave, too.
A COUPLE OF NOTES ABOUT BACK-TO-BACK AND MULTIYEAR EL NIÑOS
For this discussion, we’ll refer to NOAA’s Oceanic NINO Index again. Of the 20 El Niño events since 1950 that are shown on the ONI index (in red), there are 2 pairs of back-to-back El Niños (the 1957/58 & 1958/59 El Niños, and the 1976/77 & 1977/78 El Niños) and two multiyear El Niños (the 1968/68/69 El Niño, and the 1986/87/88 El Niño). El Niño events normally evolve in one year and decay in the next, so I’m defining multiyear El Niños as those that developed in year one, extended through the second year, and decayed in the third. Bottom line: multiyear and back-to-back El Niños can and do happen. In other words, just in case some alarmists decide to get goofier than normal and try to make a fuss about a multiyear El Niño or back-to-back El Niños, there would be nothing unusual about either type coming to pass this year.
And for those wondering, there is no set rule about the strengths of the first and second years of multiyear and back-to-back El Niños. See Figures 2 and 3. For the multiyear events, the second season of the 1968/68/69 El Niño was slightly weaker than the first year, but during the 1986/87/88 El Niño, the second season was definitely stronger than the first. Looking at the back-to-back El Niños, the 1976/77 & 1977/78 El Niños were comparable in strength, while the 1957/58 El Niño was stronger than the 1958/59 El Niño. In fact, the 1958/59 El Niño was so weak it doesn’t appear on the Old Oceanic NINO Index, which uses a fixed set of base years for the climatology. [See the post Comments on NOAA’s Recent Changes to the Oceanic NINO Index (ONI).]

Figure 2
# # # #

Figure 3
As I noted a number of times last year, we’ll just have to watch and see what Mother Nature has in store for us.
[Thanks to blogger Alec, aka Daffy Duck for the heads-up.]
I may be wrong but my prediction of a strong El Nino in 2015 still stands:
http://astroclimateconnection.blogspot.com.au/2014/11/evidence-that-strong-el-nino-events-are_13.html
Think you are right Ian. Already better linkage in overall pattern, but this will peak and weaken back toward the enso3.4 centered Modoki event. Look for a major flip to much colder enso areas and off west coast of US in coming 2-3 years. Overall pattern Atlantic, where Gray/Klotzbach AMO metric already turning cold, and the Pacific is similar to late 1950s. The temp drop in the wake of this in 16-17 ( globally) should exceed that of the previous enso events in 06-07 and 09-10. Expect a massive push by AGW agenda on this event this year. Its more Super-propaganda that is coming BTW the title of this looks a bit like the title of my post last year trashing the supernino, it was April 13, 2014 as it seems like the CFSV2 loves going wild at this time of the year, though the ECMWF is on board to some extent… I like the JAMSTEC as the best of the modeling, in any case this was on Weatherbell almost a year ago today:
SuperNINOBustalicioushypetoomuchadosis Joe Bastardi Apr 13, 2014
In case you need the word separated
SuperNINO Bustalicious hype too much adosis
The Tropical Meteorology Project:
(Dr. Philip J. Klotzbach, Dr. William M. Gray. Colorado State University – CSU)
Extended Range Forecast of Atlantic Seasonal Hurricane Activity and U.S. Landfall Strike Probability for 2015
(.pdf, 9 April 2015):
We anticipate that the 2015 Atlantic basin hurricane season will be one of the least active seasons since the middle of the 20th century. It appears quite likely that an El Niño of at least moderate strength will develop this summer and fall. The tropical and subtropical Atlantic are also quite cool at present. We anticipate a below-average probability for major hurricanes making landfall along the United States coastline and in the Caribbean. Despite the forecast for below-average activity, coastal residents are reminded that it only takes one hurricane making landfall to make it an active season for them. They should prepare the same for every season, regardless of how much activity is predicted.
Information obtained through March 2015 indicates that the 2015 Atlantic hurricane season will likely have much less activity than the median 1981-2010 season. We estimate that 2015 will have only 3 hurricanes (median is 6.5), 7 named storms (median is 12.0), 30 named storm days (median is 60.1), 10 hurricane days (median is 21.3), 1 major (Category 3-4-5) hurricane (median is 2.0) and 0.5 major hurricane days (median is 3.9). The probability of U.S. major hurricane landfall is estimated to be about 55 percent of the long-period average. We expect Atlantic basin Accumulated Cyclone Energy (ACE) and Net Tropical Cyclone (NTC) activity in 2015 to be approximately 45 percent of their long-term averages.
See http://hurricane.atmos.colostate.edu/Forecasts/2015/apr2015/apr2015.pdf
Would it be true to say that the key is how much energy actually enters the equatorial Pacific? As a heat-engine driver? But can we measure it accurately? Brett
Joe Bastardi,
Great weekly video this week on weatherbell.com.
SMH, November 19, 2013:
“Australia will face fiercer El Nino weather patterns – causing severe drought – as a result of human-induced global warming, world-first research led by Sydney scientists has shown.
While the El Nino cycles typically trigger drought in the eastern states, so-called super El Ninos – such as those in 1982 and 1997 – have been detected since the mid-1970s.
“While more frequent eastward-propagating El Ninos will be a symptom of a warming planet, further research is under way to determine the impact of such events in a climate that is going to be significantly warmer than today,” co-author Dr Wenju Cai, a senior scientist at CSIRO, said.”
http://www.smh.com.au/environment/climate-change/australia-to-face-stronger-el-nino-weather-patterns-from-global-warming-20131118-2xrbl.html
20 February 2014, The Conversation:
Should we be preparing for an El Niño in 2014? (Wenju Cai)
“Recently speculation has been rife that the end of 2014 will see an El Niño event — the change in Pacific ocean and atmosphere circulation that is known to produce drought, extreme heat, and fire in Australia.
Given the catastrophic effects El Niño can have, should we be getting prepared anyway?”
https://theconversation.com/should-we-be-preparing-for-an-el-nino-in-2014-23405
February 5, 2015, bloomberg.com: El Nino Forecasts Flop as Puzzled Scientists Wonder Why
http://www.bloomberg.com/news/articles/2015-02-05/el-nino-forecasts-flop-as-puzzled-scientists-wonder-why
SMH, March 6, 2015: El Nino declared as climate scientists watch on with ‘amazement’
“Climate scientists are monitoring this with amazement,” said Cai Wenju, a principal CSIRO research scientist who has published widely on the El Nino Southern Oscillation (ENSO) climate pattern.
“We only understand what we have seen.”
http://www.smh.com.au/environment/weather/el-nino-declared-as-climate-scientists-watch-on-with-amazement-20150306-13wsqe.html
. . .
Footnote, Re: “drought, extreme heat, and fire in Australia”:
April 3, 2015 – 12:55PM, Brisbanetimes:
Twelve southeast Queensland dams are overflowing and might pose a threat to people living downstream.
http://www.brisbanetimes.com.au/queensland/a-dozen-south-east-queensland-dams-overflowing-20150407-1me5d1.html
Handjive.. thanks for a little comic relief.
Ditto.
In this interview (via kenskingdom) on ABC radio @15.00min, 29 March, 2015, Dr Rob Vertessy, Director, Bureau of Meteorology on Sunday Profile explains why questioning the BoM on it’s long term models is a “furphy.”
You be the judge.
(nb. @13.50 note questions on data tampering @BoM)
https://kenskingdom.wordpress.com/2015/03/31/the-bureau-boss-on-temperature-trends-heatwaves-and-climate-change/#comments
There has been a less than expected response by the atmosphere to the oceanic, surface warmth in the Pacific. In fact, the atmosphere over the US this past Winter, acted like it thought we were in a La Nina.
The huge, surprising spike higher in the PDO over the last year, may have peaked in December 2014(2.5) but at +1.5 in March, is still high. Surprising, because it’s coming during a -PDO phase(which is either ending prematurely or doing like the late 1950’s and spiking higher, then going back to a -PDO regime for another 15 years or so).
The only other time we saw +PDO index values this high was in 1997/98 in tandem with the Great El Nino.
Maybe the AMO signal has been more powerful than the PDO recently for US weather.
http://research.jisao.washington.edu/pdo/PDO.latest
mike
. ” The only other time we saw +PDO index values this high was in 1997/98 in tandem with the Great El Nino” Not true, Mike .. Check 1940/1941 PDO levels . Pdo up to 3 and lasting much longer. Remember what happened to Europe and Asia winters .
“Given the catastrophic effects El Niño can have, should we be getting prepared anyway?”
GMST showed no significant warming. With the El Nino confirmed, should we have seen some warming in the record?
It sure is hotting up in CA…
http://s7.postimg.org/hsh35ac5n/multigraph.jpg
That should not be a surprise given the current Pacific Ocean conditions. My outlook from last August on the upcoming winter was that California was going to have a warm winter. It certainly was and that was a nice relief from the previous 3 very cold winters. The change was around +20 F difference.
California has dewatered aquifers, deforested, paved, farmed and otherwise reduced moderating evaporative cooling.
Not to mention NOAAHAHAHA’s propensity to produce warming slanted graphs.
Time for those 40 million ingenious people to be ingenious.
sure the curve would be very impressive if nothing elese but climate would have changed in california..
This time last year they were predicting a whopper too. They better watch it or their reputation is going to start looking like UK Met Office winter forecast reliability.
Martin “It sure is hotting up in California ” , you said . You should be aware that it is sure freezing up in the rest of the country . Many regions in the North east US and Canada had the coldest February ever.
. Despite all the warm SST in the eastern and central Pacific . North America has been cooling since 1998. CONTIGUOUS US is cooling at a trend of 0.48F/decade SINCE 1998 per NOAA.
Regional trend of US Annual temperature anomalies since 1998
8 out of 9 US climate regions show a cooling trend per decade of
• OHIO VALLEY -0.9 F
• UPPER MIDWEST -1.5 F
• NORTH EAST -0.1F
• NORTHWEST -0.1 F
• SOUTH -0.5 F
• SOUTHEAST -.03 F
• SOUTHWEST -0.1 F
• WEST +0.7 F
• NORTHERN ROCKIES & PLAINS -0.1 F
How come you cherry picked 1998? Is it because that was a massive record breaking El Nino? I’ll cherry pick 10 years later with 2008 and see what the trend is per decade. Ohh looky it’s 1.10F/decade!
http://s18.postimg.org/zcvy4p261/multigraph.png
I picked 1998 as the start of my analysis because 1998 is recognized in the scientific community as a climate shift event like 1976. One can find countless number of articles where scientists cherry pick this as key event to study post 1998 climate events from. Some may refer to this cherry picking but this just illustrates the lack of understanding of the critic about the significance of this
See comments from one article below.
“The use of a coupled ocean–atmosphere–sea ice model to hindcast (i.e., historical forecast) recent climate variability is described and illustrated for the cases of the 1976/77 and 1998/99 climate shift events in the Pacific.”
http://journals.ametsoc.org/doi/abs/10.1175/JCLI-D-12-00626.1
One of the shifts that happened after 1998, is that North America’s temperatures slowly started to cool
My reply to those who don’t like 1998, pick your own dates and write an informed article e around them
I posted the information here at this time to bring balance to the discussion about the “heating ‘”up of California. Their water problem is critical and I am sympathetic to their woes but so are the extra cold temperatures, snow, flooding and tornadoes that sweep over US eastern half because of the extra cold spring winds from the north meeting the warm moist air from the south.
Spaatchula;
How about you cherry pick 8000 years ago and see what you get
spaach,
Let’s move away from 1997 then. Five years later we get this.
You lose.
I suspect this might be the last gasp of the current weak El Nino. It has been using the energy stored in the western warm pool over the last year and has not been able to couple to the atmosphere due to warmth in the indian ocean competing for the convective focus. (neg IOD) If the atmosphere does get is act together then we are likely to get a moderate El Nino at the strongest. Super El Nino probably only occur after significant periods of energy accumulation. Cloud decreased by 5% from 1992-2003 and the Super El Nino was the energy dissipation response. A similar shift is believed to have occurred in the late 70s which would time with the 82 super El Nino. El Nino’s dissipate energy, they source it from the Western warm pool thermal energy and gravitational potential energy from the water piled up, along with the kinetic energy from slowing wind circulations, plus some initial positive feedbacks such as disruption of convective cooling. Without a atmospheric connection we are likely to regress back two neutral rather than La Nina IMO. If the atmosphere does connect then its game on for the next super La Nina.
Many regions in the North east US and Canada had the coldest February ever.
=============
And yet, the north east is where all the CO2 is produced??
If my computer spit out a graph like the first one on this post, I would immediately start looking for my mistakes.
Bob wrote:
What’s “boreal springtime” and how does it differ from meteorological spring?
Boreal refers to the Great North Woods and beyond, err, https://www.wordnik.com/words/boreal quotes this from American Heritage:
It seems odd to me to use the northern woods to describe a time period in the tropical Pacific.
monster storms of the past
http://www.weather.com/news/weather/video/monster-storms-of-the-past-in-our-future
http://onlinelibrary.wiley.com/doi/10.1002/2014EF000274/pdf
As an observation, statistical predictions are generally lower than modelled predictions.
I’m only assuming but, perhaps the models actually incorporate ghg effects. Repetition of reality doesn’t.
It is a fact that the solar magnetic cycle has been interrupted. An analogue of what to expect next is the 8200 BP (before present) abrupt cooling event.
http://en.wikipedia.org/wiki/8.2_kiloyear_event#/media/File:Greenland_Gisp2_Temperature.svg
The cult of CAWG would most certainly use a El Nino event or a drought or high rainfall or high snowfall or regional cold weather as further proof that we must spend trillions of dollars on green scams that do not work. I am not sure how they could use a significant drop in planetary temperature as further proof of CAGW.
It is a fact there is cyclic significant warming and cooling (sometimes abrupt cooling events) in the paleo record that correlate with solar cycle changes. The sun is the cause of the majority of the cyclic climate change in the paleo record, including the majority of the warming observed in the last 150 years.
If there is a significant drop in planetary temperature, there will need to be a very quick sciency sounding explanation. There will be much hand wringing as it becomes obvious that the entire set of IPCC assertions were incorrect. We then will need to quickly accept the end of CAGW and quickly move on to discuss an unimaginable climate change scenario. We will need to discuss the implications of significant and dangerous abrupt cooling. It appears a Heinrich event will immediately follow the initial Dansgaard-Oschger cooling. If that assertion is correct we need to determine timing, magnitude, and start making changes to mitigate consequences.
There is a miss understanding, a urban myth, that the glacial/interglacial cycle occurs due to tiny forcing changes (summer insolation changes at 65N for example or a stoppage of the North Atlantic drift current) that are serendipitously amplified by a smart amplification mechanism that appears when required to end and start interglacial periods and then serendipitously disappears to avoid creating large, abrupt planetary temperature oscillations when there is a short term major forcing change such as super volcano eruption. Ridiculous urban legends are accepted as it difficult to even contemplate the possibility that the sun and the stars are fundamentally different than assumed.
P.S.
The 8200 BP event was not caused by a stoppage or a slowdown of the North Atlantic drift current. The assertion that a stoppage or slowdown of the North Atlantic drift current could cause the a significant drop in winter temperatures in Europe and in the Greenland Ice sheet is an urban myth.
http://sheridan.geog.kent.edu/geog41066/7-Overpeck.pdf
http://earthobservatory.nasa.gov/Newsroom/view.php?id=24476
In the south of the jet stream in winter descends farther north Pacific and warm air mass pushes further north. In the south, also starts strong inhibition of the polar vortex, because the magnetic activity of the sun falling.
Sorry, I need more coffee before I can even begin to decipher that sentence structure.
http://earth.nullschool.net/#2014/12/22/1800Z/wind/isobaric/250hPa/equirectangular
Click Earth.
Ric,
ren’s English is probably a lot better than my Polish.
“It is a fact that the solar magnetic cycle has been interrupted”
You keep saying this but what evidence do you have? Looks to me like the pole switch was a little more drawn out than the other three we have data for but now seems to be proceeding normally. Sure, Cycle 25 looks like it’ll be weak but even that isn’t a done deal yet.
http://wso.stanford.edu/gifs/Polar.gif
http://solarscience.msfc.nasa.gov/images/magbfly.jpg
Perhaps this is “normal”.
http://services.swpc.noaa.gov/images/solar-cycle-planetary-a-index.gif
http://www.climate4you.com/images/Ap-Index%20Since199001.gif
http://www.solen.info/solar/polarfields/polar.html
In the context of drawn out Cycle 23 are you suggesting it isn’t? Where is this “interruption”?
http://s4.postimg.org/v6ga41fhn/Ap_SSN.png
AJB April 11, 2015 at 5:23 pm
In the context of drawn out Cycle 23 are you suggesting it isn’t? Where is this “interruption”?
In 2007, 1964, 1932?
Why not 1997? Not that we’re talking about the solar magnetic cycle being interrupted. Perhaps William meant geomagnetic but where is the Ap Index for 8200 BP?
This El Niño is going to turn out to be quite atrocious for them.
I observed about a month ago (?) BOM model selection was predicting a 1.5C event.
http://www.bom.gov.au/climate/enso/#tabs=Outlooks
Shouldn’t such hard to spot El Niños be called “El Ninjas”?
Bob Tisdale,
Hi Bob,
I have tried to find an email address for you, but in vain. You can get my address from Anthony, I am sure, so please send it through him, so we can discuss the SO privately.
Harry
Hi
Jerome
I am a cattle farmer on the south coast of Western Australia
Observation
If it stop rain here shorty after one month El Nenos forecast get stronger.
If it starts raining in about a month El Nenos forecast go away
It’s started to rain?
The continuation of the minimal El Nino and the beginnings of a new potentially stronger El Nino is already leaving its signature in the Out-Going Long-Wave at equator, International Dateline area.
This is really how the ENSO impacts temperatures on a regional, tropical and global scale. There is large continuous convection storms here now and the clouds themselves, holds in all that energy coming off of all that hot water at the equator.
The energy does not get to escape to space as readily as it normally does and this extra energy held in spreads to the rest of the world in a month or two. It takes 1 to 2 months for the large increase in tropical storm activity to develop and then one to two months for the extra heat held-in to spread to the rest of the world. This is the formula for why there is a three month lag from the ENSO to where it starts to impact tropical and global temperature. It is the explanation for why there is a lag.
This chart shows what is going on in this very special region on the planet which is somewhat like the planet’s thermostat but more like the ENSO’s thermostat impacting the rest of the planet.
The changes in Out-Going Long-Wave here are truly massive. +/- 50 W/m2 which completely dwarfs the variability that any other place on the planet has by almost an order of magnitude.
When it is “Yellow”, this means more OLR is gettting out to space than normal and the planet is cooling off slightly. When it is “Blue” less energy is escaping and the planet is heating up.
Right now, we are very strongly into the Blue, some -50 W/m2 time-periods are showing up and global temperatures are now going to be going up fast.
The El Nino is already starting to have an impact which will be apparent shortly.
http://cawcr.gov.au/staff/mwheeler/maproom/OLR/ts.r4.l.gif
Bill in a word you are wrong.
What will determine the strength or lack of strength of El Nino is the SOI INDEX values which are related to the pressure differences between Tahiti, and Darwin Australia, which are related to the amounts of warm water around Australia. The warmer the water is around Australia, the lower the pressure will be at Darwin , in contrast to Tahiti ,which equates to a more positive SOI INDEX which is not supportive of El Nino being sustained much less a strong El Nino.
As of today warm water anomalies rather then cold water anomalies are present around Australia.
Another indicator is angular momentum which is neutral at best. Positive values or heading positive =El Nino, more likely. Negative angular momentum values or heading toward negative values = La Nina, more likely.
http://www.esrl.noaa.gov/psd/map/clim/olr.shtml
To boot recent OLR values increasing in said area Bill references.
Did you look at the recent monthly OLR map from that page, the international Dateline area, pinks and reds are -35 W/m2 to -50 W/m2. Think of those numbers compared to doubled CO2 which is just 3.7 W/m2
http://www.esrl.noaa.gov/psd/map/images/olr/olr.anom.30day.gif