Guest Post by Bob Tisdale
It’s been 25 years since Spencer and Christy of the University of Alabama at Huntsvillle published their 1990 paper Precise Monitoring of Global Temperature Trends from Satellites. The abstract reads (my boldface):
Passive microwave radiometry from satellites provides more precise atmospheric temperature information than that obtained from the relatively sparse distribution of thermometers over the earth’s surface. Accurate global atmospheric temperature estimates are needed for detection of possible greenhouse warming, evaluation of computer models of climate change, and for understanding important factors in the climate system. Analysis of the first 10 years (1979 to 1988) of satellite measurements of lower atmospheric temperature changes reveals a monthly precision of 0.01°C, large temperature variability on time scales from weeks to several years, but no obvious trend for the 10-year period. The warmest years, in descending order, were 1987, 1988, 1983, and 1980. The years 1984, 1985, and 1986 were the coolest.
“…no obvious trend for the 10-year period”, probably didn’t go over too well.
Also see Roy Spencer’s post 25th Anniversary of Global Satellite Temperature Monitoring. There, Roy introduces an interview by Paul Gattis, published at AL.com, titled 7 questions with John Christy and Roy Spencer: Climate change skeptics for 25 years. The interview begins:
The silver anniversary of Roy Spencer’s career-defining moment arrived with no expectation in March. He didn’t realize it until someone mentioned it to him.
For John Christy, he had no idea that a discovery announced in 1990 would not only still resonate 25 years later but would be at the center of a raging debate.
The date was March 29, 1990. That was the day – though unbeknownst to either Christy or Spencer – they publicly became climate change skeptics.
The scientists at the University of Alabama in Huntsville are known throughout the environmental community as being skeptical that climate change (or global warming) will have a catastrophic effect on the earth. The crux of the matter is that their research, using satellite data to measure temperatures in the atmosphere, disagrees with climate models they say that overstates the earth’s warming.
The rest of the interview is here. It’s worth a read. The comments on the thread there contain the usual exchanges between skeptics and the CO2 obsessed.
AND FOR THOSE WONDERING
The current UAH lower troposphere temperature data do show rising temperatures since 1979. See Figure 1, which is from the February 2015 Global Surface (Land+Ocean) and Lower Troposphere Temperature Anomaly & Model-Data Difference Update.
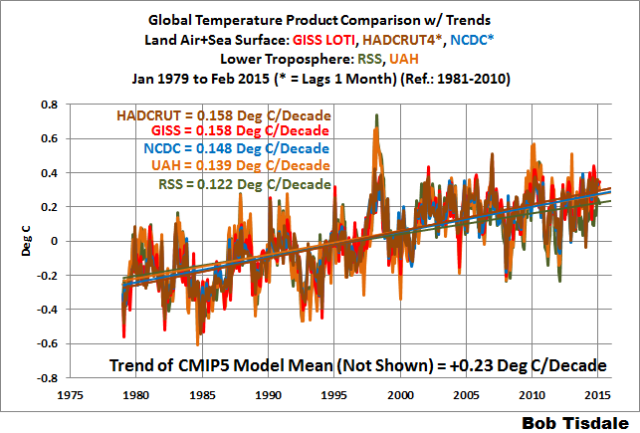
Figure 1
But, with all of the updates and corrections to the UAH TLT data since 1990, do they still show little warming during the period of 1979 to 1988 as noted in the 1990 paper? The answer is yes. As shown in Figure 2, during that period, the UAH TLT data have a very low trend compared to the surface temperature datasets.
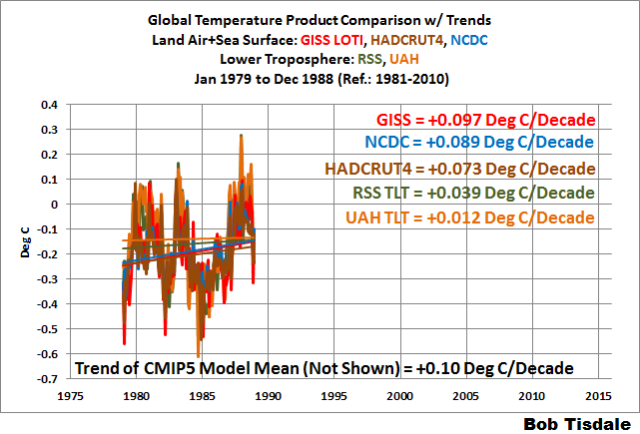
Figure 2
Thanks to John and Roy. I’m looking forward to the corrections in the next version.
Some truths are more inconvenient than others.
The problem is that passive microwave radiometers are passive.
If they were activist then they would see what they are meant to.
“activist…microwave radiometers”
Say, isn’t that used to detect the huge uptick in sea level?
Nope , they couldn’t find any in the raw data
http://jonova.s3.amazonaws.com/graphs/sea-level/axel-morner/satellite-altimetry-se-level-topex-poseidon.gif
So they had to put it in the adjustments
http://jonova.s3.amazonaws.com/graphs/sea-level/axel-morner/sea-level-rise-satellite-altimetry-after-adjustment-500.gif
“…they couldn’t find any in the raw data”
Hey, well that’s because it’s raw data
We all know good data must be cooked to perfection.
The datasets presented here are not the exclusive but complementary. It’s a bit dubious to compare lower troposphere (UAH) and surface temps as if either of them would be right. Wouldn’t the measurements just tell that the warming in the lower troposphere has a different dynamic than warming on the surface?
I might be missing the point but, doesn’t AGW hold that both the surface and, most importantly for the GHG Hypothesis, the lower troposphere?
No. If the lower troposphere stays the same, but surface temp increases, that means the Earth is receiving more heat from the sun. If the troposphere temp increases, then the surface temp would have to go up to keep the same radiant heat driving force, e.g. global warming. Bottom line the satellite data gives us only 2 conclusions: (1) sun is heating the earth more. (2) surface temp data is bogus due to adjustments.
James D says:
Not true whatsoever. The vertical structure of the warming in the troposphere is expected to be pretty much the same, independent of mechanism since it is dominated by the convective effects.
What distinguishes warmer due to solar from warmer due to GHGs is that the former result in the stratosphere warming too whereas the latter lead to cooling of the stratosphere. (In the stratosphere, there is no significant convection.) And, the data is quite unambiguous on what the stratosphere has done over the satellite era: It has cooled. (Some of this cooling is due to decreases in stratospheric ozone, although by looking more closely at the different levels of the stratosphere, at least some differentiation can be made in cooling due to decreases in stratospheric ozone and due to increasing greenhouse gases.
Sorry Joel, I’ve been looking at the Stratospheric data and it would appear that saying “it cooled” is only half the story. The cooling occurred in two step changes at the time of volcanoes. Cooling by CO2 should produce a more gradual change. It’s also obvios from the data that there has been no cooling since around 1995.
Like the complete lack of accelerated warming in the tropical troposhere, the data contradicts the AGW idea.
http://s23.photobucket.com/user/gatemaster99/media/stratosphere.png.html
Well I see a totally different picture in Bob T’s Fig. 1.
I see a flat zero trend from 1979 to about 1993, then an upslope till about 2000, and then level ever since.
Just my opinion of course.
Just as an aside, and not to be controversial, I think Dr. Roy’s “just for amusement” third order polynomial can be made to fit the data of Fig. 1 very closely.
In any case, I think it is a good time to reflect and congratulate Prof Christy, and Dr. Roy for their quarter century of stick to it ness in giving us some actual observed measurements that are not in gross violation of Nyquist, and that seem to have been quite robust over that 25 years.
I think their unexpurgated data, sans smooching; excuse me; that’s smoothing, is likely a good record of what really happened.
I can see no semblance of concordance between this graph Fig. 1 and any or all of the revered 13 / 17 / 19 /whatever climate “models”.
Is here a good place to point out that the Planck formula for Black Body Radiation spectral radiance, is a “Theoretical Model” of a purely fictional concept of a physical body, the like of which exists nowhere in the universe; nor can it, because no real physical material exists that can absorb 100.0 % and reflect 0.0 % of even a single EM radiation frequency (or wavelength), let alone do it for ALL frequencies from zero to infinite frequency (zero wavelength), so BB radiation has never been observed by anyone.
Yet careful measurements of the very common “Thermal Radiation” from real physical bodies, can approach that Planck curve as an asymptotic boundary, over some Temperature and wavelength ranges, as if somehow BB radiation is real.
Only a total drunk at a bar, waiting to hear “Time gentlemen please !” could imagine a similarity between Bob T’s rendition of JC and RS ‘s data and any well cited climate model prediction; excuse me, that’s projection.
When the theory is roughly correct, even when totally fictional, then the actual data will tend to agree with it.
That’s the way science is SUPPOSED to work.
Just my opinion of course; not warranteed for inclusion in your PhD theses.
That description seems more accurate to me, but it raises the problem of uniformitarianism. Linear plots assume a uniform set of operators, behaving in a uniform manner. Step changes and similar singularities call into question assumptions of uniformitarian character.
George, that was my initial observation too. Most of the heating happened in less than a decade.
Thanks for observing the important distinction between a “prediction” and a “projection.” Scientific models make predictions. Climatological models don’t.
Are thermometers activists?
“These days, such an opinion is ridiculed from President Obama on down.”
I would disagree with this statement,the accuracy of the temperature measurement should be represented by: “These days the factual evidence is ridiculed from President Obama on down”
Here’s a new consensus you won’t hear or read about on the MSM:
http://www.forbes.com/sites/jamestaylor/2013/02/13/peer-reviewed-survey-finds-majority-of-scientists-skeptical-of-global-warming-crisis/
2013 dated paper is not exactly a ‘new study’
[trimmed.
By the way, use a real email address before you start cursing. .mod]
I’m not logged in on that website but one of the comments shows a remarkable lack of self- awareness.
Orogeny, mellowed wrote,
If the models (which represent our best hypotheses) actually matched reality then there may be reason think they are not wrong. But they don’t. So why give credence to a an unsupported faith position with no supporting evidence unless your are a religious fanatic?
Also, philosophically, we cant tell what is natural and what isn’t so why assume that the natural is irrelevant? That’s assuming that the climate doesn’t change except by man.
Mann’s hockeystick showed that but that is now pretty much proven to be a hoax on the scale of Piltdown Man. It des seem pretty improbable.
But it’s fascinating that Oregeny can’t allow a sliver of doubt in himself
Let’s compare Oregeny’s position to Ufology.
It is expected that UFOs are real as the universe is so big.
It is expected that the world will warm as CO2 is a GHG.
All other things being equal the life that evolved here will have evolved elsewhere, by definition..
All other things being equal the heat trapped by CO2 cannot be released back to space or blocked from arriving by clouds or any other feedback, by definition.
UFOs would be observed often – it is just coincidence that they appear in isolated places where there are fewer observers and not in crowded cities. We know this because UFOs must exist.
Heat would be observed often – it is just coincidence that it appears in the deep ocean and at the poles where the satellites don’t reach and not near thermometers. We know this because the heat must exist.
Clearly, Oregany can’t allow any doubt because he’s a complete pseudo-science junkie
I’ve seen that exact same comment in several comment sections. I’m pretty sure it’s right out of the paid activists posting guide.
They don’t try it on me at the Guardian. Perhaps they think I may have a persuasive answer? Maybe not
More likely it’s just a meme in US discourse.
It probably comes from a University speaking tour by some greenie.
I’m certainly no defender of Orogeny and his ilk, but- serious question here:
Do we have documented proof of paid climate shills? Receipts, cancelled checks, anything?
Skeptics are accused of being paid by Big Oil, etc. without proof. Let’s not be playing the same game.
Eustace Cranch
Yes. 97% of climate scientists and 100% of Big Government, Big University Labs, and Big Government organizations ARE both employed and funded directly by the Big Government administration that is demanding 1.3 trillion in added tax revenues they can re-distribute to their Big Government voters and employees.
They might not be paid activists, they might be bots –
link
commiebob,
That is a real problem, and it will only get worse. I suppose the answer is to require registration from every commenter, with subsequent verification that they’re not a bot.
“I suppose the answer is to require registration from every commenter, with subsequent verification that they’re not a bot.”
Right… then some govt entity forces them to reveal their membership and we all end up in Camp Hillary.
Eustace, I personally KNOW someone who gets paid to post leftist “talking points”. They get a list of common responses to trigger phrases, and occasionally get vectored to specific sites to engage the “enemy”.
It’s real. And there are a significant number of them. Try following up the huge numbers of “work at home” ads and see what a lot of them want you to do.
M, your reply is perfect,
“If the models (which represent our best hypotheses) actually matched reality then there may be ——–reason think they are not wrong. But they don’t.”
============================================================
I would add,
“What would it take to change your mind, since, in the face of contrary observations, you still have faith in CAGW?”
Classic projection on Oregano’s part, since he’s the one with the belief system.
What they don’t seem to appreciate is that so many skeptic folks used to be trapped in the same religio-scientific faith in climate karma. We already changed our perspective once, and if empirical proof is presented, we must again adjust our thinking to the facts. As reality has not supported model predictions, we are doing what the rules of science demand, and pursuing alternate theories. The hitch is that the restructuring of world power and redistribution of wealth can only work if climate change is mankind’s own fault. That is the reason why CO2 and the greenhouse have been portrayed the dominant feedback, while the other feedbacks are labelled as myths. Anthropological CO2 has become an obsessive diversion and must remain omnipotent in the average population’s perceptions of climate change for political ‘adjustments’to be warranted.
A question for the skeptics here. Is there anything, any information, that could cause you to change your mind? If Spencer and Christy came out tomorrow and said, “Oops. we were wrong.” would that change your opinion? What kind of evidence would it take to do that?
===================
A question for the alarmists here. Is there anything, any information, that could cause you to change your mind? If Gore and Hansen came out tomorrow and said, “Oops. we were wrong.” would that change your opinion? What kind of evidence would it take to do that?
Trenberth tried and failed to reverse the null hypothesis. No matter what else he may say or publish that sounds reasonable, that put him down as a pseudo-scientist in my book.
If Spencer and Christy said “Oops we were wrong” I would ascertain the basis of this change of mind and if I thought the evidence was certain, then I would review all the other evidence in a new light, then if I thought it was overwhelming I would change my mind.
In my view we have to do what is right for the human race both in the present and in the future, impoverishing mankind by having unreliable and expensive energy should only be considered if future generations will suffer as a consequence. I think that satellite atmospheric temperature data is the only data that is accurate enough to tell if the planet is warming, so far it has proved it isn’t, if that were to change then the whole concept of AGW would (in my view) need a re-think!
In IPCC climatology, claims are not falsifiable. Thus, there is not a logical basis for abandoning them. The basis for changing one’s mind would have to be emotional.
“A question for the skeptics here. Is there anything, any information, that could cause you to change your mind? If Spencer and Christy came out tomorrow and said, “Oops. we were wrong.” would that change your opinion? What kind of evidence would it take to do that?”
Authentic observational data!
To this point, the data shows only modest warming that has been beneficial to life on this planet(decreasing some extreme weather). The known law of photosynthesis is clearly providing powerful benefits.
But we continue to live in the “Twilight Zone” of climate science.
Orogeny asks: “If Spencer and Christy came out tomorrow and said, “Oops. we were wrong.” would that change your opinion?”
Orogeny’s phrasing tells us a lot about him. Would I change my mind if Spencer and Christy said they were wrong? No! Why not? Because someone saying something is not evidence. If Spencer and Christy showed WHY they changed their mind, what evidence, what measurements, what data had convinced them to change their mind, then I am certainly open to persuasion. If the DATA looked convincing, I would be convinced — but someone just saying what their conclusion is, is NOT science. Sadly, the majority (and a LARGE majority) of CAGW enthusiasts base their belief not on the evidence, but on whether someone with an impressive job title has declared it to be so. That sort of belief may be popular, but it is certainly not scientific.
Good catch. Yes, skeptics look at the data. The data shows no warming. We don’t care what an alphabet soup agency SAYS, we want to see the data. And sometimes we find fraud in the data, like upside down Tiljander.
Looks like s/he’s just taking “our” arguments and essentially doing a search-and-replace in your first blockquote.
It’s always amusing when the UFO crowd accuses the skeptics of being “unscientific”.
Orogeny’s comment starts out well, “Is there . . . any information, that could cause you to change your mind?” This is the archetypal Popperian question; skeptics often ask it of warmists, and skeptics especially should be willing to entertain it. But the follow up is whether the skeptics would change their minds if Spencer and Christie did. In other words, he expects skeptics to be responsive to an appeal to authority, one of the weakest forms of argument in science. Back to the drawing boards on that one!
Trolls,
This is how you thread-jack.
Why does figure 1. above show 0.4 degrees of warming, while this figure shows <0.2 degrees of warming for the same period (1979 to 2014)? Both are from UAH:
http://media.al.com/news_huntsville_impact/photo/christy-chart-378a82c81b59f099.jpg
J. Philip Peterson, my graph, Figure 1, is for the lower troposphere, while the graph you presented is for the mid troposphere.
J. Philip Peterson, PS: The actual trends of the RSS and UAH mid troposphere temperature anomalies: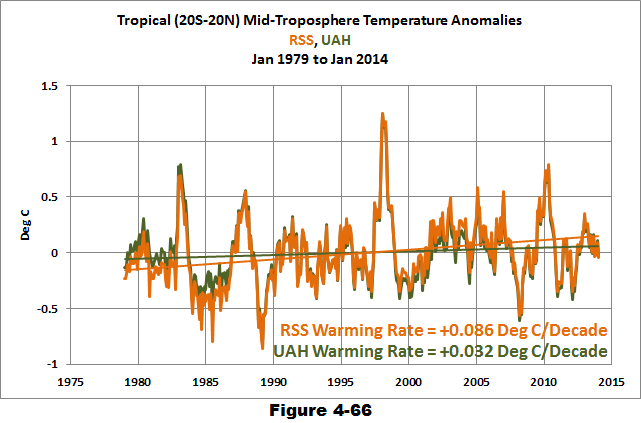
Thanks. I didn’t catch that the plots were from two different areas of the Troposhere. I measure temperature all of the time in my job and I find it absolutely amazing that the balloon data sets and the satellite data sets match so closely (and in fact all of the data sets, in absoulte terms, are very close)!
Oops, just noticed that the graph above in my 5:55am comment is for tropical TMT. The following illustrates global TMT:

J. Philip.
That is a good question! The plot that you presented shows an average of two satellite data sets, UAH and RSS. As strange as it may seem to us, the UAH data set administered by “skeptics” shows more warming than the RSS satellite data set administered by “warmists.” The average of the two data sets shows less warming than the UAH data set alone. Also, the plot that you show are yearly averages and the plot that is shown in the story are monthly averages. Yearly averages puts the data through a filter that tends to eliminate the extremes. The average of the two satellite data sets does seem to match well with the 4 balloon datasets… that may be one reason why the two satellite data sets are averaged.
The slopes for RSS and UAH are 0.086 and 0.032 in the graph presented above by Bob Tisdale.
There is no statistical difference between these numbers. The slopes are simply no different from zero.
It is unfortunate that Bob Tisdale presents tons of such graphs with no statistical analysis and then this starts all kinds of discussions. Simply there is NO difference between the two data sets.
Can you please post the original graph that shows all observed data sets and the different climate models?
Looks like you picked the lowest observed data and the highest change rate model.
If thats not cherry picking…
what in my post above caused it to be moderated? i didn’t use any of your “verboten” words that i know of…
[Reply: There have been a few questions about moderation hold lately. This will help explain some of it. As one of the moderators I don’t know the answer to your question above (there are about a half dozen different moderators). Only the boss or WordPress can place someone in moderation hold. We don’t know all the ‘verboten’ words that WordPress uses to flag a post. We do not always understand why WordPress diverts a comment into the Spam folder to wait for manual approval. It often appears random and arbitrary. Next, site policy states that respect will be given to those who don’t hide behind an anonymous screen name. Others who use screen names either have provided Anthony with verifiable evidence of their identity, or their email address identifies them as someone we know. There are sometimes legitimate reasons for readers to not want their identities publicized, such as jeopardizing their employment status because of their opinions. Where those reasons are not the case, complaints about moderation hold from anonymous posters are not entertained. Commenting here is a privilege, not a right. For most commenters, the current system is much better. Formerly every comment had to be manually approved. But that was changed after the Climategate emails were published. When that happened we began receiving more than 1,000 reader comments a day, and several more moderators were added. Now most comments are posted automatically, unless WordPress shunts it into Spam for some reason. In that case there will be a delay until we rescue and post it. ~mod.]
Thank you for the explanation mod. its much appreciated and clarifies for others (as well as myself of course) the moderation process.
Ignoring CMIP which is an outlier for average temperature rise per decade 1979 to present, and taking the worse case of the data sets that are within hundredths of a degree of each other and assuming that trend continues for another 100 years, global temperature would rise 1.5 degrees.
So lets look at the 100 year period 1900 – 2000. Electricity availability became ubiquitous, first man-made flight occurred followed by intercontinental flight ubiquitous, two world wars, entire planet is networked allowing cheap access to global communication, news and data, many lethal diseases have been eradicated, organ transplants are common, slavery internationally abolished, Satellites, GPS ubiquitous, space flight, we went to the moon, invention of the nuclear bomb, abstraction and then conceptual art becoming the norm, everyone carries a globally networked pocket computer in the form of a cell phone, the age of terrorism bloomed, modern skyscrapers sprouted all over the world, we had two major major financial collapses, depression and recessions, an assassinated president, womans sufferage, feminism, countless regional wars, the creation of the movie industry, CGI taking over the movie industry, average life spans increasing, the global economy, Rock&Roll, HipHop, sparsely held B&W TV with a couple of channels to HD digital cable with 100s of channels ubiquitous, and many more great and awful life changing events.
With the pace of technology increasing, national and international politics never certain, and many more significant paradigm shifting, life changing events likely to occur, why should anyone be concerned with perhaps global temperature increasing 1.5 degrees over the next 100 years? (the 25 year trend may or may not continue whether human or natural cause)
Is the AGW scare a bad joke that got out of hand?
Alx says, “Ignoring CMIP which is an outlier for average temperature rise per decade 1979 to present…”
Alx, a clarification. CMIP stands for Climate Model Intercomparison Project. The CMIP5 trends listed on the graphs are the average of the climate model simulations of surface temperatures from the Climate Model Intercomparison Project, version 5, which are the models used by the IPCC for their 5th Assessment Report.
Your use of the word “outlier” gives the impression that the CMIP5 trends are based on data, like those shown for the 5 datasets in Figures 1 and 2. Climate model outputs are not observation-based data.
What are the goals? For Obama, it is the further control of the means of production and, of course, taxes, direct and hidden. For the UN, it is income redistribution. The CAGW scare affords the platform for both. If AGW turns out to be a secondary effect in the climate change “world”, as I believe, and CGW doesn’t occur, they can claim their measures prevented it.
For Obama, it is the further control of the means of production and, of course, taxes, direct and hidden.
============
No. Obama is not concerned with that. He is concerned with his image.
He will make a bad deal with Iran, which will politically strengthen the Iranian government and their support for terrorism across the middle east. It will not in any way stop Iran in its development of nuclear weapons.
The Iranian government will not respect the terms of the agreement, because they see America as unworthy. The Iranian people will see the Americans as weak for capitulating, and the Iranian government will look like victors to their people and to their supporters across the middle east. This will be a huge political victory for Iran.
Neville Chamberlain made this same mistake with Hitler in 1938. Driven by his own vanity, Chamberlain announced “Peace for Our Time” and WWII was the result.
“””””…..
ferdberple
April 2, 2015 at 6:43 am
For Obama, it is the further control of the means of production and, of course, taxes, direct and hidden……”””””
Ferd,
The Persians invented the game of chess. And yes, I am old enough to remember Neville Chamberlain’s great deal that he made. Can’t quite remember if he traded away “Lebensraum” in Czechoslovakia, and some place else as part of the deal.
I assume that some similar “other people’s property” will accompany Obama’s “piece in our time.”
g
Nope, it is an invaluable tool for the introduction of Agenda 21. That sounds like tin foil hat stuff but in reality if you read the whole Agenda 21 on the UN website you can see for yourself how clearly it is laid out.
The stated objective of Agenda 21 is for the UN to take control of all of the Earth’s resources in order for them to be utilised in a sustainable manner. Sounds great doesn’t it, until you realise the implications of that noble cause.
0.012c / decade – the oceans will boil I tell you! 🙂
Eric in about 70,000 years assuming:
a) An average ocean temperature of 15 celsius now.
b) We continue to produce CO2 at the present rate AND that CO2 is responsible for ALL GW.
c) Predicted level of 106,000ppm (317ppm in 1960 400ppm now)
Too many if’s and buts as far as I concerned!
“…Predicted level of 106,000ppm”
But wouldn’t most of us would stop producing CO2 around the 70,000 PPM mark?
in about 70,000 years
===========
I’m pretty sure everyone reading this will have stopped producing CO2 in much less than 70,000 years.
And assuming that the 960,000ppm on Venus is the cause of its high temperature at its surface as opposed to the 92BAR of pressure and the 96 times atmospheric mass.
“I’m pretty sure everyone reading this will have stopped producing CO2 in much less than 70,000 years.”
Bah, details…
I’ve got a question for the alarmists (who, in reality, are the true deniers as they simply deny reality. How interesting that they painted non-believers as deniers.)— what do you think those who don’t believe in AGW have to gain? The answer, absolutely nothing but they risk their livelihood for saying what they believe, some no one in the AGW camp has to worry about, at least not until 2016.
what do you think those who don’t believe in AGW have to gain?
Why, Obscene Corporate Profits, of course. Duh.
‘”That’s the great thing about politics. People throw out these platitudes and you could read into them whatever you want. It’s so generic or non-specific in the thing that they’re saying that you can interpret it anyway you want. You turn it into your own thing because you fill in the details.’
If you want to educate the young generation about what politics is in reality, make them discuss that paragraph lifted from the interview.
YOU FILL IN THE DETAILS.
Politicians let you be misled, because it suits their narrow interests that you are. The media do the same, because they pander to their readers’ prejudices. Schools do the same, because they are controlled by the politicians. Even business does it too, because for many of them, contracts can only be won if you are misled.
Excellent point. I often use a similar argument to why real science rarely gets reported.
If I measure a black body for a period of time and find out that it is black (i.e. does not produce radiation in the visible spectrum) then I can say that “black is black”. However, what I can really only say is that “black is black for the system I was measuring over the time period I monitored it”. Which of those two statements would get more attention? Which one gets repeated in the press? Which one gets extrapolated to provide someone with an agenda with a “scientific statement”?
The reasons I enjoy interviews like this are:
It shows Spencer & Christy don’t have horns, are thoughtful and are not Big Oil shills.
Scientists can be part of the 97% but not accept CAGW.
They have personal knowledge that there are skeptics inside government who have some reservations themselves about the alarmist narrative. Anyone who has ever worked in large organizations, government or politics intuitively knows this has to be true. Those who have not, refuse to believe it.
The links within the link were also informative. All in all, some great stuff.
The warming trend since 1979 is a cherry-pick though. That pesky, roughly 18-year “pause” is there, gumming up the Climate Liar’s works.
For clarity please record when the satellites started measuring.
Bruce, why is the 1979 start year of the TLT datasets a cherry-pick? I can’t go back any further in time.
It’s one by happenstance. IOW, it is meaningless in terms of indicating what the climate may be doing.
Bruce. So when would you like to start? 10,000 years ago? And what proxy shall we agree to? And what portions of the world. Or we could start in July 2014 and stop in December 2014 and measure only North America. Or maybe we should just measure the output of the sun based on …
No, hang on. Let’s just wait until we have 100 years of good satellite data and then we can decided what is going on.
Well, off to feed my livestock in the snow, if my tractor will start. Plugged it in 3 hours ago. Not much CAGW here. 😉
I think what Bruce is saying is that 1979 happened to be a low period, the bottom of the cooling from the blip” that the CAGW scientist found so annoying, the beginning of positive ESNO cycles, so a cherry pick by happenstance, or, in other words, a reason the 30 year definition of “climate” is wrong, and 60 years is a minimum.
Say Bruce; why don’t you ask when the first satellite data became available to these chaps ? That could be quite a revealing question.
Now I know that it didn’t start before 1957, because I happen to know that I personally made the very first public pronouncement, in a public newspaper announcing when the very first earth artificial satellite could be publicly viewed in my native country, and that was in 1957, and that satellite did not make Tropospheric Temperature readings.
I was so spot on, that thousands of persons climbed numerous local volcanic peaks to watch it go by. Me; I was asleep in bed, and had to wait till the second night of my prediction to go see it myself.
g
@george e.smith. Thanks, that brought back memories. Although I was only six years old I remember having my parents drag me out to try and see it ( just like the rest of the rest of the west they were frightened as I was) and a brother (vainly) trying to hear it on a shortwave receiver, Although even today I still go out and watch satellites and ISS come over every time I get a chance
“””””…..
asybot
April 2, 2015 at 8:34 pm
@george e.smith. Thanks, that brought back memories. …..”””””
As I recall, Project Rearguard; excuse me, that’s Project Vanguard, was going to transmit on 40 MHz, but Sputnik instead broadcast on 20 MHz, so we had to modify some digital equipment that was going to make Doppler shift measurements, and we used a short wave receiver to listen to the beeps, in the Radio-Physics Department at the University of New Zealand; Auckland Campus (now U of A). From the ionospheric data, we predicted the radius of the radio horizon around the U, and used the length of time of the passage beep, to fit a sequence of passages to the radio circle, which told us where the transits were and how much they slipped from orbit to orbit.
I happened to be the poor sap on watch when the Auckland Star called at noon, and asked when people could see the satellite. Since the next transit due, appeared to be going straight through the center of the circle, I guessed it would go overhead that night at around 8 PM, and carelessly told the caller (reporter) that.
So my prediction “By the Radio-Physics Department of the Auckland University”, was published on the front page of the six PM edition of the Auckland star, and people thronged up Mt Eden and Mt Albert, and One Tree Hill, to get a gander.
By HS luck, the call was dead on, and everybody figured we must know what we were doing. I saw it clearly in a different place next night.
I guess the first few Vanguard flights were fired into the ground, instead of into orbit.
g
PS Never talk to a reporter on the phone; or anywhere else.
What is it the microwaves are being emitted from that the passive sensor detects? Is it O2? and what is the temperature per frequency for O2 or whatever it is detecting?
yes, the sensors monitor the intensity of microwave thermal emission from molecular oxygen. If the whole atmosphere were to warm by 1 deg. C, the measured brightness temperature would warm by 1 deg. C. Calibration is 2-point, with the cold cosmic background (2.7 K) and an onboard-high-emissivity calibration target whose temperature is monitored by redundant platinum resistance themometers.
Thank you. Appreciate the information.
Roy,
Izzat a rotational mode of the O2 molecule; and secondly, how does that intensity vary with Temperature ( does it follow From Planck BB formula, or otherwise ?)
Don’t know enough Physicists that I could ask that of, besides you.
G
There are so many questions I’d love to hear the answers to.
Question(s) 1:
The UAH and RSS Lower Troph records have drifted apart by about 0.15C (roughly) over the last 10 years.
This inconveniently causes one to see either 1) a complete pause in global temps over the last 18 years (RSS) or 2) Global Warming over this period of something like 1.5C/century and we’re all doomed (UAH).
These are wildly different outcomes, and a serious point of contention with my eco-terrorist friends.
Is the difference between the RSS and UAH records statistically significant?
If so, how can accuracy of 0.01C be claimed? Should they not be measuring the same thing?
Is one more “right” than the other?
Question 2:
How will UAH/RSS continue to get government funding if a catastrophic global temperature rise is not reported? 🙂
Oh – and thanks for doing what you do Drs. Spencer and Christy!
You asked:
“Is the difference between the RSS and UAH records statistically significant?”
The answer is NO. The regression lines presented in the above graph by Bob Tisdale are not different from zero and there is no difference between the two sets.
stay tuned. Our trend will be changing with version 6.
Wallensworth asks excellent questions.
“The UAH and RSS Lower Troph records have drifted apart by about 0.15C (roughly) over the last 10 years.”
Actually, it looks like they drifted relative to one another by about 0.1 degree from 1979 to 2000 and then in the other direction by about 0.2 degree in the other direction since 2000. I’ve read that the difference is in the corrections made for things like decaying satellite orbits.
“Is the difference between the RSS and UAH records statistically significant?”
Definitely; at least if you base the statistics on the scatter in the data.
“If so, how can accuracy of 0.01C be claimed?”
I don’t think anyone claims that accuracy. The data are reported to two significant figure to avoid degrading the precision by rounding. The accuracy is clearly no better than about 0.1 C, but the precision might be better.
“Should they not be measuring the same thing?”
I think so.
“Is one more “right” than the other?”
I think the UAH folks say the UAH analysis is more right and the RSS folks say their analysis is more right. Perfectly normal in science. They should eventually get it sorted.
The satellites are measuring something different from the surface. I find a trend 10% to 20% less from the satellites than surface T.
There is a very easy way to verify statistical significance. Don’t claim there is one until you print the results.
No point in questioning accuracy until you run the data via least squares regression analysis and print the R squared result. Easily done by just using Excel. Elementary statistical analysis.
Mike:
You’re entirely correct in your assertions about the patent differences in the relatively short time-series. Unfortunately, there are many whose comprehension of “statistical analysis” fails to go beyond the simplistic trend plus white noise premise of linear regression. Yearly-average temperature variations do not conform to that premise nor to “red noise” models. They contain demonstrable multi-decadal and longer oscillations, rendering highly moot the “confidence intervals” of fitted linear trends, especially over time-intervals as short as the satellite record. There simply is insufficient data to determine anything resembling a truly secular trend.
“””””…..There is a very easy way to verify statistical significance. ……”””””
The important words are ….. “statistical significance” ……
Statistical significance is a defined property of statistical mathematics. It is not a property of the data; but of the algorithm. Well and what people imagine it tells them.
“The UAH and RSS Lower Troph records have drifted apart by about 0.15C (roughly) over the last 10 years.”
Actually, No they haven’t. They have actually drifted together !!
RSS started slightly warmer, and had a bigger step at the big El Nino. Now they are closing that gap.
http://woodfortrees.org/plot/rss-land/from:1979/plot/rss-land/from:2001/trend/plot/uah/from:1979/plot/uah/from:2001/trend/plot/rss/from:1979/to:1996/trend/plot/uah/from:1979/to:1996/trend
The question skeptics here is what is going to happen to these temperature series (UAH and RSS) when Roy Spencer and John Christy retire?
Will they be taken over by warmists who have a penchant for ‘adjustments’ and are fond of cooling the past in order to make the present look hotter?
Ooops! … question for skeptics …
UAH Update: “We’ve adjusted the satellite data to better match surface observations.”
Question…..looking back….why is anybody scared of a measly 0.02 >0.10 C temp change? Plus or minus? Don’t know where the rest of you live, but I go through bigger temp changes then that just going from my living room to the bathroom! And yeah, its snowing here, so even more temp change. I guess that is what happens when its -5C outside. Oh wait. Our normal is -7c at this time of year? Run away. We are all gonna fry! Isn’t it time to cut the heads off these chicken littles?
Geesh! With all the Big Oil money, you’d think they could afford better clothes and a bigger office.
hey, I resemble that remark!
Something rarely touched on is the effect of water content in the air. The presence of moisture substantially increases the ENTHAPY (in simple terms, the total energy) of the air even if the air temperature is the same in all cases. Doesn’t this inconvenient fact make the simple averaging of temperature (from whatever source) a pointless exercise?
Ian M
There you go again, bringing science into things. But yes, the real question is one of the total energy balance of the earth. To a first order that corresponds to temperature, but as you point out, only to a first order.
The two questions that need to be answered (or predictive hypotheses constructed, really) are:
1) Is the incoming energy changing? If so, what predicts it well.
2) Is the outgoing energy changing? If so, what predicts it well.
The escathological cargo cult of the CAGW ignores the first question, and muddles the second in a religious manner.
Here is an interesting take on that question.
https://www-pls.llnl.gov/?url=science_and_technology-earth_sciences-moisture
and the “money shot” is
“The atmosphere’s water vapor content has increased by about 0.41 kilograms per square meter (kg/m²) per decade since 1988, and natural variability in climate just can’t explain this moisture change. The most plausible explanation is that it’s due to the human-caused increase in greenhouse gases.”
But how an “area” has “mass” must be the new science they are using.
Thats a good observation. I also wonder if they adjust the overall mass of their (probable ) cubic meter of air downwards because as we know the higher the moisture content the lower the mass of the air.
Call me skeptical that this increase was actually a measured increase in water and not a increase in a bunch of models that were then use to calibrate the satellite data showing proving how smart they are at predicting water would increase, due to Co2.
I still regard it as very unfortunate that the old NEMS and SCAMS data has not been re-analyzed and tagged on the beginning of the record. Both instruments were operational for a long time. This would extend the microwave record back to the early 70s.
yes, I agree. I don’t know whether the data even still exist. Trouble is, we have barely enuf funding to just keep doing what we do already.
simple, open source your code.
@Stephen Mosher
How would open source code resolve the issue of the possible missing old NEMS and SCAMS data?
It is futile, but fun, to speculate what would have happened if, say, Phil Jones or Kevin Trenberth had thought of the idea instead of Christy/Spencer.
Would they have decided to a) ignore the issue and stop making the calculations, b) make with the adjustments, c) decide that climate catastrophism wouldn’t fly, d) something else?
How about… d). They switch the demonizing over to particulates by declaring anthro-induced smoke has offset the greenhouse effect and will now tip the scales to cooling the planet too much, if we don’t get on board with aerosols too. This would spark new economic opportunities in the particulate removal (scrubber, etc.) industry and drive fossil fuel costs up to the point that green alternatives look less futile. It retains human culpability and is comic book enough to capture the public fancy.
[sorry, that’s “drive fossil-fueled power generation costs up…”]
I like the term “CO2-obsessed” to refer to CC alarmists, as it gets straight to the point (their claim that CO2 is evil and a pollutant and that it must be reduced) and then we can mention the rising PPM but stable temps.
Well these days it is best described as “Carbon-obsessed.”
Meanwhile the UN under-reports deforestation rates in order to maintain member state vote balance on other issues. This amounts to allowances for obvious human caused impact in order to maintain the carbon cause and cite human caused impact in the policy areas that gen up the funding stream. You can’t get more callous than that road map of greed.
And in addition, the UN fails to allow for forestation rates to offset CO2 emissions, and this works to the detriment of both the USA, and New Zealand, neither of which is a net carbon source. In fact the USA is the only sizeable land based carbon sink, because of our intensive forestry farming, and other agriculture.
How about Canada? Often accused of being the largest abusers re carbon use ( but with 10% of the USA’s population but with a larger landmass and similar ag and re-forestation projects/capita?)
“””””…..
asybot
April 2, 2015 at 8:44 pm
How about Canada? …..”””””
Roger that Asybot. Canada would benefit greatly by some degrees of global warming.
And I have driven the AlCan highway, through the Yukon etc., so I know what a bunch of trees looks like.
g
Figure 2 is nonsense. That would be obvious if Tisdale bothered to put error bars on the slopes, as would be consistent with best scientific practice. All the slopes are consistent with each other and with the CMIP model mean. The 95% confidence intervals are in the range of 0.08 to 0.10 K/decade.
One does not refute bad science with bad science. That is something that Spencer and Christie understand, unlike Tisdale.
CMIP trend is 0.23K/decade. UAH is .012K/decade. RSS .039K/decade. I am not surprised that the adjusted surface data supports the models. That’s kind of the whole point. The satellite data shows the models fail.
I agree Figure 2 is nonsense, as far as drawing any conclusions.
It simply presents the data, nothing more and nothing less.
Yes, adding confidence intervals would be nice but what is needed here is to get the R squared values for each linear least squares regression analysis of the data sets and then statistical analysis to obtain the level of significance (if any) between each data set.
A competent statistician familiar with such analysis would just look at the Figure 2 and tell anyone that there is no trend for any of the data sets and furthermore there is no statistically detectable significant difference between these data sets, before running any statistical analysis. Easy 100/1 b
Exactly: one does not refute bad science with bad science. Drawing conclusions from any of the presented data sets shown without appropriate statistical analysis is wrong.
Since the CMIP model mean isn’t plotted on Figure 2, that’s quite a leap. However, if you’d like to go down to the graph posted by J. Philip Peterson, you’ll see that the model mean divergence is now about 0.6K, and it certainly hasn’t been 6 decades from 1979. Additionally, Hansen and others claimed that there was a “built in” rise of at least 0.2 per decade for the first twenty years of the current century, even if CO2 output crashed to zero. Well, we’ve burned the “business as usual” scenario and then some and the current rate of rise is between 0.122 and 0.158 per decade. Now, bear in mind that that’s going all the way back to 1979. If you were to start at say 2000, the slopes would be far less. And if you think 15 years isn’t long enough to get good data, remember the warming hysteria was fueled by only about a 17 year stretch of rising temperatures.
My question is why hasn’t the UAH v6 been out long ago? My suspicion is that the UAH and RSS datasets will now be indistinguishable, giving the warmists an excuse to cry “conspiracy.” S&C, man up! Get your new dataset out and take the flack!
It’s very close to release now. *Hopefully*, days rather than weeks. My post that accompanies it will explain why it has taken so long.
Hallelujah!
….For John Christy, he had no idea that a discovery announced in 1990 would not only still resonate 25 years later but would be at the center of a raging debate……
__________________________________________________________________________________
I know this part for a fact. My office was right down the hall from Dr. Christy’s at the University of Alabama in Huntsville Research Institute in 1988. At that time Dr. Christy was looking for some old data tapes regarding satellite temperature data. It was hard for him to find and then get the data read. It was at this point I found out that there is a huge preference in the scientific community to move on to the next project and not to “waste time” going through old data.
It was at this time I was also struggling to get image data from the Lunar Orbiters for my research on lunar exploration. It was conversations with Dr. Christy and McNiter that first got me interested in going back to get the old tape data from the Lunar Orbiter missions.
I remember when Dr. Christy published his paper and the furor that erupted afterward. What is not stated here is that Dr. Christy was hammered even then and was hauled before a Senate Committee chaired by A Senator from Tennessee, Albert Gore Jr. That paper single handedly slowed down, temporarily, the AGW juggernaut of the era.
I remember afterward it was hard for Dr. Christy to get funding. One of the University of Alabama System board of trustees was Gary Neil Drummond, owner of Drummond Coal, one of the largest coal companies at the time in the world. Drummond wanted to give Christy money but said that if he did, it would forever taint any science that Christy would do. It was Alabama congressmen who helped to get the Center for Global Hydrology set up and to help fund research in Climate Change at UAH.
This was all the while that Al Gore was funneling millions of dollars for super computers to Kevin Trenberth (Who was Christy’s thesis advisor) at the University of Michigan.
All Christy did was publish a paper that took satellite data and honestly put it out there for discussion. He got sucked into the maelstrom of the AGW mafia of that era and has been forever changed by that experience. He stuck to his science, which is the highest compliment that you can make to a scientist.
Thanx Dennis, what an interesting piece of the scuttlebutt you were in the midst of.
That is why I come to WUWT, to find out what really happened out there in the trenches, from people who were there.
G
Thanks Dennis, great stuff!!
Dennis is re-discovering old lunacy tapes, too.
==========
Thanks guys. Well done
+10
Question for Dr. Spencer and Dr. Christy, if they’re following this thread.
Your satellites operate by measuring outbound “microwaves” but I’m not entirely clear what that means. Can you tell me if your satellites (any satellites) are monitoring long wave radiation in the so-called “atmospheric window” frequencies and the H20 and CO2 “opaque” radiating bandwidths? Do we or can we measure whether or not the atmospheric window frequencies increase in intensity over warm surface areas? It seems to me that the whole issue of CO2 driving climate change depends on the so-called pressure broadening of LWIR opaque frequency bands, but if the “atmospheric window” frequencies get brighter or more intense in spite of such broadening, wouldn’t any broadening effects would be mostly or entirely negated?
What would be beneficial is for both UAH and RSS to release the code they use to take data from sensors and turn it into a temperature product. That way people could see EXACTLY what is done at every step.
And while we are at it, NCDC should do exactly the same thing. Their adjustment process has never been replicated either. They always refer people to their papers for the process, but papers are not code.
The code is there. run it.
Isn’t much of the NCDC’s programming work done by outside contractors?
if a tree falls in the forest and no one is there to hear it does it make a sound?
Two wrongs don’t make a right. And climate science can boast far more than that.
Everyone should make all their code available for review.
NCDC code:
ftp://ftp.ncdc.noaa.gov/pub/data/ghcn/v3/software/52i/
RTFM here:
https://www.ncdc.noaa.gov/monitoring-references/faq/anomalies.php
“””””…..
Steven Mosher
April 3, 2015 at 7:09 pm
if a tree falls in the forest and no one is there to hear it does it make a sound?…..”””””
No it doesn’t. it does make a longitudinal compressive wave in the atmosphere, but the proof is in taking a stone deaf person out there in the forest, for when the tree falls.
They hear nothing because they lack the mechanism in the ear and brain, that DOES make a sound when the tree falls in the forest.
ALL human sensory perceptions are psycho-physical creations of our various sensors, and our brains; they aren’t creations of the physical universe.
Hydrogen sulfide emits NO manifestation of its presence, that could be called a smell or an odor. But it can react chemically with sensory surfaces in our nose and maybe tongue, that along with our brain creates the perception of rotting eggs, that we call a smell.
there are thermal emission bands at many frequencies, IR, microwave, etc. At terrestrial temperature most of the emission is in the IR, but a small amount is in the microwave. The O2 absorption band complex in the 50-60 GHz region has been used for temperature sounding of the atmosphere since the 1970’s, like the IR absorption bands (mostly CO2) have been used as well. In fact, the single most important satellite input into numerical weather prediction has been the microwave-based temperatures.
The microwave absorption complex is much better behaved than the IR bands…the weighting functions (determined by the oxygen absorption coefficients) are almost independent of temperature, so a change in atmospheric temperature leads to an almost 1:1 change in satellite observed brightness temperature.
I assume we will be releasing the Version 6 code. I believe that the Version 5 code has been archived at NCDC for some time now, but that will be a moot point soon. The Version 6 code is much cleaner, organized, etc.
I hadn’t thought of this before now, but it would seem likely that the temp of Co2 and O2 molecules in the atm could easily be different because of the differing spectral response of the two. Would this explain the differences the the two satellite temp series as compared to surface temps?
“””””…..micro6500
April 2, 2015 at 10:22 am …..”””””
Well the CO2 molecule is about one in 2500 of the atmospheric molecules which means it is about 13.6 layers of molecules in between one CO2 molecule and its nearest neighbor CO2 molecules, on average.
So one CO2 molecule doesn’t even know there exists another like it.
So there is NO CO2 Temperature that is different from the O2 Temperature.
The equi-partition principle says that the mean energy per degree of freedom is kT/2. This manifests itself in different mass molecules as a different velocity.
Temperature is a macro property of vast numbers of “particles”. It has virtually no meaning for any single molecule.
g
george e. smith commented
Let’s see if I can be clearer, and then see if what i said makes any sense.
in your example of one Co2, let’s call it a single Co2 molecule floating in isolation in a field of mainly N2 and O2.
Absent any photons in any absorption bands, wouldn’t the molecules adopt the same KE (ie temp)?
If I’m right so far, then imaging IR that was in the absorption band of the Co2, but not the O2 (or N2), wouldn’t those photons interacting with the Co2, change it’s KE (whether higher or lower)?
“”””””…..
micro6500
April 2, 2015 at 3:00 pm
george e. smith commented …..”””””
micro, As I see it, the Temperature of a gas, implies that individual molecules can have a Maxwell-Boltzmann distribution of kinetic energies, that is a Temperature dependent function, but the mean energy per degree of freedom, is kT/2 for all of the molecules present. If they are more massive, they have a lower velocity, or if they have a higher rotational moment of inertia, then they have a lower angular rotation rate. Now all of that is changing at lightning speed as the molecules collide with each other and exchange energies between the colliding molecules.
One can make the argument, that any single molecule will OVER TIME occupy every possible energy location in that M-B distribution, at some time or other. So one could say that a single molecule in effect has a Temperature that is measured by the over time distribution of its KE in that M-B distribution, so it is a time averaged Temperature. Well I have made that argument at times. But normally, Temperature is defined as a property of the assemblage and not the individual molecules. So it is that random and chaotic KE motion that we call “HEAT” (noun). Because it is a random, and unpredictable motion, you can never martial all the molecules to go in the same direction so that their KEs add up and can perform useful work. So that is why “heat” can never be entirely converted to mechanical work, or to any other form of energy. Heat is the garbage of the Energy realm.
Now back to the radiation flux. The interception of a photon by a molecule (GHG or other) is a SINGLE MOLECULE event. It is unrelated to the Temperature of the gas. If the photon is absorbed because it is at some molecular resonance frequency, the molecule will oscillate in whatever way that photon energy excites, but it will do so, in such a way that the center of mass of the molecule is unaffected by the photon energy, so the heat content of the molecule would seem to be unchanged. And subsequently the molecule will likely radiate a very similar photon, probably as a result of getting clobbered by another molecule in a collision. In the stratosphere with low collision rates, the excited state may decay spontaneously. I personally don’t see why the photon absorption changes the Temperature at all.
But I am not a quantum mechanic, and maybe one of those folks can explain why the gas Temperature would change, because of the absorption or emission of a photon of either IR or microwave energy.
So I don’t get the atmospheric heating by GHGs at all. But I DO believe that the radiative escape delay, that results from the photon capture, results in warming (By the surface), because the sun is adding solar energy to the surface during that delay time, so it should run at a higher Temperature.
Now I don’t really understand exactly how Dr. Roy’s Oxygen thing works. I can see that if the Oxygen is at a higher Temperature, then the radiative emission lines could be broadened due to Doppler, and maybe that raises the Brightness (Radiance).
Now let me be clear; I don’t doubt for an attosecond, what Roy says, I just can’t make the claim that I understand how it works, but I’m very confident that it does. And because its in the microwave frequency region, that’s what caused me to ask Roy somewhere around here, whether that is some rotational mode, of the excited molecule rather than a translational one.
Diatomic molecules (dumbells) have two perpendicular modes of rotation, which presumably are degenerate, in that they both produce the same frequency, but both of them have to be accorded their kT/2 contribution to the total KE of the gas. I guess it is assumed that the third rotation mode about the axis of the molecule (joining the atoms) isn’t there, because the moment of inertia about that axis is rather small, so the rotation would have to be at an astronomical angular rate to give any angular momentum.
One of these days, a light will go on, and I will figure it out. Unfortunately, none of the Physics PhDs I know, could give a rats about such things, so it is useless to ask them. Well they probably did their PhD theses on something about which they know the sum total of all knowledge there is, and moreover are the only person who has any interest in that specialty, so nobody is going to pay them for what they know.
If I was any good at googling, which I am not, I could probably find a paper on Oxygen microwave thermometry. Some folks try to call foul because they are flying some PRTs on the satellite, and they wonder how anyone knows they are accurate. That’s a red herring. People know how to use PRTs to measure Temperature, and where the hell their lab happens to be, is rather irrelevant.
Just look at all the stuff astronomers figure out, and there’s no way they can twiddle any knobs out there in their laboratory. They pretty much get all of their information from EM radiation.
Thanks George.
Let me add my thoughts to your post.
I’m pretty sure there is a probability a captured photon will sometimes be thermalized, so I imagine a sea of gases at some temp, where if the IR flux is high enough for some period of time, the Co2 in the gas is a different temp statistically from the say O2 molecules.
This a similar to I believe water molecules having to be 212F to be a gas, so water vapor and N2 at the surface temp have to be at a different effective KE. Correct?
Am I a “true” sceptic if I ask if V6 is “modeled” on V5?
micro6500,
I read somewhere recently that very high in the atmosphere, Kirchoff’s Law breaks down. If your question has an affirmative answer, that would be the first thing I’d look at.
“””””…..
Brandon Gates
April 2, 2015 at 10:34 pm
micro6500,
I read somewhere recently that very high in the atmosphere, Kirchoff’s Law breaks down. If your question has an affirmative answer, that would be the first thing I’d look at…….”””””
There is a plurality of “Kirchoff’s Laws.”
The one relating to the equality of spectral emittance to spectral absorptance applies ONLY under equilibrium conditions.
Nothing in earth’s atmosphere is ever in equilibrium. The rotation ensures that is so.
g
george e. smith,
Thank you, I’ll be mindful to be more specific in the future.
Check.
Yes of course, it really would be silly to do a radiative transfer problem on two points separated from each other by … the planet itself. Not so silly to break the problem into parts small enough to make reasonable calcs assuming LTE, and then integrating. Not that it’s an easy thing to do …
http://www.cesm.ucar.edu/models/cesm1.0/cam/docs/description/cam5_desc.pdf
… but at the very least one can see that a few folks have done some pretty extensive thinking about it. Let’s see, CAM 5.0 uses a line-by-line radiative model discussed by Iocano, et al. (2008), Calculations with the AER radiative transfer models: http://www2.mmm.ucar.edu/wrf/users/docs/Iacono_etal08.pdf
Makes good nightstand reading … puts me right to sleep.
Anyone can obtain the raw satellite data from NCDC and try their hand at a better satellite product. BUT….it’s many gigabytes, and you have to know what you are doing regarding radiometer calibration and to make adjustments for known demonstrable effects (calibration differences between successive satellites, orbit decay, diurnal drift, etc.). Arguably, only 2 groups with extensive experience with satellite data and instrumentation (UAH and RSS) have been successful, and get substantially the same results, despite some differences in methodology. It’s very easy to get bad results if you don’t know what you are doing.
“It’s very easy to get bad results if you don’t know what you are doing.”
I agree 97 +/- 3%. It’s also not that hard even if you DO KNOW.
Paradoxically, the personal outcome appears somewhat independent of whether you get it right. A poor application of Principle Component Analysis can leave you not recognizing the forest because of that darn Yamal tree, but you may become a star.
Happy Easter to you, John & Roy!
The big problem with Tisdale’s graphs is that he uses only 10 years of data, not nearly enough to get a decent trend. Here are the best fit slopes for Jan. 1979 through Dec. 2014, with 95% confidence intervals estimated as twice the standard error, based on scatter. Data sets can be found at Climate Explorer http://climexp.knmi.nl/selectfield_obs2.cgi?id=someone@somewhere
First the surface T data sets, slopes in K/decade:
BEST_1: 0.164 ± 0.013
BEST_2: 0.148 ± 0.012
HadCRUT: 0.157 ± 0.012
GISS: 0.157 ± 0.012
NOAA: 0.148 ± 0.011
These are all consistent with a surface trend of 0.155 K/decade.
Satellite data:
UAH: 0.139 ± 0.016
RSS: 0.122 ± 0.016
Somewhat lower than the surface T trends, but they are not really measuring the same thing.
Recently I was thinking about one thing, warmist claim that Earth is doomed by burning fossil fuels and releasing CO2. So just count: weight of Earth atmospehere is 5.15×10^18kg. Reserves of oil are 2.3 x 10^14 kg. Reserves of coal are 9.48 x 10^14 kg. Reserves of natural gas are 1.3 x 10^14 kg. That makes total 13.08 x 10^14 kg of C equivalent. Carbon is 27% relative weight of Carbon Dioxide. That makes weight of CO2 for all fossil reserves 4,84 x 10^15 kg. This is 0.00094, or 0.094% or roughly 940ppm. Current content is 400ppm plus reserves of 940ppm is 1340ppm total. This is final number of CO2 in air available from fossil reserves. We can live with 400ppm and we can definitely live with 1340ppm. This level will of course not happen as man will never release all C reserves and plants are permanently storing this C back to the ground.
So there is fixed point in future with maximum CO2 content, maximum Earth Temperature and corresponding climate. We simply can not cross this point.
Simply because of this whole theory of runaway greenhouse effect induced by Man is wrong.
The observation that 1/2 of what we are supposedly putting into the atmosphere is immediately disappearing, so at best we might get to 870 if we really put our hearts into making the world a better place!
Peter: There is considerable uncertainty about the real reserves actually are, but here is a paper that looks at things out to 2300 if we burn the estimated fossil fuel reserves and they get a number around 1400ppm, like you: http://caos.iisc.ernet.in/faculty/gbala/pdf_files/Bala_etal_JCLIM05.pdf They also find it would lead to a very, very different climate.
Yes they found after tons of counting that 1400ppm of CO2 will cause increase in radiative forcing of 10.5W/m2. And thus increase in temperature of 8K. This is quite logical, if overall radiative forcing is around 260W/m2 and average Earth temperature is 15C – 288K increase of 10.5W would mean increase of temperature around 11K, this more less corresponds with 8K found in your document and they are stating that their temperature is still rising, so let’s assume 11K. But there is fundamental problem with radiative forcing. 70% of Earth is covered with clouds and is excluded from radiative forcing, as light must reach surface for transforming to longwave radiation. Otherwise it is radiated back to space (cloud albedo is close to 1). So again simple math only 30% area of Earth is absorbing incoming radiation (not 100% of course). So overall effect will be only 30% of 11K. That is 3,3K.
I’m fine with that increase.
Yes there are big uncertainties about real oil reserves and there are other things like releasing CH4 from permafrost or peat deposits which can be eventually used. But this is compensated by other uncertainties like CO2 fertilization, increasing of biomass, increasing effectvity of plants to process CO2.
This will on the end null each other and my counts will not be far from true…
Peter: The whole albedo of the Earth is only ~30% and part of that is provided by ice and such, so I don’t see how you get 70%. It is more like 20-25%.
Furthermore, I don’t understand why you think that there being clouds somehow allows you to exclude this fraction of radiative forcing. It is not relevant in the slightest. The forcing is the total additional radiative power imbalance at the top of the atmosphere divided by the surface area of the earth.
Besides the accuracy of the toa measurements is 4 or 5 times larger than the forcing from Co2, so there no telling what the actual balance is.
Peter: “70% of Earth is covered with clouds and is excluded from radiative forcing, as light must reach surface for transforming to longwave radiation. Otherwise it is radiated back to space (cloud albedo is close to 1)”. So it is pitch black on a cloudy day? Funny how I never noticed that.
I think we speak about the same. 70% of Earth area are clouds close to albedo 1, 30% rest mostly water close to 0 albedo, total albedo around 0.3, you say more like 0.25.
About radiation forcing: area of Earth is 4*pi*r2, it is receiving radiation by circle cut pi*r2 so difference between insolated area and total area is exactly 4. Power of Sun radiation is 1300W/m2, divided by 4 on square meter of Earth it is 325W/m2. 260W/m2 of them can reach surface, rest is reflected to space or absorbed in atmosphere.
So my counting of radiation forcing is correct, because I got number which is well known – 260W/m2
And this number represents average energy falling on Earth surface through CLEAR sky. But when there is cloud present, top of the cloud has albedo close to 1, that means that practically all light energy is reflected back to space, almost all of 1300W/m2 of sun’s energy is reflected to space without changing to heat. Assuming there is little of atmosphere above clouds remaining.
Without changing sun radiation to heat – longwave radiation CO2 could to trap and reradiate, there is practically no effect of greenhouse gasses above clouds.
Clouds are working like insulation, keeping infrared heat below them and reflecting sun radiation from above preventing to change it to infrared heat.
This is why we can count only 30% of total radiation forcing, because rest is reflected back to space without heating Earth.
Same as we can count only 30% GNG effect, because rest is nullified by cloud effect reflecting all IR radiation back to surface below and back to space above. IR wavelength window is closed there.
Mike, try to find on internet how much power is in diffuse light when it is overcast. It is somehow around 50W/m2 this is much lower than 1000W/m2 on direct sun. So it is only around 5% of sun radiation available under cloud. It will move whole picture only little bit. Eye is btw. very sensitive organ, daylight intensity is 120,000 lux, vs. full moon 0.25lux 480,000 times less and you are still able to see.
Joel, the sheer degrees of freedom value due to known and unknown variables, over-parameterized data, and infill errors make any proposed climate scenario to be laughable and speaks of very poor acumen in the vagaries and limitations of statistics. Modelers that attempt to read the taro cards, tea leaves and palm lines of Mother Earth should just admit their snake oil research, put up a tent and don a fortuneteller turban.
“””””…..
joeldshore
April 2, 2015 at 5:48 pm
Peter: The whole albedo of the Earth is only ~30% and part of that is provided by ice and such, so I don’t see how you get 70%. It is more like 20-25%……””””
I think Peter’s 70% cloud cover is a bit high. I believe I have seen a NASA / NOAA figure of 60-65% which surprised me as being that high.
And if Peter is using “albedo” as a synonym for “reflectance”, then it is nowhere near one for clouds; only a few percent in fact (at visible wavelengths).
Water droplets strongly transmit and refract visible light, converting it from a near collimated (0.5 deg divergence) beam into a strongly focused broad beam of the order of a radian (in a single refraction). This rapidly becomes a totally isotropic flux distribution in just a few sequential refractions, so no more that 50% could be returned to space.
It’s a bit more complicated with ice crystals instead of droplets, but Peter is way off with his 100% cloud albedo (or reflectance).
And I also think total ice albedo is way overblown too. Fresh snow decays in a few hours in terms of reflectance (which is also scattering), because of surface melting, and that results in TIR trapping, so snow / ice reflectance of solar visible wavelengths very quickly becomes similar to grass. Some of the near IR part of the solar spectrum, gets strongly absorbed in both clouds and snow/ice.
g
It’s been 25 years since Spencer and Christy of the University of Alabama at Huntsvillle published their 1990 paper Precise Monitoring of Global Temperature Trends from Satellites. The abstract reads (my boldface):
Passive microwave radiometry from satellites provides more precise atmospheric temperature information than that obtained from the relatively sparse distribution of thermometers over the earth’s surface. Accurate global atmospheric temperature estimates are needed for detection of possible greenhouse warming, evaluation of computer models of climate change, and for understanding important factors in the climate system. Analysis of the first 10 years (1979 to 1988) of satellite measurements of lower atmospheric temperature changes reveals a monthly precision of 0.01°C, large temperature variability on time scales from weeks to several years, but no obvious trend for the 10-year period. The warmest years, in descending order, were 1987, 1988, 1983, and 1980. The years 1984, 1985, and 1986 were the coolest.
“…no obvious trend for the 10-year period”, probably didn’t go over too well.
Indeed it didn’t, mainly because the results were wrong! Subsequent papers by about three groups (including Mears et al., which resulted in RSS) showed different results and led to errors being identified and corrected by S & C. Including a significant contribution from the stratosphere which ultimately led to the development of the composite product TLT, and orbital decay (0.10 correction). The diurnal correction error led to a 40% correction in the trend (0.035).
Phil, as Bob Tisdale pointed out in the original post, even the latest versions of the RSS and UAH datasets have trends for 1979-1988 which are not statistically different from zero. We both correct for all known errors in the data, and the RSS dataset is more cited than ours because it shows the longest period of no warming.
And you conveniently left out the MSU instrument body temperature effect, which mostly offset the orbital decay effect on LT. Maybe because you didn’t know about it, since we didn’t make a huge deal out of it like the alarmists did with orbit decay, which has been central to every alarmist’s website talking points on the subject.
Roy,
You seem to imply that the corrections did not alter the trends that much. I don’t think that is correct. When I looked at it several years back (using whatever version of the UAH was available at that time), I found the following:
* Your 1998 paper said that, prior to the update in the analysis that was presented in that paper, the trend for January 1979-April 1997 was -0.076 C/decade.
* I found that the trend in the “current version” (at the time I did the analysis, early 2009) for that same period was +0.029 C / decade.
* The trend in the “current version” (at the time I did the analysis, early 2009) for the entire period of data through Dec. 2008 was +0.127 C / decade.
So, to summarize: The best estimate of the trend had changed by +0.203 C/decade. Of that, 0.105 C/decade was due to changes in the analysis and 0.099 C/decade was due to having a longer data set. Or, in other words, the very substantial change in the trend was basically due half to changes in the analysis and half to having a longer data set.
I am not sure how much this may have changed if you repeated this analysis that I did 6 years ago, but my impression is that any updates that you have made since then have had only a small effect on the trends.
By the way, this is the paper I am referring to: http://www.homogenisation.org/files/private/WG1/Bibliography/Applications/Applications%20(C-E)/CHRISTY_etal_1998.pdf
The relevant sentence is in the conclusions: “The combination of these changes causes the 18+ year trend of T_2LT to be warmer by + 0.03 C /decade (-0.076 to
-0.046C / decade for January 1979–April 1997).”
Roy, I was pointing out that the initial analysis had errors in it which were eventually corrected by you as a result of critiques from other researchers, e.g. Wenz & Schabel who reported that correction for orbital decay changed the trend to +0.07.
Of course if you reduce the period enough then the trend will not be significant. I appreciate you don’t like publicizing your errors but in the interests of transparency that should be done, you were very reluctant to admit the possibility that your original results could be wrong. Perhaps you should have a readily available page which itemize all the corrections and changes made in your analysis?
For about ten years you misapplied a correction by subtracting it instead of adding it (pointed out by Wentz). As a result you made the claim: “The net global effect of these revisions (version D) is small, having little impact on the year-to-year anomalies.”, which was incorrect.
Later you said:
“An artifact of the diurnal correction applied to LT has been discovered by Carl Mears and Frank Wentz (Remote Sensing Systems)………… The new global trend from Dec 1978 to July 2005 is +0.123 C/decade, or +0.035 C/decade warmer than v5.1”.
Hats off and a standing ovation for Spencer and Christy!
Dennis Wingo (up thread @ 8:51am) provided the perfect honorific:
He stuck to his science, which is the highest compliment that you can make to a scientist.
Spencer and Christy,
To honor you two most effectively and most enjoyably then you two need to be in a pub with me (and many others who comment here) !
John
Regression analysis of RSS from Jan 1979 to Dec 1997 does not show any warming trend. I got -0.002 C / decade.
Of course we all know the 18-year pause in 1997-2014. It appears the warming trend in 1979-2014 is due to the 1998 super El Nino.
Yes. No surprise from regression analysis, with and without including El Nino.
So if you extend the trend line out for 10 decades (100 yrs) it results in between 0.5 C (UAH warming rate) or 0.78 degrees C (RSS warming rate). What’s the big fuss all about?
Isn’t that what the warmists are essentially doing – extending their trend lines out 100 years?
What the modelers do is extending the trend lines from the different models, not from actual temperature (surface or satellite) measurements as you show in the graph you posted above. The models are failing.
Here are the numbers.
1. We have reliable data for atmospheric concentrations of CO2 (CCO2) from Mauna Loa starting in 1959. There is an almost linear increase in yearly CO2 concentrations until now. By “almost” I simply mean the increase was a little bit slower from 1959 to about 1972, but not by much. Graphs of such data have been widely presented and a yearly increase in CO2 is not disputed.
2. Take the surface temperature anomalies (T) of any data set from 1959, for example HadCRUT4 and plot the data with CCO2. Basically you will see a correlation between the increase in T and CCO2 increase only between the years about 1977 and 2000 (give or take) and this is statistically significant. Between 1959 and 1977 there is an actual slight decrease in T while CCO2 increased (I don’t know if this trend is statistically significant). Then between 2000 (give or take a few years and El Nino problem) and now, CCO2 continued to increased but T no longer increased.
Again a number of graphs have been presented showing such there is no more correlation between CCO2 and T.
So, the claim that CO2 is responsible for temperature increase and we must stop using fossil fuels is now in question.
So the modelers are now at an impasse. They must start adjusting the models to fit the actual data.
They are even in more difficulties if instead of using surface temperature data they would use satellite measurements, as shown by the graph you posted above.
No…It gives a warming 1.2 C to 1.4 C (for the lower troposphere)….Not sure how you got your numbers. I get mine by multiplying the trend in C/decade by 10.
And, no, predictions of warming are not based simply on linear extrapolation of the trend for 100 years.
Yes, I just multiplied by 10 to get 0.5 to 0.78 – it’s as simple as that,t what did you multiply by to get 1.2 – 1.4 C???
Sorry, but anyone who extrapolates linearly outside the range of data in a chaotic, cyclic system, is a mathematical ignoramus.
I used the trend for UAH and RSS for the entire satellite record that is shown in Figure 1 of this post, i.e., 0.139 and 0.122 C per decade, respectively.
joeldshore commented
Curious, why would you take a 30-40 year period that clearly has a step function as it’s main “feature”, linearize it, and then extrapolate it out for 100 years, and then imply it means anything?
micro6500 April 3, 2015 at 8:23 am
Why don’t you ask J. Philip Peterson, it was he who’s making the extrapolation?
He did, fair enough, But joel did counter with the same.
micro6500 April 3, 2015 at 10:08 am
He did, fair enough, But joel did counter with the same.
No Joel queried the values used and also stated that “predictions of warming are not based simply on linear extrapolation of the trend for 100 years.”
micro6500: It doesn’t “clearly have a step function” in it. One can produce artificial data with a perfectly linear trend + random noise and find such supposed step functions.
The reason we look for a linear trend line is that the data isn’t good enough to support fits with more parameters, so the best one can do is pull out a linear trend.
joeldshore commented
I think we actually do have enough surface station data (daily min/max temp) from say 1950 onward to tell a lot more of what is going on than we get by comparing a global temperature average.


You can look at the daily rate of change, the annual average of change, yesterday’s rising temp vs last night’s falling temps. If you calculate a slope of each years daily rate of change, and then plot that for each year since 1950, it shows a curve (that peaked about the same time temps peaked), much cooler than a straight line.
I wish our two satellite stars had pointed out that the much-ballyhooed “97%” number came from an entirely bogus “study” that has been rounded debunked and discredited.
/Mr Lynn
I was just saying that if you extend the temperature lines out 100 years you get 0.5 to 0.78 degrees C. I didn’t say that this is correct or that that is my prediction. I don’t like being called an “ignoramus”, or a denier for that matter… It could be +3 degrees C or -3 degrees C – or maybe more each way, we don’t know. And the so called climate scientist really don’t know…
[snip wildly off topic, irrelevant, and highly likely just another sock puppet of Doug Cotton posting from NSW -Anthony]
I suspect that the WUWT Cotton Filter may have sprouted a leak.
Thanks Joel, on it.
Mods, the post by Questioner is by the internet pest D O U G C. He has been infesting Roy’s blog with hundreds of posts with his usual nonsense and has stalked Roy here.
“A question for the skeptics here. Is there anything, any information, that could cause you to change your mind?”
But I DID change my mind.
I was not born skeptic !
What would have made me KEEP my mind:
– accelerated rising seas
– accelerated rising temps
– undisputed temp measures
– hotspot
– water vapor feedback and steady relative humidity
– arctic and antarctic meltdown
– disappearing snow at my latitude
– tropical diseases at my latitude
– undisputed hockey stick graph (with the CO2-T time lag in the right direction!)
…
Failing to see any such evidence (but the Arctic I would say), I DID change already !
What’s your point?
“Passive microwave radiometry from satellites provides more precise atmospheric temperature information than that obtained from the relatively sparse distribution of thermometers over the earth’s surface”.
I know this claim by Dr Spencer is now dated (1990). But is there any scientific literature to back this claim up? Dr Carl Spears of RSS says the opposite in his blog, he trusts the surface measurements more than the free air measurements.
Dr Carl MEARS – sorry.
Well there likely is a good deal of scientific literature to support Dr. Spencer’s assertion.
Central to that literature, would be the general theory of sampled data systems, which governs all modern high capacity digital communications; such as supports this internet capacity.
The Nyquist sampling theory that is central to sampled data, would say that any earthbound global Temperature measurement system, is simply garbage, as the spatial sampling regimen is orders of magnitude short of what it needs top be. And the Temporal sampling based on a daily min / max record, taken at quite uncontrolled time epochs is also deficient.
What satellite systems do allow Christy and Spencer, as well as RSS to do, that earth based systems do not, is at least sample (by scanning) a near complete global surface, so that at least one can claim that their readings are at least valid data.
So they may be subject to instrumentation errors (what experimental systems are not), and possibly even calibration errors. (what is your better calibrated system; a thermistor ??). But in the absence of correct sampling regimen, the data is garbage anyway.
So I’ll bet on the satellites.
Any references to published scientific literature then?
According to his Wikipedia entry, Spencer advocates intelligent design as a reasonable alternative to evolution. Sorry, but this is someone who does not understand science and makes it difficult to take any of his findings seriously. Those findings may be absolutely correct but it damages their credibility.