By WUWT Regular “Just The Facts”
We are pleased to introduce WUWT’s newest addition, the WUWT Northern Polar Vortex Reference Page. We would like to dedicate this page to NBC News and John Holdren, who both seem to need all the help they can get in understanding Polar Vorticity.
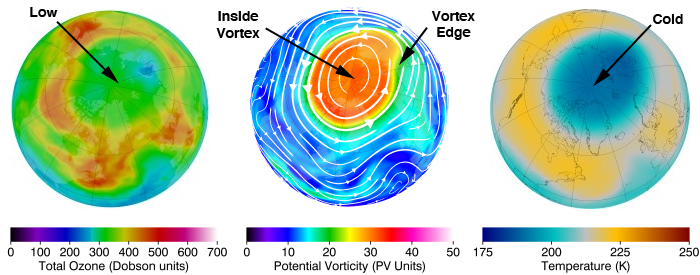
“The stratospheric polar vortex is a large-scale region of air that is contained by a strong west-to-east jet stream that circles the polar region. This jet stream is usually referred to as the polar night jet. The polar vortex extends from the tropopause (the dividing line between the stratosphere and troposphere) through the stratosphere and into the mesosphere (above 50 km). Low values of ozone and cold temperatures are associated with the air inside the vortex.” NASA
“Polar vortices are ubiquitous atmospheric structures. In the Solar System, Earth, Mars, Venus, (Jupiter ), Saturn and its moon Titan are known to have well developed vortices in their polar regions at high altitude. These swirling structures are not always present in the atmosphere of a planetary body at all seasons, but they generally form in the winter hemisphere, when the latitudinal equator-to-pole temperature gradients are the strongest. For Earth, Mars, Saturn and Titan, therefore, the axial tilt determines the presence and seasonal variability of their polar vortices. This can be observed, for instance, by looking at the seasonality of the maximum speed of the circumpolar jets (see [6] for examples related to the Earth and Mars). Venus has a negligible axial tilt; therefore one would expect that the seasonality of its polar vortices is absent. Nonetheless, their seasonality seems to be induced by a dynamical phenomenon, linked to the presence of a quasi-bidiurnal oscillation at mid-latitudes, and extending to high latitudes, rather than by the obliquity of its rotation axis. This oscillation is observed in numerical simulations with global climate models, although its signature depends on the model as well as on model initialisation. A quasi-bidiurnal signal seems also to be present in some analysis of spacecraft data from Venus Express (see for instance [1]), although it has still to be understood whether its nature and origin are common to the oscillation observed in numerical simulations.” European Planetary Science Congress (Links and Jupiter added within)
Polar Vortices are “caused when an area of low pressure sits at the rotation pole of a planet. This causes air to spiral down from higher in the atmosphere, like water going down a drain.” Universe Today
“Long-term vortices are a frequent phenomenon in the atmospheres of fast rotating planets, like Jupiter and Saturn, for example. Venus rotates slowly, yet it has permanent vortices in its atmosphere at both poles. What is more, the rotation speed of the atmosphere is much greater than that of the planet. “We’ve known for a long time that the atmosphere of Venus rotates 60 times faster than the planet itself, but we didn’t know why. The difference is huge; that is why it’s called super-rotation. And we’ve no idea how it started or how it keeps going.
“The permanence of the Venus vortices contrasts with the case of the Earth. “On the Earth there are seasonal effects and temperature differences between the continental zones and the oceans that create suitable conditions for the formation and dispersal of polar vortices. On Venus there are no oceans or seasons, and so the polar atmosphere behaves very differently,” says Garate-Lopez.” Phys.org
“The stratospheric polar vortex shows quite a bit of day-to-day variability. This variability is caused by weather systems or large-scale waves that move upward from the troposphere into the stratosphere. In the left image (9 January 2010), we see some undulations along the edge of the polar vortex, but the vortex is generally centered on the North Pole. Two weeks later (center image on 23 January 2010) we see the center of the polar vortex pushed away from the North Pole. On a constant latitude circle, PV values are high in the eastern hemisphere and low in the western hemisphere. This is referred to as a wave-1 pattern (a wave-2 pattern can be seen in the vortex breakup section below). The wave-1 pattern develops in the troposphere and moves upward (propagates) into the stratosphere.
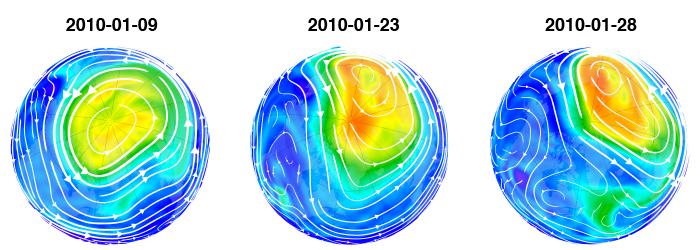
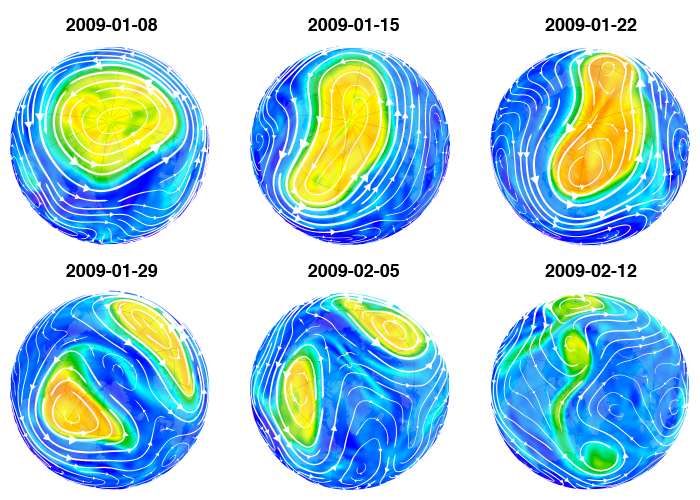
These stratospheric waves are forced by the large-scale mountain systems and the land-sea contrasts between the continents and oceans. During the northern winter, these waves are continuously forming and moving upward into the stratosphere. The waves can “break”, much like the waves on a beach. These wave-breaking events erode the vortex and keep the polar region warmer and ozone amounts higher. Often, parts of the polar vortex are pulled away from the main vortex. The image on the right (28 January 2010) shows this, where a large piece of the polar vortex was pulled away from the main vortex (green colored material at the bottom of the image). A comparison between the middle and right images also shows a slight contraction of the polar vortex because of these waves.”
“The polar vortex is a winter phenomena. It develops as the sun sets over the polar region and temperatures cool. During the spring, the sun rises and the absorption of solar radiation by ozone begins to heat the polar stratosphere. This heating eventually causes the vortex to disappear along with the polar night jet. However, this process is helped along by planetary-scale waves that propagate up from the troposphere. This wave event that drives the vortex breakup (or final warming) acts to also increase the temperature of the polar region and ozone levels. We mark the day of the vortex breakup when the winds around the vortex edge decrease below a particular value (about 15 m s -1on the 460 K potential temperature surface).”NASA
WUWT Northern Polar Vortex Reference Page offers focused view on the Northern Polar Vortex, whereas the WUWT Polar Vortex Reference Page offers a more broad overview of Global, Northern and Southern Polar Vorticity. When time permits, there will also be a WUWT Southern Polar Vortex Reference Page forthcoming. The following are some observation on recent Northern Polar Vortex activity from the WUWT Polar Vortex Reference Page:
Northern Hemisphere Temperature Analysis at 10 hPa/mb – Approximately 31,000 meters (101,700 feet) shows a high level split within the Stratospheric Polar Vortex on January 11th, 2014:
")
The split is also visible in Ozone Mixing Ratios at 30 hPa/mb – Approximately 23,700 meters (77,800 feet);
50 hPa/mb Height Analysis at Approximately 20,100 meters (66,000 feet):

70 hPa/mb Height Analysis – Approximately 18,000 meters (59,000 feet);
and 100 hPa/mb Height Analysis – Approximately 15,000 meters (49,000 feet):

Northern Hemisphere Area Where Temperature is Below 195K or -78C shows significant warming in the last few days;
")
The Vertical Cross Section of Geopotential Height Anomalies shows that the Polar Vortex has weakened significantly and the Arctic Oscillation swung to negative:
")
“The Arctic Oscillation refers to an opposing pattern of pressure between the Arctic and the northern middle latitudes. Overall, if the atmospheric pressure is high in the Arctic, it tends to be low in the northern middle latitudes, such as northern Europe and North America. If atmospheric pressure is low in the middle latitudes it is often high in the Arctic. When pressure is high in the Arctic and low in mid-latitudes, the Arctic Oscillation is in its negative phase. In the positive phase, the pattern is reversed.
Meteorologists and climatologists who study the Arctic pay attention to the Arctic Oscillation, because its phase has an important effect on weather in northern locations. The positive phase of the Arctic Oscillation brings ocean storms farther north, making the weather wetter in Alaska, Scotland, and Scandinavia and drier in the western United States and the Mediterranean. The positive phase also keeps weather warmer than normal in the eastern United States, but makes Greenland colder than normal.
In the negative phase of the Arctic Oscillation the patterns are reversed. A strongly negative phase of the Arctic Oscillation brings warm weather to high latitudes, and cold, stormy weather to the more temperate regions where people live.” NSIDC

In terms of why the Polar Vortex weakened and split, and the Atlantic Oscillation swung negative, there are likely several factors. the first being Planetary Waves, i.e. “The polar stratosphere and mesosphere are dynamically altered throughout the winter months by planetary wave activity and its interaction with the mean flow. An extreme interaction leads to polar vortex breakdown and a complete alteration in temperature from the lower stratosphere through the upper atmosphere. However, there are more regular disturbances where the dynamical interactions can alter the upper stratosphere and mesosphere without modification to the lower stratosphere; here these disturbances will be designated as Upper Stratospheric Lower Mesospheric (USLM) disturbances.” American Geophysical Union, Greer et al.
“The polar winter middle atmosphere is a dynamically active region that is driven primarily by wave activity. Planetary waves intermittently disturbed the region at different levels and the most spectacular type of disturbance is a major Sudden Stratospheric Warming (SSW). However, other types of extreme disturbances occur on a more frequent, intraseasonal basis. One such disturbances are synoptic-scale “weather events” observed in lidar and rocket soundings, soundings from the TIMED/SABER instrument and UK Meteorological Office (MetO) assimilated data. These disturbances are most easily identified near 42 km where temperatures are elevated over baseline conditions by a remarkable 50 K and an associated cooling is observed near 75 km. As these disturbances have a coupled vertical structure extending into the lower mesosphere, they are termed Upper Stratospheric/Lower Mesospheric (USLM) disturbances.”American Meteorological Society Conference, Greer et al. 2013
Recent Planetary Wave activity can be see on this Zonal Wave #1 Amplitude Jan, Feb, March Time Series;
Zonal Wave #2 Amplitude Jan, Feb, March Time Series;
and Zonal Wave #3 Amplitude Jan, Feb, March Time Series:
Another likely factor that weakened and split the Polar Vortex is Eddy Heat, i.e. “strong negative fluxes indicate poleward flux of heat via eddies. Multiple strong poleward episodes will result in a smaller polar vortex, Sudden Stratospheric Warmings and an earlier transition from winter to summer circulations. Relatively small flux amplitudes will result in a more stable polar vortex and will extend the winter circulation well into the Spring” NOAA
Here you can see that 10 day Averaged Eddy Heat Flux Towards The North Pole At 100mb neared a record daily maximum in early January:
A third potential factor in Polar Vortex behavior that has been proposed is that “geomagnetic activity (used as a measure of solar wind parameters)” plays a role in the “variability of large-scale climate patterns and on changes in the global temperature. We have found positive statistically significant correlations between global temperature and the distribution of surface temperature over Eurasia, the East and Equatorial Pacific and over the North Atlantic for the period 1966-2009 correspond to large-scale climate patterns defined by climate indices. We found very similar positive correlations between geomagnetic activity and the distribution of surface temperature in the mentioned regions. As an effect of geomagnetic storms, energetic particles penetrate from the magnetosphere into the region of the stratospheric polar vortex. The increase of temperature and pressure can be observed over northern Canada. The vortex shifts towards Europe, rotates counter-clockwise and the wind blows from the polar region over Greenland southwards. It diverts the warm flow proceeding northward over the Atlantic, eastward along the deep Icelandic low extending as far as the Barents Sea and takes part in warming Eurasia. The strengthened zonal flow from Siberia cools the western Pacific with the impact on the warming of the equatorial and eastern Pacific when also a distinct 1976-78 climate shift occurred. Processes in the Atlantic and Pacific play a significant role and a time delay (wind forcing over the previous 1-4 yr) appears to be the most important for the relocation of the oceanic gyres. Results showing statistically significant relations between time series for geomagnetic activity, for the sum of climate indices and for the global temperature help to verify findings concerning the chain of processes from the magnetosphere to the troposphere.” Studia Geophysica & Geodaetica, Bucha 2012
A Coronal Mass Ejection (CME); hit Earth around January 1st:
Ensemble WSA-ENLIL+Cone Model Evolution Movie for Median CME Input Parameters – Dynamic Pressure:

and the Magnetosphere was rocking and rolling:

However, there is limited evidence to support the influence of Solar activity on Polar Vorticity and in the past Leif has been dismissive of the potential that Solar influences on the upper atmosphere could influence Earth’s climate, i.e.:
Leif Svalgaard says: March 6, 2011 at 12:13 pm
Just The Facts says: March 6, 2011 at 11:03 am
indicate that the causative mechanism behind proton aurora precipitation during high dynamic pressure is connected to the compression of the magnetosphere, which is directly related to the solar wind dynamic pressure. [and other quotes]
“You keep bringing up influences on the upper atmosphere [which are not disputed – but makes for good fill-material that looks like science], but all of these things are either not related to climate at all or, at best, only marginally and unconvincing.
Again, your bar is much too low [to be generous].”
Regardless of the causes, it appears that the result is that an Upper Stratospheric/Lower Mesospheric (USLM) disturbance occurred, i.e. “USLM Disturbance criteria are established, based on stratopause warmings at the 2 hPa level, to create climatologies in both hemispheres that delineate their timing, frequency, and geographic location. USLM disturbances occur on average 2.3 times per winter in the Northern Hemisphere (NH)(November through March) and 1.6 times per winter in the Southern Hemisphere (SH)(May through September), persist on average for 8 days in the NH and only 4 days in the SH, occur most frequently in December (July) in the Northern (Southern) Hemisphere, and are predominantly located in the longitude sector between 0oE and 90oE in both hemispheres. This is the first work to show that all major Sudden Stratospheric Warmings (SSWs) over the 20.5 year data record are preceded by USLM disturbances. One third of USLM disturbances evolve into a major SSW; only 22% of minor SSWs evolve into a major SSW. USLM disturbances and minor SSWs illustrate, at times, similar occurrence statistics, but the minor warming criteria seem to include a more diverse range of dynamical conditions. USLM disturbances are more specific in their dynamical construct with strong baroclinicity being a necessary condition. Potential vorticity analysis indicates that all USLM events occur with planetary wave breaking and that subsequent baroclinic instability may lead to the development of USLM disturbances. A climatology of polar winter stratopause warmings and associated planetary wave breaking”. Greer et al. 2013
“The typical thermal structure of USLM disturbances is dipolar in nature at 2.0 hPa with strong thermal gradients across the polar vortex. From the assimilated data, we find that the geographic preference of the anomalously warm temperatures at 2.0 hPa are located on the East side of the polar low, while there is a related cool pool of air located on the West side. These geographic preferences and observed amplification in temperature help to support the proposed dynamical process of baroclinic instability. Indirect circulations are induced, and to preserve continuity, cells of ageostrophic and vertical motions occur well into the mesosphere, and potentially into the thermosphere. We find that the average frequency of USLM events is 1.63 events per season in the Northern Hemisphere. In addition, the assimilated data indicates that all Sudden Stratospheric Warmings (SSWs) are preceded by USLM events; SSW events occur with a frequency of 0.84 events per season (Northern Hemisphere). USLM disturbances persist from three to ten days and tend to precede SSW events by several days, although there may be multiple USLM disturbances prior to an SSW event occurring. Lastly we exhibit how USLM disturbances differ between the Northern and Southern poles, including differences in frequency and intensity. An open question is whether these frequent USLM polar winter disturbances impact the thermosphere and ionosphere. American Geophysical Union, Greer et al.
“Analysis of planetary wave breaking and EP-flux of individual and composite USLM events indicate an increase in breaking near the 0.1 hPa level, approximately 10 km above the extreme thermal anomaly at the stratopause in the days leading up to the peak of the event. Vertical coupling of the atmosphere during this event is illustrated in the progression of these events and their impact on the thermal structure, zonal mean wind, polar vortex and conditions that have the potential to support a secondary baroclinic instability (including the Charney-Stern criteria for instability the role of baroclinic/barotropic instabilities). In addition, USLM disturbances appear to have front-like behavior analogous to the troposphere. Broader impacts of these disturbances and the dynamics associated with them influence gravity wave generation/propagation, vertical air motion, chemical tracer transport, precondition of the atmosphere for SSWs and the potential to couple with the thermosphere through tides. American Meteorological Society Conference, Greer et al. 2013
The Upper Stratosphere Lower Mesosphere (USLM) Disturbance can be seen on this Jan, Feb, March Zonal Temperature Anomaly Time Series;
")
and the impact of the USLM can be seen in the rapid increase in 10-hPa/mb Height Temperature Anomalies – Atmospheric Temperature Anomalies At Approximately 31,000 meters (101,700 feet) over East Asia:
")
You can see more on current Northern Polar Vortex conditions on the new WUWT Northern Polar Vortex Reference Page. I addition, if you have not had the opportunity to review WUWT’s other Reference Pages it is highly recommended:
- Atmosphere Page
- Atmospheric Oscillation Page
- ENSO (El Nino/La Nina Southern Oscillation) Page
- “Extreme Weather” Page
- Geomagnetism Page
- Global Climate Page
- Global Temperature Page
- Ocean Page
- Oceanic Oscillation Page
- Polar Vortex Page
- Paleoclimate Page
- Potential Climatic Variables Page
- WUWT Northern Polar Vortex Reference Page.
- Northern Regional Sea Ice Page
- Sea Ice Page
- Solar Page
- Spencer and Braswell Papers
- Tornado Page
- Tropical Cyclone Page
- US Climatic History Page
- US Weather Page
Please note that WUWT cannot vouch for the accuracy of the data within the Reference Pages, as WUWT is simply an aggregator. All of the data is linked from third party sources. If you have doubts about the accuracy of any of the graphs on the WUWT Reference Pages, or have any suggested additions or improvements to any of the pages, please let us know in comments below.
Shouldn’t that be ‘Circumpolar Vortex’?
This is important data which needs close watching since I judge that the effect of a variable size and shape for the polar vortices influences jet stream zonality / meridionality and thus global cloudiness to alter the amount of solar energy able to enter the oceans to drive the climate system.
Such data is relevant to the matter of the ozone hole too.
I suspect a solar driven link between ozone amounts, global cloudiness and shifting climate zones which in turn influences the vigour of the global convective system that then acts as a negative system response to both warming and cooling.
Excellent presentation and explanation of the phenomenon. I suspect it will be either ignored, misinterpreted or be simply beyond the comprehension of the trolls and warmists. Nice piece of work!
Bill Marsh says: January 18, 2014 at 10:09 am

 - 1979 to Present") ddata.over-blog.com – Click the pic to view at source[/caption]
ddata.over-blog.com – Click the pic to view at source[/caption]

Shouldn’t that be ‘Circumpolar Vortex’?
No, the Circumpolar Vortex and the Polar Vortex are interrelated but distinct phenomena.
For example, “This paper represents a final summary of the work I have carried out on the 300-mb north circumpolar vortex using these analyses, and includes discussion of the relation between 300-mb vortex size, and vortex depth, midlatitude tropospheric temperature, and Arctic Oscillation (AO) and North Atlantic Oscillation (NAO) indexes.”
NOAA
And in his recent WUWT article It’s The Circumpolar Vortex Not The Polar Vortex And Other PR Deceptions ” Tim Ball provided this animation of the Circumpolar Vortex at 500 hPa/mb:
In comparison, “the polar vortex extends from the tropopause (the dividing line between the stratosphere and troposphere) through the stratosphere and into the mesosphere (above 50 km). Low values of ozone and cold temperatures are associated with the air inside the vortex.” NASA
This graphic is helpful in seeing the height and location of the Polar Jet in relation to the Tropopause, down to which the Stratospheric Polar Vortex can extend:
[caption id="" align="alignnone" width="578"]
Additionally, in the following image the Stratospheric Polar Vortex is delineated by the “Arctic Front”, whereas the Circumpolar Vortex is delineated by the “Polar Front”
Tim Ball’s point about the Circumpolar Vortex is that the Stratospheric Polar Vortex does not reach down to the surface making it cold. Rather variations in the Polar Vortex can influence the Circumpolar Vortex, which can elongate to allow Polar Air to reach lower latitudes. Additionally, in the center of the Polar Vortex “air from very high altitudes descends vertically through the center of the vortex, moving air to lower altitudes over several months” “NASA”, loading the Arctic with cold air available for breakout.
Stephen Wilde says: January 18, 2014 at 10:34 am NOAA – National Aeronautics and Space Administration (NASA) Goddard Space Flight Center (GSFC) – Click the pic to view at source[/caption]
Such data is relevant to the matter of the ozone hole too.
Yes, the “Ozone Hole” is likely a result of the dynamical effects of the Stratospheric Polar Vortex, i.e.:
“The ozone hole is in the center of a spiraling mass of air over the Antarctic that is called the polar vortex. The vortex is not stationary and sometimes moves as far north as the southern half of South America, taking the ozone hole with it.” NASA
Within the Polar Vortex there are other “holes” as well, i.e.
“The walls of the polar vortex act as the boundaries for the extraordinary changes in chemical concentrations. Now the polar vortex can be considered a sealed chemical reactor bowl, containing a water vapor hole, a nitrogen oxide hole and an ozone hole, all occurring simultaneously” Labitzke and Kunze 2005
“measurements of low methane concentrations in the vortex made by the HALOE instrument on board the Upper Atmosphere Research Satellite.” Rapid descent of mesospheric air into the stratospheric polar vortex, AGU 1993
Also, “in the center of the Antarctic vortex. Air from very high altitudes descends vertically through the center of the vortex, moving air to lower altitudes over several months.”NASA
Air towards the top of the stratosphere has lower concentrations of ozone;
[caption id="" align="alignnone" width="578"]
As such, when this “air from very high altitudes descends vertically through the center of the vortex” it displaces the air below it, decreasing the concentration of ozone within the Polar Vortex. The combination of the low pressure area formed by the centrifugal force of the Polar Vortex and the air from very high altitudes with lower concentrations of ozone that “descends vertically through the center of the vortex”, creates the “Ozone Hole”, along with the “Water Vapor Hole”, “Nitrogen Oxide Hole” and “Methane Hole”.
Understanding the why of it all still doesn’t make me any warmer … and just this week we’re looking at temps 10 to 20°F below normal.
Is it Spring yet???
Hint … no … and the talk is of temps running about 10°F below normal through to mid-February.
Layman here with a question: I’ve seen references to stratospheric ozone depletion triggering AO positive, and NSIDC says AO positive pushes arctic ice in into the atlantic by greenland…. But I have never seen ozone depletion sted as one of the causes sea ice loss… Why?
dave says: January 18, 2014 at 11:36 am
Could you please fix the ending?
loading the Arctic will cold air available for breakout.
Corrected, thank you.
Alec aka Daffy Duck says: January 18, 2014 at 11:36 am
Layman here with a question: I’ve seen references to stratospheric ozone depletion triggering AO positive, and NSIDC says AO positive pushes arctic ice in into the atlantic by greenland…. But I have never seen ozone depletion sted as one of the causes sea ice loss… Why?
See my comment in response to Stephen Wilde above, i.e. “Ozone Depletion” is likely a misnomer and the result of the dynamical effects of the Polar Vortex . As such “ozone depletion” doesn’t trigger anything per se, rather the Polar Vortex affects Stratospheric Ozone and the Arctic Oscillation.
Thank you. Excellent.
[Now I have one link to drop on blogs where they claim that melting arctic ice controls the Jet Stream. It’s all over it seems these days as an explanation for the recent cold snap in the middle of the US. “Oh noes! The melting arctic ice is causing the Jet Stream to wobble!“]
Can the polar vortex be considered an eddy which detaches from the circumpolar vortex? Thanks.
JTFW said:
As such “ozone depletion” doesn’t trigger anything per se, rather the Polar Vortex affects Stratospheric Ozone and the Arctic Oscillation.
I think ozone amounts affect the vertical temperature profile though which would raise or lower the tropopause height towards the poles thus either facilitating or obstructing polar air ‘breakouts’.
The vortex does of course redistribute such ozone as is available and causes the hole to vary in size accordingly but variations in solar wavelengths and particles seem likely to modulate the supply of ozone.
Great work, sir. I would like to see the Reference page include the Mountain Torque events pic as well. here is where to get it. MTs lead to geopotential waves. Also, Wave#3 isnt necessary. It does not play a significant role in SSWs.
http://www.esrl.noaa.gov/psd/map/images/reanalysis/aam_total/gltaum.90day.gif
JTFW said:
“variations in the Polar Vortex can influence the Circumpolar Vortex, which can elongate to allow Polar Air to reach lower latitudes. ”
Exactly, but the interesting thing is that in order to push the circumpolar vortex in the tropopause outward from the Pole one needs to reduce tropopause height above the Pole which requires a warming of the descending air within the Stratospheric Polar Vortex and not a cooling.
A warmer stratosphere pushes the tropopause down and a cooler stratosphere allows it to rise.
We can see that during the recent years of lower solar activity and during the mid 20th century cooler period and in the LIA the outward movement occurred when the sun was less active so the descending air in the Stratospheric Polar Vortex must become warmer when the sun is less active.
That implies more ozone creation at height and towards the Poles when the sun is less active which is contrary to established climatology.
But then again note Joanna Haighs comments in light of the observations between 2004 and 2007 that ozone increased above 45km when the sun became less active.
She suggested that we might have to reverse the sign of the expected atmospheric response to solar variations in parts of the atmosphere.
I submit that the only way we can get more zonality with an active sun and more meridionalty with a quiet sun is to reverse the sign of the solar effect on ozone amounts above 45km and towards the poles.
It was already known that an active sun reduces ozone in the mesosphere and the Stratospheric Polar Vortices allow that mesospheric ozone variability to be transmitted down towards the tropopause.
Thus can an active sun reduce ozone preferentially above the Poles to raise tropopause height,
pull the AO and AAO back and allow zonal jets
Whilst a quiet sun will increase ozone preferentially above the poles to reduce tropopause height, push the AO and AAO outward and lead to more meridional jets.
This is a great achievement which cements WUWT’s position as the authoritative atmospheric science site on the web. Congratulations and…thank you!
am hoping this is relevant. BBC is now running the silent/sleeping sun story on regular news broadcasts, & i’m eager to hear some views from WUWT readers with more understanding of these matters than me:
18 Jan: BBC: Rebecca Morelle, Science reporter: Is our Sun falling silent?
“I’ve been a solar physicist for 30 years, and I’ve never seen anything quite like this,” says Richard Harrison, head of space physics at the Rutherford Appleton Laboratory in Oxfordshire…
“It’s completely taken me and many other solar scientists by surprise,” says Dr Lucie Green, from University College London’s Mullard Space Science Laboratory…
Prof Lockwood says that while UV light varies with solar activity, other forms of radiation from the Sun that penetrate the troposphere (the lower layer of air that sits above the Earth) do not change that much.
He explains: “If we take all the science that we know relating to how the Sun emits heat and light and how that heat and light powers our climate system, and we look at the climate system globally, the difference that it makes even going back into Maunder Minimum conditions is very small.
“I’ve done a number of studies that show at the very most it might buy you about five years before you reach a certain global average temperature level. But that’s not to say, on a more regional basis there aren’t changes to the patterns of our weather that we’ll have to get used to.”…
“This feels like a period where it’s very strange… but also it stresses that we don’t really understand the star that we live with.” says Prof Harrison.
“Because it’s complicated – it’s a complex beast.”
http://www.bbc.co.uk/news/science-environment-25743806
18 Jan: UK Daily Mail: Mark Prigg: Is a mini ice age on the way? Scientists warn the Sun has ‘gone to sleep’ and say it could cause temperatures to plunge
2013 was due to be year of the ‘solar maximum’
Researchers say solar activity is at a fraction of what they expect
Conditions ‘very similar’ a time in 1645 when a mini ice age hit
http://www.dailymail.co.uk/sciencetech/article-2541599/Is-mini-ice-age-way-Scientists-warn-Sun-gone-sleep-say-cause-temperatures-plunge.html
the Solar influence on the Stratosphere is linked to the type of QBO phase, a decent correlation of SSWs and the QBO phase and solar Flux
http://f1.nwstatic.co.uk/forum/uploads/monthly_01_2014/post-10577-0-14746500-1389168133.jpg
I found the following confusing – had to actually look it up
Apparently, the more standard way to write this (used by NOAA) is
since a millibar is the same as a hector Pascal. However, I did find both stylings used on the internet.
Also GPH is used. lol Geopotential height. all same values.
This is a paper from 2006 on Ozone concentrations and possible causes – I found it very interesting and is linked to both polar vortices: http://www.appinsys.com/GlobalWarming/Ozone.htm Sort of looks like Ozone concentration is another one of these “natural” variations with a whole lot of variables. The more we know, the less we know we know.
I think the reversed north Atlantic oscillations last year help to precipitate the current polar vortex.
pat says:
January 18, 2014 at 1:20 pm
“am hoping this is relevant. BBC is now running the silent/sleeping sun story on regular news broadcasts, & i’m eager to hear some views from WUWT readers with more understanding of these matters than me:”
Prof Lockwood says: ““If we take all the science that we know relating to how the Sun emits heat and light and how that heat and light powers our climate system, and we look at the climate system globally, the difference that it makes even going back into Maunder Minimum conditions is very small.”
_________________________
That’s it in a nutshell. While there have been periods in history when it looked like variations in the sun’s output might have affected our climate, the correlations never hold up under scrutiny. At present, we can’t say for certain what effect the sun might have on climate.
disclaimer: I’m no expert.
Policycritic says: January 18, 2014 at 12:08 pm
 European Space Agency – CryoSat – Click the pic to view at source[/caption]
 National Snow & Ice Data Center (NSIDC) – Click the pic to view at source[/caption]
 Cryosphere Today – Arctic Climate Research at the University of Illinois – Click the pic to view at source[/caption]
 - 1979 to Present") Remote Sensing Systems (RSS) – Microwave Sounding Units (MSU) – Click the pic to view at source[/caption]
Remote Sensing Systems (RSS) – Microwave Sounding Units (MSU) – Click the pic to view at source[/caption]
[Now I have one link to drop on blogs where they claim that melting arctic ice controls the Jet Stream. It’s all over it seems these days as an explanation for the recent cold snap in the middle of the US. “Oh noes! The melting arctic ice is causing the Jet Stream to wobble!”]
Let me provide a few more. As best I can interpret, the wobbly Jet Steam hypothesis goes like this:
“The Arctic is heating faster than the rest of the world, hurried along by the disappearance of polar sea ice. Bright white ice reflects energy back into space; dark blue water absorbs it. Arctic temperatures are about 2 degrees Celsius warmer there than they were in the mid-1960s. (The average temperature increase for the Earth’s atmosphere overall is about 0.7 degree C, since 1900.)
In other words, the temperature difference between the Arctic and North America is shrinking. That’s one factor causing wobbliness in the jet stream, the west-east current that circles the Northern Hemisphere, according to Jennifer Francis, research professor at Rutgers University. Normally, that river of air keeps low-pressure cold air contained above the Arctic and holds higher-pressure warm air above the temperate regions, where most people live.
Video: Blizzard Business: These Companies in High Demand
Scientists tend to call the jet stream a “polar vortex,” Francis says.
A slowing in the jet stream has caused it to zigzag, carrying warmer temperatures farther north than usual—and Arctic cold farther south. “The real story,” Francis says, is that the jet stream is “taking these big swings north and south and that’s causing unusual weather to occur in a number of places around the Northern Hemisphere.” Bloomberg Businessweek
For starters, if you watch this video below, you see that even Kevin Trenberth thinks the melting sea ice, warming Arctic, wobbly Jet Steam causes cold January weather hypothesis is weak; “So with regards to the Arctic, there are certainly major changes in the Arctic Sea Ice. And those are biggest in the fall. We’ve had record low Arctic Sea Ice, about 40% decline in Arctic Sea Ice overall, since the 1970’s, in September. But the Arctic fills up in the winter time.” “And so at those times of years the Arctic Sea Ice it seems to me plays a much lesser role. The area affected is a lot less, simply because the arctic is land locked.”
From a data perspective, “The volume of ice measured this autumn is about 50% higher compared to last year.
In October 2013, CryoSat measured about 9000 cubic km of sea ice – a notable increase compared to 6000 cubic km in October 2012.”
“About 90% of the increase is due to growth of multiyear ice – which survives through more than one summer without melting – with only 10% growth of first year ice. Thick, multiyear ice indicates healthy Arctic sea-ice cover.
This year’s multiyear ice is now on average about 20%, or around 30 cm, thicker than last year. ”
“‘One of the things we’d noticed in our data was that the volume of ice year-to-year was not varying anything like as much as the ice extent – at least in 2010, 2011 and 2012,’ said Rachel Tilling from the UK’s Centre for Polar Observation and Modelling, who led the study.
‘We didn’t expect the greater ice extent left at the end of this summer’s melt to be reflected in the volume. But it has been, and the reason is related to the amount of multiyear ice in the Arctic.'” European Space Agency
This animation demonstrates the increase in ice thickness measured by CryoSat over the last four Octobers:
[caption id="" align="alignnone" width="564"]
Also, Arctic Sea Ice Extent was within two standard deviations of the 1981 – 2010 average for the entirety of 2013;
[caption id="" align="alignnone" width="640"]
and Northern Hemisphere Sea Ice Area saw its smallest decline since 2006, with a decline less than half of the prior year and it ended 2013 less than .5 Million Sq Km below the 1979 – 2008 average;
[caption id="" align="alignnone" width="640"]
Furthermore, if you look at the graph above during the time of the previously most notable polar “outbreak” event i.e. the “January 1985 Arctic outbreak”, Northern Sea Ice Area appears quite close to average and shows minimal variability during the year. However, “The January 1985 Arctic outbreak was the result of the shifting of the polar vortex further south than is normally seen. Blocked from its normal movement, polar air from the north pushed into nearly every section of the eastern half of the United States, shattering record lows in a number of states. The effects of the outbreak were damaging. At least 126 deaths were blamed on the cold snap and 90 percent of the citrus crop in Florida was destroyed in what the state called the “Freeze of the Century.” Florida’s citrus industry suffered $1.2 billion in losses ($2.3 billion in 2009 dollars) as a result of the inclement weather. The public inauguration of President Ronald Reagan for his second term was held in the Capitol Rotunda instead of outside due to the cold weather, canceling the inaugural parade in the process. (Because Inauguration Day fell on a Sunday, Reagan took a private oath on January 20 and the semi-public oath on January 21.) NOAA
Additionally, if you look at Polar Tropospheric Temperatures;
[caption id="" align="alignnone" width="578"]
and the associated data :
1984 6 0.3569
1984 7 0.2715
1984 8 -0.1832
1984 9 0.3030
1984 10 0.3630
1984 11 -0.4922
1984 12 -0.4762
1985 1 0.4675
1985 2 -0.9427
1985 3 -1.0863
1985 4 -1.5120
1985 5 -0.1268
1985 6 -0.1515
it is apparent that the 1985 “Polar Outbreak” event occurred without “any indication that “the temperature difference between the Arctic and North America (was) shrinking.” It is thus implausable that this is “one factor causing wobbliness in the jet stream” that supposed cause the recent “Polar Outbreak” event.
I cannot find any observation evidence that supports Jennifer Francis’ wobbly hypothesis.
The descriptions above talk of the vortex causing cold air to sink and provide more cold air to the pole. The implication is that this some how makes the pole colder. I don’t understand how this is possible. In general, the stratosphere gets warmer with increasing height, even over the poles. As a result, the sinking air should make the poles warmer.
In addition, there is the consideration of “potential temperature”. Basically, this means that air gets warmer as it moves toward the surface because of the change in pressure – about 9.8K per kilometer. As a result, air from the mesosphere (0°C at about 50km), if moved to the surface, would be over 450°C!
justthefactswuwt says:
January 18, 2014 at 2:13 pm
____________________
How interesting that at the end of your linked video of Dr. Kevin Trenberth (edited by Peter Sinclair,) YouTube suggests a link to Richard Dawkins discussing magical reality.
Big oops- I meant to say: “… video of Dr. Kevin Trenberth and Dr. Jennifer Francis“.