Top sticky post – new posts will appear below this one.
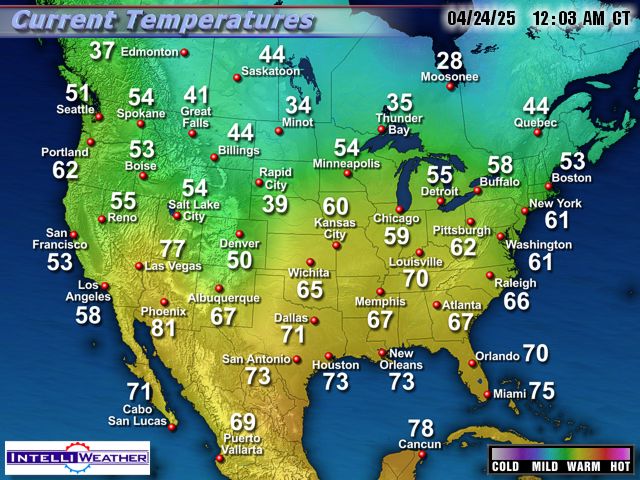
This map below updates every hour, and shows city temperatures along with temperature gradients. Can you believe 18F in Atlanta (midday) at the time of this writing? Low temperature records are being shattered in many USA cities with cold records outnumbering warm records almost 5 to 1. This thread will update with weather news as it happens.
Look at all of the cold records:

| Total Records: | 1045 |
| Rainfall: | 127 |
| Snowfall: | 351 |
| High Temp: | 85 |
| Low Temp: | 162 |
| Low Max Temp: | 300 |
| High Min Temp: | 20 |
Cold records total: 462
Warm records total: 105
Source: http://wx.hamweather.com/maps/climate/records/1week/us.html
================================================================
Update: here is WeatherBell’s map being used for The Drudge Report. It represents the air temperature at 2 meters above the surface (you may need to manually refresh browser to see it.) Note the United States Avg: value, which is below freezing for the CONUS.

UPDATE2: record breaking cold in Atlanta
![image_full1[1]](http://wattsupwiththat.files.wordpress.com/2014/01/image_full11.gif)
What I worry about are the Seville oranges, which I need to make my marmalade every year. I believe the ones we get in Canada are grown in Arizona. They should be in the stores within the next two weeks. Anyone got any news?
ps
Fox News just reported a wind change has the two iceboated boats free at last.
Free at last from mean old, “old ice”..
Greg Goodman says:
January 7, 2014 at 10:41 am
Surface temps to not necessarily match the air temp where precipitation forms and/or falls through.
If the surface temperature is -2F the overlying air temperature can hardly be above freezing, but the real explanation is the weekly period.
The physiological or the psychological? Also bearing in mind one can either adversely or the
antonym, ‘favorably’, affect the other …
.
According to bbc weather they have no reason to think that the polar vortex has anything to do with this weather. They referenced the Met Office who say the same.
They say it’s just jet stream behaviour.
‘Found this editorial From the Washington TImes. A total reversal of the use of “Climate Denialists”. ‘
Yep, I’ve been referring to warmies as “deniers of science” for years. Warmies HATE being shown data, statistics, satellite readings, long term histories. They work with forecasts, predictions, guesses.
They openly now admit that they’re probably wrong – falling back on the precautionary principle. Did Einstein have a theory of what relativity might be, but probably isn’t? Do they award a Nobel Prize in Probably Not Chemistry?
Jim Cripwell says:
January 7, 2014 at 11:01 am
What I worry about are the Seville oranges, which I need to make my marmalade every year. I believe the ones we get in Canada are grown in Arizona. They should be in the stores within the next two weeks. Anyone got any news?
The western US is in a drought of record proportions so that may effect the citrus crop.
I hope the link works 😉
http://t15.imagechef.com/ic/imgout/sampa516ecfcc3cf7a0a.jpg
NOAA’s experimental FIM model is supposed to one day succeed the GFS. For now it’s still rated “experimental”. But it is already supposed to beat the GFS 6 days out and further. The url for the website (CONUS coverage) is
http://fim.noaa.gov/FIM/Welcome.cgi?dsKey=fim_jet&domain=236
Click on an hour in the “2m temp” line, and you’ll get the temperature forecast map for that hour. If you click on the “Domain:” dropdown menu, you can get different areas. E.g. “Arctic” gives you coverage of most of Asia and North America.
Sorry, but could you please advise
Degrees F or C
I could try and guess, but then I`m not a AGW scientist so would have to learn the skill
. A similar polar vortex breakout happened also in January1985 shortly after a very warm spell along the east coast of North America in December 1984. Could the past warm spell in November2013 in Northern Asia be behind our current cold spell. These events are both somewhat similar to a SSW event [ Sudden Stratospheric Warming ]which have been happening in December / January every few year but have been happening more frequently recently .
http://en.wikipedia.org/wiki/Winter_1985_Arctic_outbreak
Steve from Rockwood: No there is not a lot of ice in the arctic. its currently running at less than last year (take a look at the ice page under Reference Pages in the menu at the top).
There was a period when it was icing up faster than normal, and lots of people hooked on to that and keep repeating it as if its still true – its not.
To maintain credibility we really have to call out those that exaggerate or use out of date information on both sides of the argument.
http://nsidc.org/data/seaice_index/images/daily_images/N_stddev_timeseries.png
I guess for irony’s sake, cspan’s Washington Journal invited the Center for American Progress’s Director of Climate Strategy to spew their climate Change boilerplate. It didn’t take long to figure out what their climate strategy is; green technology boondoggles. I do credit him for being completely unfazed by today’s temperatures, he called it winter.
People seem to display immense levels of ignorance when it comes to the weather. I suppose that’s what these disciples of pope Al Gore and his religion of global warming count on. I can guess at the fun they’d have with the situation I’m experiencing now in Buffalo …
tied the record low of -5°F (-20.5°C) this morning around 10AM
experiencing a blizzard as well … no, not blizzard-like conditions but an actual blizzard
the three counties around Buffalo (Erie, Genesee, and Wyoming) are the only 3 counties in the country right now where the NWS has issued a blizzard warning … it kicked in yesterday and it’s set to continue on into tomorrow morning. First time we’ve had a blizzard since 1993.
It’s not the coldest it’s ever been in Buffalo, nor is it the worst blizzard, nor is it the most snow, so, it can’t be touted as unprecedented; but, for people who are unaware of weather history, it’s easy to get suckered into the “unprecedented” label. But spare me that stupid “extreme weather” label … a blizzard is extreme weather in its most fundamental sense … it’s been 20 years since the last blizzard and I can remember experiencing a blizzard more than 50 years ago, when I was a tad bit younger and better able to enjoy the conditions (when I loved those snow days). And how much snow am I talking about? I don’t know. 5 miles south of me, in the village of Lancaster, they’re reporting 10″ snow (so far) and 5 miles west of me, the reported total so far is 4″ of snow. But the storm itself keeps on moving around … it’s ~50 miles long and ~12 miles wide … or rather, it was … it’s since split in two lengthwise and is covering more territory with a nice breather in the middle (oh look … the sun just came out).
I wonder if those idiots at the Weather Channel will give a name to this storm. Spare me the fluff n stuff and bring a shovel and dig me out.
And the NY State Thruway (interstate (I90) for all you normal folk) is closed from Rochester to the NY/PA state line.
And the blizzard warning has just now been lifted for Erie county … I guess the sustained winds have dropped enough to make it no longer a blizzard … but it’s still cold and snowing and there is plenty of wind and wind gusts.
Where’s that global warming when you need it?
steveta_uk: As I understand it Polar Vortex = Jet Stream. Just sounds more … evil … so I have no idea what the Met Office is trying to say.
Uh oh, polar bears are all gonna die some more:
http://www.huffingtonpost.com/2014/01/07/chicago-weather-cold_n_4556042.html?icid=maing-grid7%7Cmain5%7Cdl1%7Csec1_lnk3%26pLid%3D427643
Conversion: [°C] = ([°F] − 32) × 5⁄9 [°F] = [°C] × 9⁄5 + 32
Intervals:1 °F = 1 °R = 5⁄9 °C = 5⁄9 K
fhhaynie says:
January 7, 2014 at 10:43 am
“I’m glad we are burning a lot of fossil fuel to keep people from freezing. What if we were forced to depend on solar cells or wind mills to keep us warm?”
If you were going to rely on wind power from the Bonneville Power grid (western US, I know), you would get very cold. See the green line here:
http://transmission.bpa.gov/Business/Operations/Wind/baltwg.aspx
Did I mention that there is 100% cloud cover? As if that mattered for power here.
Thumb-rule for conversion between degrees Celsius and degrees Fahrenheit:
Fahrenheit to Celsius: Subtract 32 and halve the resulting number.
Celsius to Fahrenheit: Double the number and add 32.
More ice on Lake Michigan than seen in decades
Leon, what your experiencing is not a “storm” per se, even tho the conditions are by definition “blizzard”. The winds from this “polar vortex” (it’s not as far as I can see, but really just a very large, very deep low (940mb), over Ungava at one point, coupled to the jet stream) are pumping strong winds straight down Lake Erie, giving you a solid enduring lake effect blizzard, that will persist until the low moves off and/or breaks up. This winter season has had its fair share early of lake effect snow, with lots of wind. Hopefully Erie will soon freeze and we can move on to “sedate” bright skies winter.
I knew they would blame the cold on global warming anyway… http://www.theguardian.com/environment/2014/jan/07/us-polar-vortex-global-warming
Berényi Péter says:
January 7, 2014 at 12:40 pm
More ice on Lake Michigan than seen in decades
According to Environment Canada, the Great Lakes haven’t had this much ice so early in the season since the late 1980s.
[…]
From a historical perspective, the current ice level is on track to do something we haven’t seen in decades: cover most of Lake Michigan.
————————————————————–
Why is it that a reduction in summer Arctic ice increases extreme weather in the winter on the North American continent while an increase in winter ice over the Great Lakes does nothing?
@lsvalgaard – the preceding for this tongue of cold air was a warm sector boundary that streamed over Detroit on the weekend, and brought a lot of moisture out of the US lower midwest across lower Michigan and southern Ontario – the warm line was pretty well defined – south of it everybody got rain then a bit of freezing rain, then came the cold air Sunday night. Temps in the Detroit area hovered close to freezing.
An interesting point of order. Everyone is referring to this pattern as a “Polar Vortex”. From my many moons of forecasting in Canada, and north of 60N, I would definitely be calling this the “Arctic Vortex”. Generally the Arctic Vortex does not drop much further south than southern Hudson Bay. This time it decided to venture much further south.
When it comes to airmass and fronts these definitions are generally accepted:
Polar Front: Separates air masses of polar and tropical origin.
Arctic Front: The front between the deep, cold arctic air and the shallower, basically less cold polar air of northern latitudes.
So this is definitely a classic “Arctic Vortex”.