It has been quite entertaining to watch the various explanations coming out to rationalize “the pause” in surface temperatures for the last 16 years. For example, as Jerome Ravetz points out to me in email, The Times Hannah Devlin says the warming has just gone into hiding.

But there is a funny thing about that deep ocean warming.
As Bob Tisdale wrote:
Ever since the NODC released their ocean heat content data for the depths of 0-2000 meters and published Levitus et al (2012), it seems that each time a skeptic writes a blog post or answers a question in an interview, in which he or she states that global surface temperatures haven’t warmed in “X” years, a global warming enthusiast will counter with something to the effect of: global warming hasn’t slowed because ocean heat content continues to show warming at depths of 0-2000 meters. Recently, those same people are linking Balmaseda et al (2013) and claiming the warming of ocean heat content data continues.
It is true that the NODC’s ARGO-era ocean heat content (0-2000 meters) continues to warm globally, but always recall that the ARGO data had to be adjusted, modified, tweaked, corrected, whatever, in order to create that warming. That is, the “raw” ocean heat content data for 0-2000 meters shows the decreased rate of warming after the ARGO floats were deployed. (See the post here.) Also, while the much-revised NODC ocean heat content data for 0-2000 meters might show warming globally, it shows very little warming for the Northern Hemisphere oceans since 2005. See Figure 1.
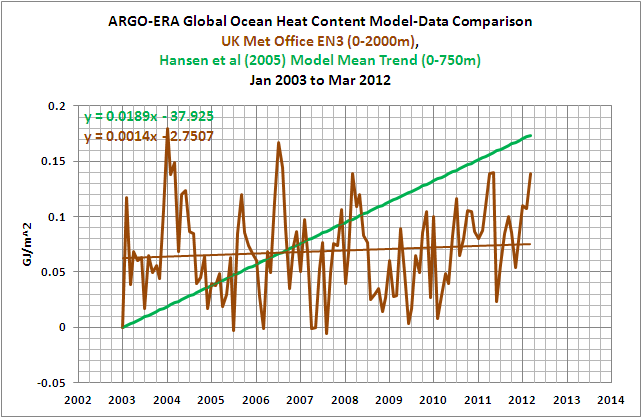

Figure 1
Can well-mixed human-created greenhouse gases pick and choose between the hemispheres, warming one but not the other? One might think that’s very unlikely.
Something else to consider: the Northern Hemisphere warming of ocean heat content for depths of 0-2000 meters occurs in only one ocean basin, and it’s not one of the big ones.
Right there is a premise falsifier. But I find this figure even more interesting:
There was a comparatively minor warming in the Northern Hemisphere at depths of 0-2000 meters from 2005 to 2012. But the upper 700 meters in the Northern Hemisphere cooled. The difference is provided to show the additional warming that occurred at depths of 700 to 2000 meters.

Figure 2
So the question here is simple. As Hannah Devlin writes in the Times:
The pause in global warming during the past decade is because more heat than expected is being absorbed by the deep oceans, according to scientists.
How does that heat get to the deep ocean hidey hole, down to 2000 meters, without first warming the upper 700 meters in transit? That’s some neat trick.
You can read more on how that deep ocean hidey hole doesn’t seem to hold up when the data is examined carefully here.
The claim has been made that its the sun doing it:
[Tisdale] SkepticalScience’s Rob Painting provides a reasonable explanation of the hypothetical cause of greenhouse gas-driven warming of the global oceans in the post Observed Warming in Ocean and Atmosphere is Incompatible with Natural Variation. Painting writes (my boldface):
Arguably the most significant climate-related impact of increased concentrations of greenhouse gases in the atmosphere, is that they trap more heat in the ocean. Over the last half-century around 93% of global warming has actually gone into heating the ocean. A little-known fact is that the oceans are almost exclusively heated by sunlight (shortwave radiation) entering the surface layers.
Back in 2009 it was claimed that solar radiation changes would do just that:

Well Duncan, we are still here, speaking clearly to the issue.
That article was a reaction to this Judith Lean Paper in GRL (bold mine):
=============================================================
How will Earth’s surface temperature change in future decades?
Judith L. Lean, David H. Rind Article first published online: 15 AUG 2009 DOI: 10.1029/2009GL038932
Reliable forecasts of climate change in the immediate future are difficult, especially on regional scales, where natural climate variations may amplify or mitigate anthropogenic warming in ways that numerical models capture poorly. By decomposing recent observed surface temperatures into components associated with ENSO, volcanic and solar activity, and anthropogenic influences, we anticipate global and regional changes in the next two decades. From 2009 to 2014, projected rises in anthropogenic influences and solar irradiance will increase global surface temperature 0.15 ± 0.03°C, at a rate 50% greater than predicted by IPCC. But as a result of declining solar activity in the subsequent five years, average temperature in 2019 is only 0.03 ± 0.01°C warmer than in 2014. This lack of overall warming is analogous to the period from 2002 to 2008 when decreasing solar irradiance also countered much of the anthropogenic warming. We further illustrate how a major volcanic eruption and a super ENSO would modify our global and regional temperature projections.
==================================================================
Since that obviously hasn’t happened, and “the pause” is an inconvenient truth, the cheerleaders are looking for alternate explanations. Voila! The deep ocean hidey hole.
The ocean provides the perfect cover for global warming because unlike the atmosphere, few people experience it directly. Few people go diving down to 2000 meters with thermometers and few people go swimming in the ocean with pH meters to check the claims of “ocean acidification”.
On the other hand, virtually the whole of humanity can and has experienced “the pause” in air temperatures.
When the deep ocean hidey hole doesn’t pan out in a few years, and that stored hidden warming doesn’t spring out of the deep ocean like a caged lion, where will they put the warming next? They are running out of places.
=====================================================================
Tomorrow I’ll tell what my model predicted the temperature was today.
Dave says:
July 24, 2013 at 8:59 am
I have looked at the NOAA data and see continued warming, just not as fast as a few years ago. Warming has not paused.
I must assume you are making jest, but if not… Please post your data or a link to it. You may be the only one on the planet who has data showing warming the last 10 – 15 years.
I’m looking forward to your response. Cheers!
Jim Ryan says:
July 24, 2013 at 9:22 am
“The models are fine. They correctly predict the pause, with their auxiliary conjectures. And they have correctly predicted that temperatures will heat up again in time to get back on track 2015.”
Oh well, that’s it then. Authority has spoken. Debate over.
On petrol please tell that to the Warmist Dana Nuccitelli who receives big oil money from Tetra Tech. As for “Warming has not paused” I’ll let the climate scientists speak for me. Enjoy!
=====================================================================
I don’t think the missing heat will be found on the Moon.
It’s obviously hiding in a tree ring somewhere.
Dave says:
July 24, 2013 at 8:59 am
Look Dave, for the last time – stop quoting current ‘record’ temperatures a indicative of man made global warming. Please go find a palaeoclimate temperature graph for yourself, but here’s one from wiki (which must be ok as Connolley has probably approved it! LOL)
http://en.wikipedia.org/wiki/File:EPICA_temperature_plot.svg
as you can clearly see the graph goes uppy and downy. Yes?
now, imagine we are on the downward bit, at ANY time (until it upturns again) the measured temps will most likely be the coldest in the last few decades. Got it? Ditto if we are on the upward trend !! Simples.
So what does the 10 out of 12 hottest years tell us? Answer, absolutely feck all – other than we have been on a rising trend (which has now STOPPED/Paused/whatever) – even so, the last 10 years or so will still be the ‘hottest on record’ until the fall off starts (or warming continues – we still haven’t reached equivalent past peak temps, by the way).
As a poor analogy – when you set off from the traffic lights in a 30mph zone – and accidentally reach 31mph, get zapped by a policemans radar and he says ‘you were speeding’ – what has he actually measured? – your average speed? or the fact that at the time he zapped you, you were at peak speed and just about to take your foot off the gas? Get it? He is doing you for speeding for a POINT in time speed and that’s your tough luck ! In the context of climate temps going up and down (this is NOT disputed!) we are at the top or near top of an up cycle! Thus, of course all recent years will be the hottest on record – mostly because our records are so bloody short!
Live and learn dude – please!
It is interesting that 0 – 2000 m is almost never put into context. The 0-2000 m data is measuring less than half of the total ocean volume.
52% of ocean volume is *below* 2000m.
About 20% is above 700m.
About 28% is between 700m and 2000m.
We have ocean temperature data for 0-700m since 2003.
We have ocean temperature data for 700-2000m since 2003, but with much poorer resolution.
We have no temperature data below 2000m.
Temperature rise for 0-700m has been 0.04C/decade.
Temperature rise for 700-2000m has been 0.01C/decade.
Temperature rise below 2000m is unknown, but presumably 0.00C/decade (unless ocean floor volcanism is the heat source).
Total ocean temperature rise has been 0.04*0.2+0.01*0.28+0.00*0.52 = 0.01C/decade.
If the deep ocean can sequester surface heat this quickly, CACC should be flushed.
http://www.woodfortrees.org/plot/hadcrut4gl/from:2002/trend/plot/hadcrut4gl/from:2002
This isn’t a pause, this is a drop. Admittedly it’s picking years that suit one’s own argument, but isn’t that what warmists do? Warmists pick 1980 (or whatever) and say this is where it began. Well, 2002 is where it began dropping. 1980-2002 is 22 years. 2002-2013 is 11 years. Let’s see…
Seriously though, here’s my problem with the deep ocean heating bit. Say it’s so. Up until five years ago, mainstream climate science (IPCC AR4 projections) wasn’t expecting this to happen. Either we understand the climate well enough to project what’s going to happen or we don’t. It doesn’t look to me like we do yet. I don’t extend credit to oracles; come to me with a track record that demonstrates that you know what you’re talking about, or wait till you do.
“The Times Hannah Devlin says the warming has just gone into hiding.”
So has the Tooth Fairy, the Easter Bunny, Santa Claus and Waldo.
We are organizing a search party and how to soon find them all.
sorry, six years ago.
Mark says: “About the only obvious mechanism for deep water to heat up is through vulcanism.”
Yup. Good point. Even small thermal seeps can put considerable heat (and CO2!) into the ocean.
Steve Oregon says: “Wattupwiththat may have to augmented with ShutTheHellUp.com.”
They already have that. It’s called SkepticalScience.
Stephen Rasey says: “Error Bars! Error Bars!”
Yes! Yes! Preferably chocolate covered.
Dave says:
July 24, 2013 at 8:59 am
“We have had the hottest 10 years on record in the last 12 years and you claim that is not warming?”
“Warming” means that it is getting even warmer. This is not happening since 1998. We are in a warm plateau. Therefore “we are warming” == false. “We have the highest average temperatures since the LIA” == true. No contradiction.
Hope that’s simple enough for an activist brain.
It’s actually hiding in plain view, inside the sun, which as gone quiet as to not draw attention to it.
In support of and further comment to:
Eustace Cranch says:
July 24, 2013 at 8:17 am
Sorry for the scream, but: again and again, WHAT IS THE MECHANISM? What told the heat to hide? In 50 words or less of plain English, please.
William:
Hello and best wishes to all.
I agree there are many questions concerning the heat hiding in the oceans mechanism.
1) Turn on problem: What turns on the heat hiding in the ocean? A few pages of explanation would be helpful. Typically when a brand new mechanism is proposed a review paper is written explaining pros and cons for the theory, the issues that must be explained. The heat hiding in the ocean jumps right to it is the answer why there is plateau in warming.
Comment:
As we are spending trillions of dollars on purposeless scams, logically someone in charge should demand a few pages of scientific peer reviewed non pay walled protected explanation concerning the heat hiding in the oceans hypothesis and request alternative explanations for the plateau of no warming. The same concerned in charge person might also ask why the planet was warmed and cooled cyclically in the past (not caused by atmospheric CO2 changes) with the same regions warming that warmed in the last 70 years. The climate war if there is no warming is not a victimless crime.
2) Regulation problem: How does the heat hiding in the ocean mechanism hide the correct amount of heat? (not too much or too little) to create a plateau of no warming for 16 years?
3) Regional heat hiding problem: Why does heat hide in some oceans and not in others?
4) Heatgate problem: There are multiple data set issues which appear to indicate data manipulation.
I suspect the heat hiding in the oceans is due to adjusted and cherry picked data sets.
An essential component of the scientific process is to look for alternative explanations for anomalies (the plateau of 16 years at which time there is no warming is an anomaly, something that can disprove the extreme AGW hypothesis) and the data that can disprove a hypothesis.
There is observational evidence now of cooling at both poles. The heat hiding in the ocean cannot explain the reversal of warming of the last 70 years. The warmists have stated over and over that majority of the warming in the last 70 years is due to the increase in atmospheric CO2 and solar magnetic cycle changes cannot modulate planetary cloud cover.
http://ocean.dmi.dk/arctic/meant80n.uk.php
http://nsidc.org/data/seaice_index/images/daily_images/S_stddev_timeseries.png
The solar magnetic cycle modulation of planetary cloud cover mechanism can explain the regional pattern of warming (the regions of the planet that warmed in the last 70 years are the same regions that warmed in the past when there was grand solar maximum – series of high, short period solar magnetic cycles and the same regions of the planet that cooled when there was a grand solar minimum – a period in which there were no visible sunspots followed by weak and long period solar magnetic cycles – and can explain the reversal of warming – cooling. i.e. The solar magnetic cycle has changed, in the past the planet cooled when there was a solar magnetic cycle change of the type we are now observing. In the past there was due to an unexplained mechanism reason a delay in the onset of cooling of 10 to 12 years. The observed cooling was particularly strong in high latitude regions.
Greenland ice temperature, last 11,000 years determined from ice core analysis, Richard Alley’s paper.
http://www.climate4you.com/images/GISP2%20TemperatureSince10700%20BP%20with%20CO2%20from%20EPICA%20DomeC.gif
http://www.solen.info/solar/images/comparison_recent_cycles.png
P.S.
Thanks again Anthony and Bob for another thoughtful, data rich article. You are both scholar and gentleman.
@The Ghost –
Actually, the overall cooling began in 1938 . . . it’s been going on, net, for 75+ years now . . .
Resourceguy: “DarkHeat” ! Good one !!
Bad when you can’t even spell your own name -:(
Thanks, again, Bob Tisdale for an excellent dissection of the data. This blog article is a devastating response to the heat-is-going-into-the-oceans meme, and I have bookmarked it.
The next wave of doom:
The evil use of fossil fuels increases atmospheric CO2.
The increased CO2 “traps heat” (LOL) in the climate.
The heat eventually migrates to the deep ocean.
The increased temperature of the deep ocean reduces the rate of loss of the Earth’s internally generated heat.
The crust melts.
We all die in a global sea of molten rock.
(/ sarc)
“WHAT IS THE MECHANISM? What told the heat to hide? In 50 words or less of plain English, please.”
Look up the meaning of the word ‘occult’.
Consider Bob Tisdale’s excellent description of what happens during ENSO cycles. During El Nino’s the oceans lose heat and during La Nina’s the oceans gain heat. The exact opposite of what happens in the atmosphere. Now consider that the PDO is simply a situation where one or the other ENSO situation is dominant. Hence, when the PDO is positive the oceans lose heat and when the PDO is negative the oceans gain heat.
Hence, the oceans should be gaining energy during the current PDO negative phase that started around 2005. We are simply seeing a replacement of the energy lost during the warm phase from 1975-2005.
Dave says
July 27, 2013 8:59AM
I draw your attention to this post:
http://wattsupwiththat.com/2012/06/06/noaas-national-climatic-data-center-caught-cooling-the-past-modern-processed-records-dont-match-paper-records/
so much ofr your NOAA Data
The missing heat is in the hamper, the models are fine, the data sucks.
Even if you accepted the idea that the missing heat is all going into the deep oceans, you have to ask yourself why this would be happening all of a sudden over the last decade and a half, but wasn’t happening before. It’s nonsensical. But nonsensical is what we’ve come to expect from the doomers.