
Guest post by Alec Rawls
They say it all the time: even if there were some substantial mechanism of enhanced solar forcing it couldn’t be responsible for late 20th century warming because solar activity was roughly constant from 1950 to 2000. I have rounded up statements to this effect from eighteen top “consensus” climatologists, like Raimund Muscheler (2012):
Solar activity & cosmic rays were relatively constant (high solar activity, strong shielding and low cosmic rays) in the second part of the 20th century and, therefore, it is unlikely that solar activity (whatever process) was involved in causing the warming since 1970.
Is he assuming that the oceans equilibrate rapidly to any change in forcing so that continued high forcing is necessary just to maintain the new equilibrium, resulting in only a brief shot of warming? He doesn’t say. None of them say. They just make this highly counterintuitive claim that persistent forcing cannot cause continued warming, as if they actually believe that it is the change in the forcing rather than the level of the forcing that does the warming.
The tune changes however, as soon as the subject is forcing from greenhouse gases. A staple of the crusade against CO2 is the “commitment study,” where climatologists use their general circulation computer models (GCMs) to estimate the amount of future warming that would result if atmospheric CO2 were to stop increasing and just stay at current levels. That means no change in forcing going forward, just continued forcing at the present “high” level. The estimates of the continued warming this would cause over the 21st century are quite large, roughly equivalent to 20th century warming, or in the latest estimations, substantially higher.
AR4 estimated the “constant composition” commitment at 0.1°C/decade for the early 21st century, 0.6 °C for the whole century
From AR4 (§10.7.1, PP4):
The multi-model average warming for all radiative forcing agents held constant at year 2000 (reported earlier for several of the models by Meehl et al., 2005c), is about 0.6°C for the period 2090 to 2099 relative to the 1980 to 1999 reference period. This is roughly the magnitude of warming simulated in the 20th century. Applying the same uncertainty assessment as for the SRES scenarios in Fig. 10.29 (–40 to +60%), the likely uncertainty range is 0.3°C to 0.9°C. Hansen et al. (2005a) calculate the current energy imbalance of the Earth to be 0.85 W m–2, implying that the unrealised global warming is about 0.6°C without any further increase in radiative forcing. The committed warming trend values show a rate of warming averaged over the first two decades of the 21st century of about 0.1°C per decade, due mainly to the slow response of the oceans. About twice as much warming (0.2°C per decade) would be expected if emissions are within the range of the SRES scenarios.
Should Gerald Meehl’s estimate of 21st century commitment be reduced in compensation for the fact that he uses a 1980 – 1999 temperature average as a baseline? It seems that a decade’s worth of his 21st century warming estimate is actually taking place between 1990 (the center of his baseline period) and 2000. If so, the compensation would be at most about 0.1°C. That is the peak rate of warming the models produce for year-2000 Green House Gas levels. 1980-1999 GHG levels were lower, hence modeled warming would have been less than 0.1°C between the 1990 midpoint of the period and 2000 so less than 0.1°C of Meehl’s estimate of 21st century warming would actually be taking place during the 20th century.
But maybe no adjustment is needed. Meehl et al. certainly do not hesitate in presenting their figures as estimates of “further warming” vis a vis 2000. From the Meehl 2005 abstract:
Two global coupled climate models show that even if the concentrations of greenhouse gases in the atmosphere had been stabilized in the year 2000, we are already committed to further global warming of about another half degree and an additional 320% sea level rise caused by thermal expansion by the end of the 21st century. … At any given point in time, even if concentrations are stabilized, there is a commitment to future climate changes that will be greater than those we have already observed.
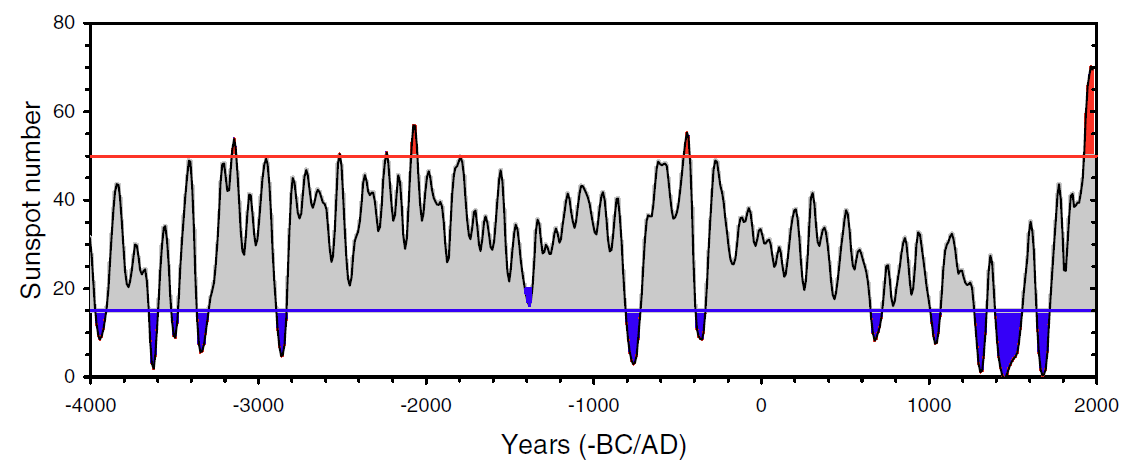
As for other commitment findings, Tom Wigley (2005) estimated that the “constant composition” warming commitment “could exceed 1°C,” and the graph at the top of the post is from Matthews and Weaver 2010, a pay-walled post-AR4 commitment study that was reviewed by Gavin Schmidt, who lists their commitment estimate from constant year-2000 GHG forcing as “an additional 0.3 to 0.8ºC warming over the 21st Century.”
AR5 commitment estimates are higher still, presumably because they project 2010 GHG levels. From the Second Order Draft (p. 12-60):
“Constant emission commitment” is the warming that would result from keeping anthropogenic emissions constant and is estimated for example at about 1–2.5°C by 2100 assuming constant (year 2010) emissions in the future, based on the MAGICC model calibrated to CMIP3 and C4MIP (Meinshausen et al., 2011a; Meinshausen et al., 2011b) (see FAQ 12.3).
At the low end, that is more warming than was seen during the 20th century, at the high end it is 3 to 4 times 20th century warming. Guess that nixes the idea of rapid ocean equilibration.
Talking out of both sides of their mouths
These commitment findings should be taken with a grain of salt. Would current levels of GHG forcing, which have coexisted with no statistically significant warming for 15 years now, really cause the present century to warm twice as fast as last? Such wild prognostications show how extravagantly the “consensus” scientists are willing to exaggerate in favor of their anti-CO2 narrative, but they can’t have it both ways. If they expect the persistence of a mildly elevated GHG forcing to cause many decades of substantial warming then it is pure dishonesty to turn around and declare that persistently elevated solar forcing, regardless of its level, could not cause more than a decade or two of warming.
Some of these scientists have done very important work. Ilya Usoskin, for instance, has been a pioneer in developing cosmogenic nucleotide proxies for solar activity. That makes it unsettling to have to call him out, but HEY USOSKIN, it’s about time you renounced the BUT in Usoskin et al. 2005:
The long term trends in solar data and in northern hemisphere temperatures have a correlation coefficient of about 0.7 – .8 at a 94% – 98% confidence level.
BUT:
During these last 30 years the total solar irradiance, solar UV irradiance and cosmic ray flux has not shown any significant secular trend, so that at least this most warming episode must have another source.
Usoskin himself classifies 1920 to 2000 as a “grand maximum” of solar activity, thus his claim here is that even if a historically powerful driver of climate remains at a high level for an extended period of time it will still not cause continued warming. To cause continued warming it would have to keep going up (to higher than high levels).
Does he actually believe that, or did it just seem like a small price to pay to stay in the good graces of the funding institutions that Al Gore, Maurice Strong, James Hansen, Stephen Schneider et al. established in the 1990s? In fact it is a huge price to pay. It is a complete debasement of scientific principle, handing the anti-CO2 crusaders an utterly fraudulent grounds for dismissing the alternative solar-warming hypothesis, and pretty much all of the leading solar scientists have embraced the same trope.
Whether this is bias or cowardice it needs to stop, and for anyone who wants to be silenced no longer, the commitment studies offer an ironclad opportunity. After all, the GCM guys have their own field of expertise. If the computer modelers insist that a steady high level of forcing will cause at least several decades of substantial continued warming then who are the solar scientists to contradict them? All they have to do is stop making highly speculative claims about ocean equilibration that lie completely outside of their field and are unsupported by any reason or evidence.
Usoskin’s solar estimates are “grand maximum” even if post-1945 Waldmeier-era sunspot counts are reduced by 20% as Leif Svalgaard urges
Usoskin uses a “high activity threshold” of 50 so even if his sunspot counts (“75 ± 3 since 1950“) are reduced by 20% they are still at “grand maximum” levels from the 1940s to the 1990s by Usoskin’s criteria.
Hat tip to Lucia Liljegren
I asked Lucia if she knew of any GCM tests of the solar warming hypothesis. Had the “consensus” ever GCM-tested their oft-repeated claim that even if there were a substantial mechanism of enhanced solar forcing it could not have caused late 20th century warming?
Not that she knew of, but she suggested that the results of a persistent elevated level of solar forcing should be roughly the same as for a persistent elevated level of GHG forcing, as examined in the commitment studies. In both cases the amount of warming would be the same. Both would be calibrated to account for observed 20th century warming, so the resulting ocean equilibration process should be similar.
Thanks Lucia. The “consensus” has indeed already in-effect GCM-tested the alternate hypothesis, with just a slight change in time frame. Fifty years of high solar activity beginning in 1950 are analogous to fifty years of 2010-level CO2 forcing beginning in 2010, and the predicted warming from the CO2 commitment testing directly contradicts the stated rationale for dismissing a solar explanation for late 20th century warming.
Alec Rawls, you ask:
“even if there were some substantial mechanism of enhanced solar forcing it couldn’t be responsible for late 20th century warming because solar activity was roughly constant from 1950 to 2000.”
The constancy is the mechanism:
http://vixra.org/pdf/1108.0004v1.pdf
This is a preliminary version of David’s paper; it is currently being checked and revised.
@ferd berple says:
January 9, 2013 at 9:59 pm
Why is June 21, the first day of summer, not the warmest day of the year in the Northern hemisphere? Solar energy is at maximum on that day. Why do temperatures keep increasing even though solar energy is falling after June 21? Surely this is impossible under the teachings of climate science. Rising temperature requires rising solar energy, otherwise CO2 must be the cause.
+++++
Amen Ferd Berple.
Now maybe you can talk with Leif and Mosher. Of course their response will be some overly detailed or ambiguous rant. You may even hear we are not qualified to understand.
I work in process control automation as an engineer, project manager, and wear many hats including one developing new business. I sell things that have not been invented yet, and then develop solutions marrying automation with solid scientific and engineering principles. This usually requires working with people smarter than me in a team where I am responsible for the overall outcomes.
I have NEVER had a welding course or welding torch in my hand! Yet worked to develop $650K welding machines which are sold to nuclear plants and even to GE Nuclear. I’ve had to devise new ways to weld 6 foot DIA lids onto 18 foot tall spent nuclear fuel canisters. I’ve developed weld programs and welding process techniques to easily seal these $750K spent fuel canisters –all this while the actual “nuclear welding experts” who are qualified to weld essentially say – “yes that is good… no that is bad.”
I’ve worked with people in solar heating automation where I had to explain to them cold junction compensation when it comes to thermocouples… while convincing them to use platinum RTDs instead. As well I had to explain basic thermodynamic principles so that they could understand how much energy they were pumping, while deciding where to put the warmed fluids to do the most efficient work (heat the pool, house or hot water etc).
I’ve helped to implement robotics controls on other companies’ wafer handling robotics mechanisms to make them work better than using their own factory control boxes. Under our control, they perform autocalibration – which means they can move about and learn their way around a tool by finding feducials via torque sensing algorithms of closed loop servomotors while discerning reflected inertia in ways that look different than stiction, as well as taking advantage of existing laser sensors which might be there –and so any robots under our control could pick and place 300mm si wafers without having to be manually taught by an operator for several hours!!! Good automation makes most robots able to be self taught in minutes… and with more precision… and accuracy than jogging around manually and teach pick & place locations.
The point is: When I delve into new science, if it doesn’t work I don’t get paid. I go hungry. I hate it when arrogant “climate scientists or specialists” tell me or others that I/we are not a (fill in the blank scientist) therefore I/we would not understand.
Here, at WUWT, I am humbled by the intellect here; while at the same time can usually tell when I am being duped.
The odd thing is that though Mosher and Leif are very highly educated –and very smart; they have the same quality of some bad engineers that get lost in the details and fail to see what’s real and true regardless of reason, logic and outcome. They are impossible to work with. They are religious about their beliefs and often times get everything wrong and waste a lot of other peoples’ money with their heads buried in ideology. Yet they hold higher level degrees.
Leif and Mosher, my assumption is that you do not get paid by someone in the private sector who’s business lives or dies by your being right. Still I think you are smart as hell.
The arguments being pandered in the opening statements are ludicrous.
The only way those statements can be true is if THE ONLY VARIABLE IN THE ENTIRE EARTH-SUN-MOON-SOLAR SYTEM COMPLEX OPEN SYSTEM IS SOLAR ACTIVITY.
This is quite clearly twaddle, so let’s list the possible things which could also vary and affect global temperature:
1. The stable state in the mesosphere or atmosphere may have shifted to a new state with different responsiveness to solar/cosmic ray inputs. What, after all, was the effect of CFCs on that? Any other known impacts on ozone either in the Northern- or Southern Hemispheres??
2. The Great Pacific Shift of 1977 may have marked a major shift in the distribution of oceanic heat, thereby affecting global temperature on a decadal scale, especially given the striking preponderance in the frequency and intensity of El Niño episodes since 1977. One wonders whether a 30 year period showing equally frequent and intense La Niña episodes would drive temperatures back down to 1975 levels?? Will the shift of AMO to cold mode see the start of that???
3. There may be cycles in earth-crust-ocean interactions which affect ocean heat content which we are as yet unaware of. A shift between modes may have occurred in the past 40 years. We’re now seeing evidence emerging of tectonic activity linked to solar-atmospheric geomagnetic phenomena, so why not similar events less visible to the naked eye?
4. We have still not identified the drivers of the multi-centennial climate beats which caused the Roman Warm Period, the Fall of Rome, the MWP, the LIA and the modern warm period. The 200 year warming since 1812 is the manifestation of that driver, just as the 200 year cooling down to 1650 was the reverse. One wonders whether the oceanic conveyor belt system has anything to do with it, since this will have profound effects on the boundary of North Atlantic polar ice, the climate of NW Europe etc etc.
5. The ‘loss of correlation between solar cycle length and temperature since 1970’ is an artefact of temperature data gathering and calculation methodologies. We all know what has been going on in that arena, what I’ve not seen is whether that affects the solar cycle-length-temperature graph….
6. Et al, et al, et al.
Now it may be that, behind firewalls, all these issues have been comprehensively dealt with using science which is rigorous, dispassionate, skeptical and which has stood up to challenge. If so, the general public would welcome a non-technical but exhaustive documentation of that to put those arguments to bed.
I have my doubts myself.
But it’s best not to make judgements without being armed with all the facts…..
It is very clear that none of the so-called scientist contributors to the IPCC understand heat transfer. They do not understand heat transfer by radiation (note the S_B equation only applies to surfaces in a vacuum), heat transfer by convection (natural which involves the Nusselt, Grasshof and Prandtl numbers and forced which includes wind velocity or the Reynolds number) and heat transfer by phase change (in this case evaporation and and condensation of water)
The best thing would be to disband this group of incompetents
@davidmhoffer says:
January 9, 2013 at 10:21 pm
Mario Lento;
Let’s call the AGW crowd what they are – science deniers.
>>>>>>>>>>>>>>>
’tis an ugly term, and no more applicable to them than to us. Further, like skeptics, one size does not fit all
+++++
Agreed… you are correct David. I was being a bit of a jerk. I just now realized I was writing while peeved as hell. I’ll stop now.
“indirect solar forcing,” or “enhanced solar forcing,” or “solar amplification,” all just meaning “more than TSI alone.”
Try the variation in ultraviolet radiation. A look at the absorption spectrum gives the answer.
http://wattsupwiththat.files.wordpress.com/2008/06/atmospheric_spectral_absorption.png
http://www.globalwarmingart.com/images/7/7c/Atmospheric_Transmission.png
All of the ultraviolet light is directly absorbed by oxygen and ozone up to over 340 nanometers. These wavelengths photons are far more energetic than an IR photon. Since all of the energy is absorbed directly in the atmosphere any variation of that energy flux directly effects the amount of energy in those molecules.
We already know that in the cycle 23/24 minimum that the exosphere contracted to its lowest altitude since the dawn of the space age when we could accurately measure its density due to its effect on satellites (drag). We have very little idea about what happens to the energy level in the atmosphere at altitudes between 25 km and 150 km as these altitudes are too high for balloons and too low for a satellite to sample.
Some papers (Zhang 2007) squawk about how the ozone hole cools the atmosphere but he never takes into account the fact that a reduced level of incoming energy from the sun does the same thing. Studies have shown up to 50% variation in the energy at these wavelengths. We need more actual information, data, and sampling at these altitudes, not more models and arm waving.
Nick Kermode asks: “Do you mean ‘other’ hypotheses? The alternate hypothesis ( as apposed to null ) is exactly what is being tested with the GCM’s”
Yeah, I wasn’t using “alternate hypothesis” as a term of art. I just meant alternate to the CO2-warming hypothesis. To avoid confusion, I should call the solar-warming hypothesis “the leading competing hypothesis” or something like that.
Mario Lento says:
January 9, 2013 at 11:25 pm
Leif and Mosher, my assumption is that you do not get paid by someone in the private sector who’s business lives or dies by your being right.
As for me you are wrong. Stanford is a private University and I get payed for being right [research being accepted or at least valid]. For about a decade I worked in private industry and that business’ life was very dependent on my being right.
And note: I don’t believe we need a “grand maximum” to warm the climate. When you have a period of several grand minima in relatively close proximity in time, a return of a long run of average sized cycles would be enough to warm things back up over time, if the solar wind / UV would have a climate impact. We have been nearly 200 years without a very “weak” cycle and it now looks like we might get at least two consecutive weak ones. What I meant to say in my earlier comment was that I would not expect the climate to instantly warm all at once in response to a return to normal cycles after about 500-600 years or so of many weak cycles as we saw in the LIA.
Mario Lento says: January 9, 2013 at 11:25 pm
“..I work in process control automation as an engineer…”
Just as an aside:
Many years ago I came to the conclusion that amongst all the smart, organized, get it done people I have met, the process engineers were always right at the top of the list in whatever field they had ventured into.
Good one Leif. You jump from your usual assumption of near-instantaneous equilibration and no hysteresis to imagining equilibration that takes a hundred million years, managing to keep your eyes at all times as far as possible from the intermediate time scales that are the subject of the post. Bravo. If only the IPCC had the foresight to do the same, but they went and blew it, doing commitment studies that on the time scale of multiple decades to multiple centuries show a substantial continued temperature response to a step change in forcing. What blunderers. They let the cat out of the bag.
@Leif Svalgaard
[snip . . read the site rules . . mod]
But I am willing to help. As soon as you’re ready to extricate yourself from yourself, give me a call and I’ll give you a hand.
So in your view Leif, the later GSN numbers need to be reduced by 50%? Going how far back?
I believe there is starting to accumulate a body of evidence that changes in circulation at high latitudes can result from changes in solar UV due to changes in heating of the stratosphere. There is correlation, but there isn’t a causal mechanism that has been 100% nailed down yet. We see that when the sun goes quiet the EUV drops considerably while TSI overall is little changed. So it isn’t so much the total amount of energy so much as it is the mix of energy across the spectrum. Different wavelengths of light have different impacts to different parts of the Earth.
It has been demonstrated by experiment that particles with the energy of GSRs can increase the availability of atmospheric aerosols. We are still waiting for data to show any changes in cloud cover against changes in neutron counts measured here on Earth but that is also a potential avenue. So it may not be ONE silver bullet. It might be two or more and they might work in different ways. A combination of stratospheric cooling, reduced ozone production, increases in GCRs, potential “whitening” of Earth by even as little as 1% taken together at the same time might have considerable impact over areas where a lot of people live and a lot of crops are grown.
All it takes is movement in location or weakening of a persistent pressure system to greatly change the weather across central Europe Wind patterns changing from a zonal flow to a meridional flow might be enough to cause severe cold and storminess to drop across central Europe without even causing a great change in GLOBAL average temperature. Just changing where the cold air is might be enough. Or a weakening of the polar jet to allow polar air to slip a little farther South in winter could make a huge difference.
We are getting ready to experience a very cold period in about 10 days time stretching from China to Europe with temperatures in Moscow forecast to be some 30 degrees below normal according to Joe Bastardi over at Weather Bell. He is talking about weather we haven’t seen “in the last 50 years”. Today there was snow across the Levant with a foot of new snow in Jordan and Lebanon. Athens schools were closed due to snow. It is snowing in Damascus. Nearly 200 have died in India from cold in the past month. The interior of Alaska is seeing tremendously cold weather this winter. This isn’t limited to one small part of the globe. 2010 was a cold winter in Europe, too and now it looks like 2012 might turn out worse across a larger area (but maybe not the same areas as 2010).
We certainly aren’t seeing barbeque summers and warmer than normal winters.
@markx says:
“Just as an aside:
Many years ago I came to the conclusion that amongst all the smart, organized, get it done people I have met, the process engineers were always right at the top of the list in whatever field they had ventured into.”
Thank you… I think it’s because we are motivated to implement science that works, otherwise we don’t get paid, for long. We actually have to solve real problems in economically sound ways. The academics often times (certainly not always) believe their own hype more than what’s real.
I am incredibly fortunate to get to work with really smart people across multiple disciplines –and often times, blow their minds with what is possible. Imagine, someone with no welding expertise, manages to help specify, design, operate and train expert welders right there on above nuclear reactor spent fuel pools on how to make better production welds than virtually anyone else on the planet. I credit the brilliant engineers all doing their part so that I can play with expensive toys and see what happens.
Mario
@Alec Rawls: You are on the right side of science. Your statements are cogent, and full of logic with good clear explanations.
Thank you Anthony for including his writings for us to learn from.
I’ve been going against the tide since Al Gore’s movie made me a skeptic… it’s amazing how easily other people can be hoodwinked by having watched that movie without having a ton of questions!
WUWT has given me hope that there are people who understand what’s going on – and have stuck out their neck diligently against an angry foolish public.
You’re true soldiers Anthony and Alec.
If one subtracts properly calculated effects of solar and GCR forcings from observed temperature,
the result is largely like a sawtooth wave, presumably representing the echo effect of El Ninos returning
prior ocean heat to the atmosphere. (Much of temperature effect from forcing change is about
immediate; a portion is effectively delayed by several years as far as the troposphere is concerned; and another portion is delayed by longer, being the real world where matters are not simple like everything being exactly the same X years delayed in all ocean layers at all depths simultaneously).
I haven’t made up a fancy illustration of that yet for posting here. However, if the reader who is among the
majority who have never actually seen the strikingly blatant solar/GCR cycle versus humidity
correlation and many other illustrations in http://s7.postimage.org/69qd0llcr/intermediate.gif
(click to enlarge), I’d encourage seeing such as a start.
If I recall correctly, other applied biases of the IPCC include using a higher climate sensitivity
on calculated radiative forcings from GHGs than from TSI per W/m^2 (and that is while ignoring
the cloud cover change, GCR influenced, which is more W/m^2 variation than the TSI variation,
like, for instance, http://www.drroyspencer.com/2011/05/indirect-solar-forcing-of-climate-by-galactic-cosmic-rays-an-observational-estimate/ illustrates).
Henry Clark says:
January 10, 2013 at 1:09 am
http://s7.postimage.org/69qd0llcr/intermediate.gif
—————————————————
Impressive correlations.
Lies, unraveled.
Thanks for the article. I have a question about the CO2 commitment models. Are you saying that in their commitment models the atmospheric CO2 fraction remains constant (eg, at 400ppm)? I thought the forcing was directly proportional to the CO2 fraction in the air, and perhaps their idea of constant means a constant rate of emission and so wouldn’t the CO2 fraction still increase with time, but at a slower rate?
“It is very clear that none of the so-called scientist contributors to the IPCC understand heat transfer. They do not understand heat transfer by radiation (note the S_B equation only applies to surfaces in a vacuum), heat transfer by convection (natural which involves the Nusselt, Grasshof and Prandtl numbers and forced which includes wind velocity or the Reynolds number) and heat transfer by phase change (in this case evaporation and and condensation of water)
The best thing would be to disband this group of incompetents.”
Yes, none of them could pass a heat transfer exam. It’s a travesty.
I guess I am revealing my age here, but whenever you read about the models’ addiction of professional ‘climate scientists’ and their forecasts of Thermageddon, are you not reminded of Dr Strangelove (played by Peter Sellers) and his surreal view of the world’s future?
Since 2000 10 months of the year in Central England are trending down a degree or two Celsius. March and April are the only months trending up, by about a degree. December is trending down by 3.5 degrees celsius and February by 2 degrees.
Is it just a coincidence that this is happening during a low sun spot cycle?
Alec,
Whatever these top scientists say, they are quietly doing the research into the ongoing GCR link. In four days time, NASA’s ATTREX study will begin flying a drone over the equatorial east Pacific and, later, west Pacific:
http://espo.nasa.gov/missions/attrex (but don’t click on it yet!).
They are quite coy about the fact that they have NOAA and Goddard Space Flight Centre (of which GISS is a subsidiary) in the project. What’s more they are looking, among other things, at water vapour and ‘radiation’. This link isn’t very informative about this, but I included it if anyone wants to check ATTREX exists. I only know of the water vapour and radiation part of the research because I’m on the NASA email notification list. The email (recieved today) went into more detail but was very careful not to say GCR let alone GCR-water vapour link. I posted the email on WUWT’s tips page today (10th January 2013) if anyone wants to read it. I mark eleven places in the email which point to the GCR subtext and also to attempts to play it down. I think it will make a good article because if they are looking at the GCR link we need to hold their feet to the fire on what they actually find. The data could get mentioned-yet-glossed-over if a substantial link is found…just like Sherwood mentioned but glossed over the results in the 3 GCR link papers in chapter 7 of AR5.
I return to my central heating analogy. Unless these guys have changed physics (due to AGW I suspect). It is 0.0°C outside, I come home at 6pm. The house is cold at around 1.0°C. I turn the central heating on, the thermostat being set at 18°C (to reduce my carbon footprint to protect the penguins/whales/polar bears/Gaia, etc). Now, if they are right & I am wrong, the house should heat up immediately to 18°C. Unfortunately it does not. Due to the various thermal/insulation properties of the construction materials used to build my house, the thermal efficiency of the boiler, the pump, the radiators, the thermostatic valves, the thermal efficiencies of the windows/doors/draft exclusion, the actual size of property etc, even the efficiency of the fuel used to run the boiler be it wood/ coal/oil/gas//composite/other, etc. It may take anything up to an hour or more to reach the desired 18°C internally, assuming the temperature outside doesn’t drop further in the meantime!!! The boiler is running at constant output but is inefficient at first because it needs to heat itself up to make the most of that constant output. Surely there is a similar process on a much grander scale for the Earth & its climate & its response to external & internal factors that actually do drive the climate! I just cannot accept one tiny trace gas can accommodate all the thousands of parameters involved in climate, positive & negative! The IPCC admit openly if one looks, that they claim they know all about CO2, having a very high level of scientific understanding, yet knows very little about the Solar forcing having a very low level of scientific understanding!! As they say themselves……………”We don’t know exactly how element ‘A’, the Sun, affects element ‘B’, the Earth & its Climate, but we know for a fact that element ‘C’, manmade CO2 overpowers element ‘A’!” The most ridiculous thing I have ever heard ever! I wouldn’t buy a used car from these people, no disrespect to secondhand car salesmen/women, your integrity is assured!