
by Roy W. Spencer, Ph. D.
Here’s the global average sea surface temperature (SST) update from AMSR-E on NASA’s Aqua satellite, updated through yesterday, July 7, 2011:
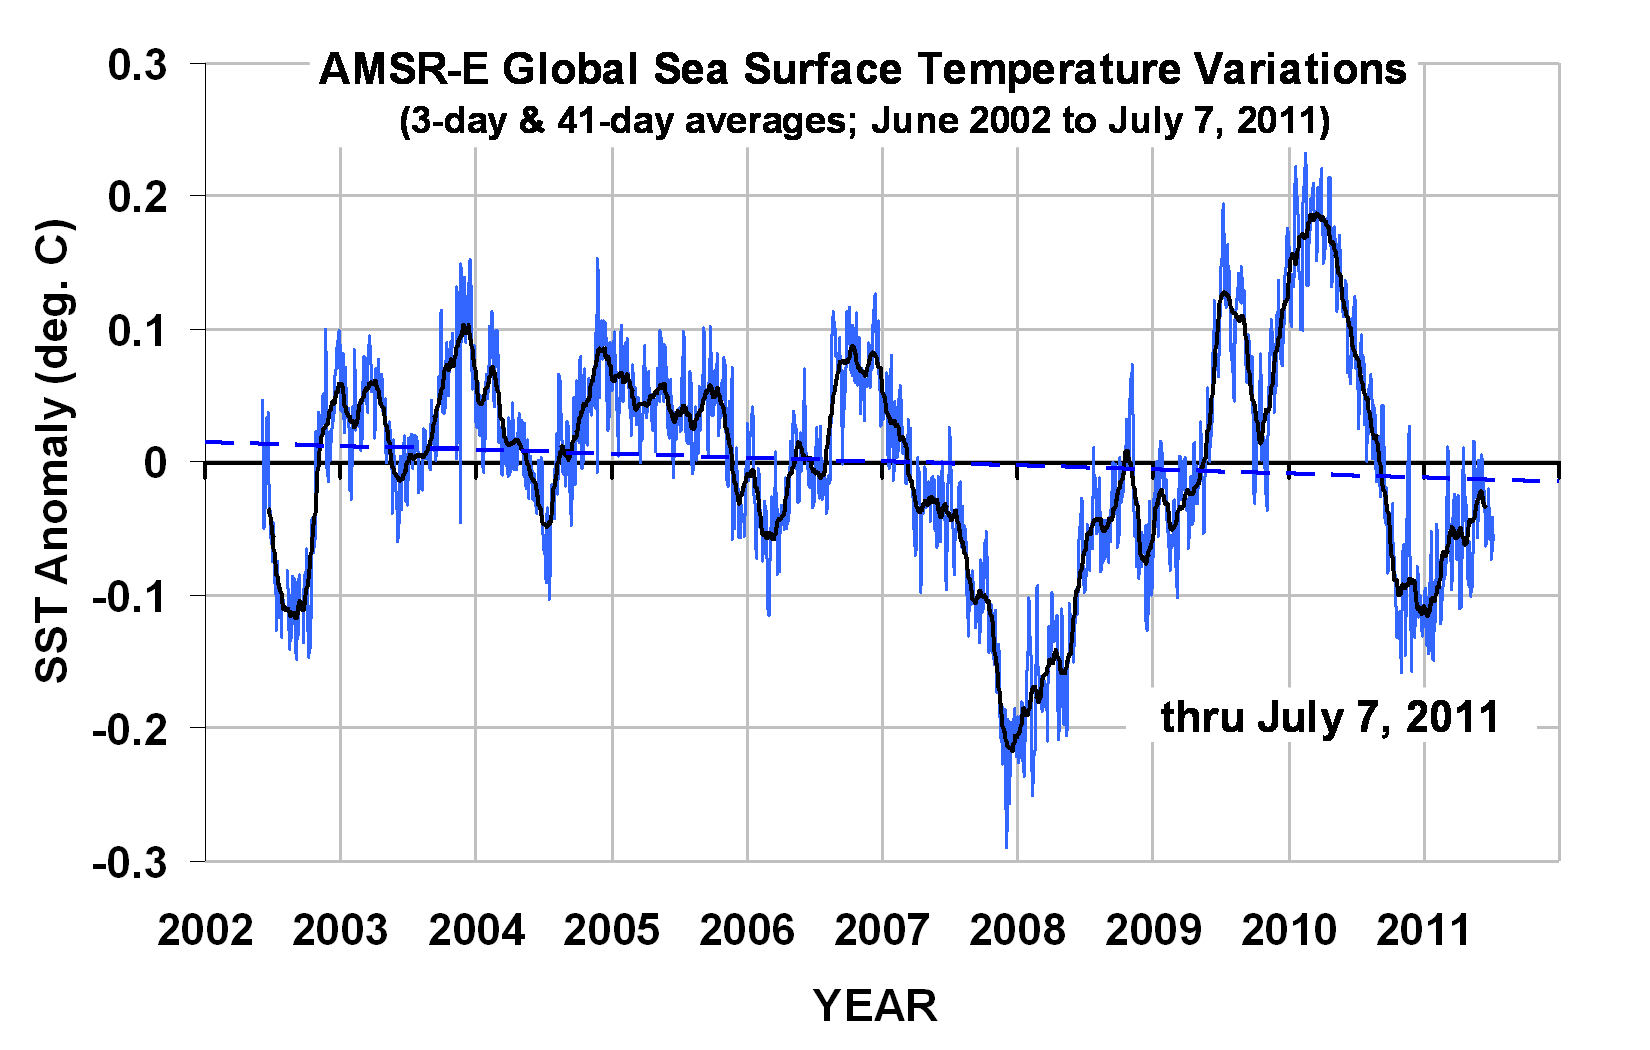
The anomalies are relative the existing period of record, which is since June 2002.
As can be seen, the SSTs have not quite recovered from the coolness of the recent La Nina.
Something else I track is the ocean cloud water anomalies, also from AMSR-E, which I have calibrated in terms of anomalies in reflected sunlight based upon Aqua CERES data:
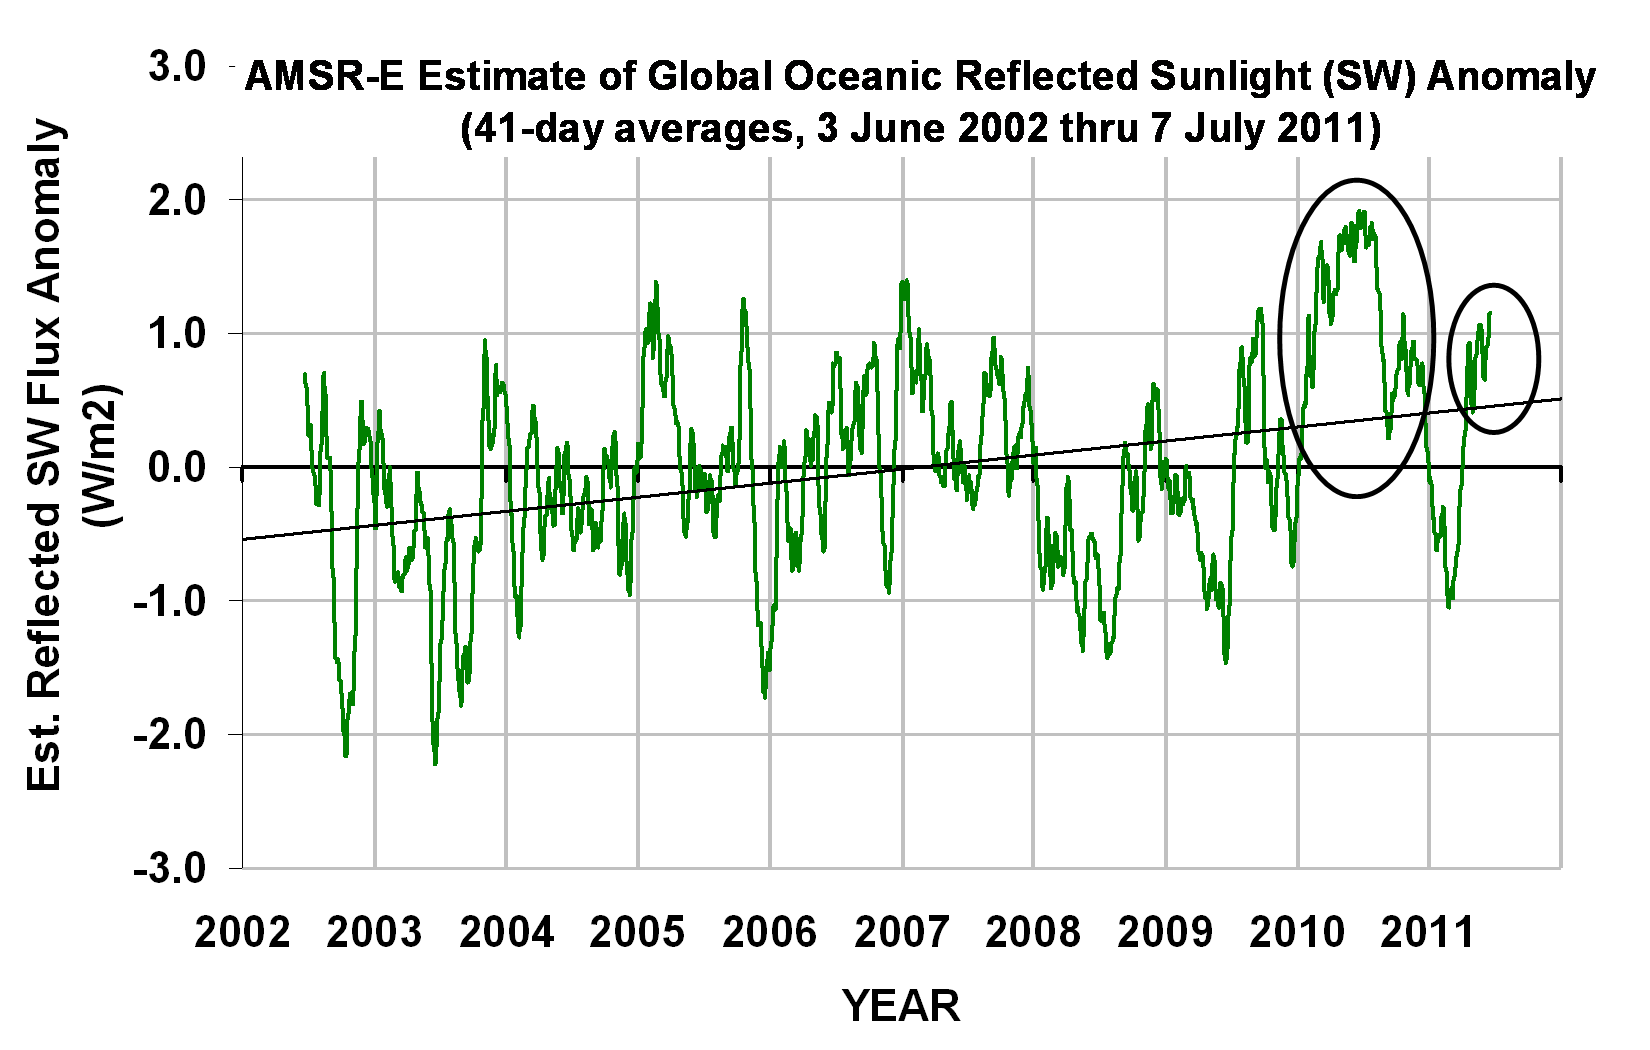
Why I watch this is it often predicts future SST behavior. For instance, the circled portion in 2010 shows a period of enhanced reflection of sunlight (thus reduced solar input into the ocean), and this corresponded to strong cooling of SSTs during 2010 as seen in the first graph.
So, the recent new enhancement of cloudiness (smaller circle) suggests a fall of SST in the next month or so. After that, it generally takes another month or so before ocean changes are transferred to the global oceanic atmosphere through enhanced or decreased convective overturning and precipitation.
==============================================================
See also this story on the sun: Solar activity report: the sun is still in a funk
AJB says:
July 9, 2011 at 5:54 pm
And here is the same thing since 1964. And your point was?
The Oulu neutron count does not have correct calibration. Other stations do not show that the recent minimum was significantly higher that other minima between odd and even cycles, e.g.
http://www.puk.ac.za/opencms/export/PUK/html/fakulteite/natuur/nm_data/data/SRU_Graph.jpg
Look at Hermanus. or Thule: http://www.leif.org/research/thule-cosmic-rays.png
or Kiel: http://www.leif.org/research/Cosmic-Rays-Kiel-1959-now.png
or compared to several other stations: http://www.leif.org/research/Cosmic%20Ray%20Count%20for%20Different%20Stations-Oulu.png
Note how the ratio keeps going up.
Wil says: “The IPCC position is that the sun has nothing to do with global warming or climate change.”
Well, that is not entirely true, and the way that it is not true is important. The IPCC reports and many AGW proponents have said that the variability within solar cycles, and between solar cycles, has only a miniminal influence on global temperature over on the 1880-2000 period that they usually focus on. However, we are now not talking about normal variability, but about the possibility of something which is extraordinary on this time scale…a Maunder minimum.
So, it no longer follows that “all the wild talk about a quiet sun, little ice ages, ocean cooling etc., and this article is just denier talk.” No, there is now a way out for the warmists here.
Sure, we might fancy knocking ’em off their high perch, and then keep kicking until they stop yabbering, until the body stops movin’. Yeh! But I dont think that will work because the dogma has immense inertia (funding, reputations etc) and the proponents have immense institutional power.
Instead, we could play a diplomatic game more likely of success. That is, if the evidence grows of a Maunder-like event and a corresponding cooling effect — i.e., the picture starts to emerge more and more in the empirical data as the months go by — then there is a way for them not to loose face, where they can say something like:
Well, yes, the AGW effect was an urgent problem, but, now that this extraordinary natural event is happened, it’s effect will overwhelm AGW for a century or so.
And we mumble, Yeh, sure thing, whatever you say mate.
But the momentum is lost, and the issue dies.
Why don’t the temperatures fall in response to La Ninas? It would seem that if the temps rise in stairstep fashion, that the overall effect is an increase in sst. Is this just the warm PDO? And, should we expect a downward stairstep in response to the cold PDO?
So are we
(a) very slightly doomed
(b) moderately doomed
(c) doomed at a bog-standard level
(d) very doomed indeed
?
@Leif Svalgaard, July 9, 2011 at 6:28 pm
Agreed.
Bob Tisdale,
You are making the (what I believe is a false) assumption that the the level of solar activity has little or no role in driving the ENSO phenomenon that you believe is responsible for ocean warming and cooling.
Would like to see the historical SST trends for the northern oceans say north of 60 degrees. What would this look like for the longest period we have accurate records for?
@Leif Svalgaard, July 9, 2011 at 5:24 pm
I found something that explains perhaps what lead to a discontinuation of the data postings for SORCE TSI.
http://lasp.colorado.edu/sorce/news/sns/2011/SORCE_News_2011_04_05.pdf
This April-May Newsletter has an article on the continuing degradation of one of the batteries affecting some measurements.
As to why there are any ITAR restrictions, I don’t have a clue.
Leif Svalgaard says:
July 9, 2011 at 6:28 pm
Does that include Moscow Neutron Monitor?
http://cr0.izmiran.rssi.ru/mosc/main.htm
And this set: http://www.puk.ac.za/fakulteite/natuur/nm_data/data/nmd_e.html
For an odd/even cycle, this 23/24 that is supposed to be sharply peaked, it has a rather wide base so far. Out of character, and is showing higher levels that increase as one heads closer to the Poles, but not everywhere. I would be looking at the Earth’s magnetic fields for clues.
Some good stuff on the cosmic ray link from Dr. Roy here…
http://www.drroyspencer.com/2011/05/indirect-solar-forcing-of-climate-by-galactic-cosmic-rays-an-observational-estimate/
“…Finally, I fitted the trend lines to get an estimate of the relative magnitudes of these two sources of forcing: the cosmic ray (indirect) forcing is about 2.8 times that of the solar irradiance (direct) forcing. This means the total (direct + indirect) solar forcing on climate associated with the solar cycle could be 3.8 times that most mainstream climate scientists believe…”
Leif,
I know that magicjava ( not his real name) ran into the ITAR wall when he tried to get the satillite code ( belly of the beast stuff). Since ITAR is used (in my experience) to control munitions and other defense related information ( code that has to do with weapons, information related to weapons or war fighting ) I’m gunna bet that the information is being delayed due to war fighting considerations. Just a guess
Leif Svalgaard says:
In short: the information is classified [for ‘non-US persons’]. Now speculate why that would be so…
Because the americans now own the sun as well as the moon ? The UN means Universe Next ?
Horror! Stored coolth in the oceans. Is it leaking out?
I know I am probably deluding myself but my eyeball says the cloud curve has a similar shape to the SST curve, except the cloud curve peaks and troughs are after the SST peaks and troughs.
Thus kind of suggests maybe warm SSTs cause more cloud.
Anyone like to come up with a transfer function that gives the same apparent phase but has causation reversed?
Ninderthana says: “You are making the (what I believe is a false) assumption that the the level of solar activity has little or no role in driving the ENSO phenomenon that you believe is responsible for ocean warming and cooling.”
Where in my comment on this thread or in the linked post did I write something that discussed the impacts of the solar cycle on ENSO?
Kum Dollison says:
July 9, 2011 at 6:26 pm
“Well, all that said, it seems that, according to the AQUA Satellite it’s now just as danged hot as it was this time last year.
http://discover.itsc.uah.edu/amsutemps/execute.csh?amsutemps ”
Well just to reiterate Kum: Can anyone shed some light on this, we went through a troposphere temperature fall at the turn of 2011 and now that sems to have been negated witk Kum’s link showing we are as hwar or even warmer than this time last year, We also have the artcic sea ice now looking set to beat the 2007 low and yet we are seeing lower sea temperatures? We’ve also got a slumbering sun spot activity sun and had a few volcanoes pop their corks over the last several years. All of this somehow adds up to tropospheric tempertaure higher than this time last year and that was blamed on el nino. Well now wer’e post el.nino, have low sunspot activity, a negative pdo, volcanoes ect and surely all this should be manifesting surely lower atmospheric temps than we are currently seeing!!!!
None of it makes sense to the average idiot like me.
At this rate I’m going to become an ex-sceptic or a sceptical denier
Lawrence
In short: the information is classified [for ‘non-US persons’]. Now speculate why that would be so…
Leif, you gotta be kidding me. I would like to see the order on this from DTRA.
rbateman says:
July 9, 2011 at 11:45 pm
Does that include Moscow Neutron Monitor?
And this set: http://www.puk.ac.za/fakulteite/natuur/nm_data/data/nmd_e.html
For an odd/even cycle, this 23/24 that is supposed to be sharply peaked, it has a rather wide base so far. Out of character, and is showing higher levels that increase as one heads closer to the Poles, but not everywhere. I would be looking at the Earth’s magnetic fields for clues.
Yes, I included those. Thule which is almost right at the [magnetic] pole does not show any increase. Now, the shielding is energy dependent and the entry into the heliosphere of very low-energy GCRs was a bit better this minimum. You are correct that the variation of the Earth’s magnetic field is a very important factor and that variation is not the same at every station. For the effect on climate, one should presumably use a global ‘average’ of high-energy GCRs. The ‘peakedness’ is not intrinsic to the GCRs but simply to how long the minimum lasted. A drawn-out minimum makes the peak broader,
Dennis Wingo says:
July 10, 2011 at 6:28 am
“In short: the information is classified [for ‘non-US persons’]. Now speculate why that would be so…” Leif, you gotta be kidding me. I would like to see the order on this from DTRA.
Well, perhaps ‘restricted’ is better than ‘classified’. Fact is that someone must have brought in the ITAT requirements recently, because the Weekly Status Report was issued until recently.
Hey! Listen up! LazyTeenager is on to something. What better example of negative feedback than warm water causing more clouds to reduce heat input to the oceans. How about a correlogram, you e-graphicers? Warmists, eat your hearts out!
I disagree with the use of the word “anomaly” in climate discussion. Anomaly implies unusual or different, and what you are actually talking about is normal variation. It may be pointless to try changing the word used since the climate alarmists have hijacked the use of anomaly from the beginning, but leaving it smacks of 1984. Language conditions thought.
In the Inland Pacific NorthWest, we are setting new low daily record temps. Many records go back to the early 1900’s and some even further back. Newly installed sensors are also breaking records. The cold we are experiencing is typical of La Nina. The hot in the South is also typical of La Nina. So a La Nina and a La Nada can bring about both record cold and record hot. It all depends on what the La Nina-loopy jet stream is doing.
In summary, if you are hot or if you are cold, if you are wet or if you are dry, chalk it up to weather pattern variations known to exist in your area.
Falx says:
July 10, 2011 at 2:58 pm
I disagree with the use of the word “anomaly” in climate discussion. Anomaly implies unusual or different
In climate ‘anomaly’ is the deviation from the 30-year ‘normal’ values. So nothing anomalous or strange. The word does not have any negative connotations.
“The word does not have any negative connotations.”
They use it precisely because it does have negative connotations even though none are technically intended. Just like all the other words they (climate scientists) cobble from other fields or languages, then pervert simply to either exaggerate the significance (one of those words) of their claims or to enhance the fear associated with their claims.
Mark
Roy,
From your data it looks to me like short wave reflectivity is lagging the change in SST. So, as the ocean warms reflectivity increases and the natural thermostat is seen to be working.
Is the data available to track change in short wave reflectivity by latitude and therefore by hemisphere? I think it desirable to drill down to this level of detail to track disparate trends related to time of year.
The greatest variability in tropical and global sea surface temperature occurs in January when the global average reaches its minimum and the Earth is closest to the sun. When and where is the variability in short wave reflection greatest? This is particularly of interest where variability occurs over the ocean. My guess is that you will see the greatest variability in the north east Pacific, the north east Atlantic, the Atlantic east of Argentina, south east of Australia and south east of Madagascar. This variability will be tied to variation in surface pressure at higher latitudes in turn related to the strength of the coupled circulation of stratosphere/troposphere over the poles as related to the AO(Arctic Oscillation) and AAO (Antarctic Oscillation) also described as the northern and southern annular modes.
It would be of interest to compare short wave reflection with precipitable water levels.According to ESRL at http://www.esrl.noaa.gov/psd/cgi-bin/data/timeseries/timeseries1.pl precipitable water is of latter years staging a strong recovery after thirty years of depression. Depressed precipitable water represents a sticky and unresponsive thermostat. So depressed precipitable water would be associated with reduced short wave reflection.
Mark T says:
July 10, 2011 at 4:32 pm
“The word does not have any negative connotations.”
They use it precisely because it does have negative connotations even though none are technically intended.
No, they don’t. This is accepted technical language and does not have negative connotations. You [and many others] are the one that makes it negative.