Cloud cover changes are a “top-down dynamical driver” of Earth’s climate.
A July 2026 Environmental Research Letters paper authored by Bellocchi et al. attributes ~80% of the rise in Earth’s absorbed solar radiation since 2000 to declining high-reflectivity cloud cover, primarily from circulation-driven contraction of storm-cloud zones.
The study highlights the climate’s “albedo governance,” suggesting a 1% shift in Earth’s albedo corresponds to a 1°C surface temperature change.
With more cloud cover, more solar radiation is reflected and the surface cools. With declining cloud albedo, which has been observed since 1980, less solar radiation is reflected and the surface warms.
Cloud cover changes are driven by natural atmospheric circulation modes and internal variability. This is supported by reconstruction data showing cloud cover decline has for centuries occurred independently from “greenhouse-gas forcing.”

“Cloud clover” ?
I was thinking el falfa will give us lots of snow this winter. In any case, it’s a beautiful cool morning here in Boulder, great for a brisk walk.
😅I was wondering about that ….3 or 4 leafed?
That is a highly technical term referring to the property of clover, particularly 4-leaf clover because its broad leaves shield the ground beneath from sunlight, much like clouds.
Poor Beet on .
This ruins his day.
😉
;
Sadly, as a PhD scientist at a leading environmental institution, I must admit that there are scientists here that are as delusional as Warren. Nevertheless, there are some, like myself, who keep a low profile so as not to get our heads chopped off like a few too honest former colleagues. Still, we plant seeds of truth.
I must say that anyone who believes that consensus carries any weight in a scientific argument is just an idiot. (Enter smart guy to prove this point.) Scientist get paid to publish. They won’t get paid for long if they stray too far from the reservation.
To paraphrase George Orwell…
“There are some ideas so absurd that only Warren Beeton could believe them.”
“as a PhD scientist”
You investigate the credentials of PhDs?
Man, you must be overwhelmed with cases?
🤣😂😅🙂🤔😵💫😒🫨🥺😫😱
He also has the hots for Naomi Oreskes.
eeuuuwwww!!!
Had to down vote. That’s not funny, even in jest or /sarc.
Right, and you call me childish? Sometimes you are illogical.
Anyway, perhaps you’re projecting.
Perhaps stop paying them to publish since they are publishing fantastical trash.
Piled higher & Deeper?
I was once blocked from a university’s upcoming courses website for asking if their course in “Visible Minorities / Racialized Persons Gender Studies” was a new name for “Navel Gazing”
Good one. I once got into an extended bruhaha with a bunch of proud college grads who insisted navel studies are important to national defense, went on for several days, even though my second response was to explain naval and navel are entirely different things.
RE: “Still we plant seeds of truth”.
For many seeds of truth, you should check out the late John L. Daly’s website: “Still Waiting For Greenhouse” available at:
http://www.john-daly.com. From the homepage go to the end and click on “Station Temperature Data”. On the “World Map”, click on “North America” and then page down to U.S.A. Pacific. Finally, scroll down and click on “Death Valley”.
Shown in the chart are plots of the annual mean seasonal temperatures and the annual mean temperatures at the Furnace Creek weather station from 1922 to 2001. In 1922, the concentration of CO2 in dry air was ca. 303 ppmv (0.59 g CO2/cu. m.), and by 2001 it had increased to 371 ppmv (0.73 g CO2/cu. m. of air), but there was no corresponding increase in air temperature at this remote desert.
The reason there was no increase in air temperature in this arid desert is that the absorption of out-going IR light emanating from desert surface by CO2 is saturated. The threshold for absorption saturation for CO2 is 300 ppmv which occurred in 1920. The slight global warming since 1920 is not due to CO2 but to the reduction on air pollution,
For info on the absorption saturation effect, you should obtain:
“The Saturation of the Infrared Absorption by Carbon Dioxide in the Atmosphere” by Dieter Schildkneckt which is available at:
URL: https://arxiv.org/pdf/2004.00708v1
URL: https://arxiv.org/labs/2004.00780
The recent slight global warming is most likely due to reduced air pollution.
You should make copies of this paper and give it your coworkers. You should also inform them of the late John L. Daly website. He found over 200 weather stations that showed no warming up to 2002.
Finally, you send my comment to all your coworkers.
I mention Svensmark’s recent firing as the last gasp of “it ain’t the clouds/sun” position in Europe.
Willis has mentioned activity in the Equatorial Convergence Zone as a marker of cloud activity
It’s easy to be wrong in this game, but 80% of the SO2 emissions removed from the global shipping fleet starting in 2015 correlates with multiple metrics.
To that must be added the decline in aerosol pollution following the collapse of Soviet industry.
In the Clean Air Act of 1970 and its subsequent refinements, aerosols from all manner of fossil fuel powered machinery have been scrubbed more and more. The change to fuels used for shipping are a minor but effective part of that.
Yes, that is a different model, the one above is just based on global shipping. The attached plot is the land SO2 model. I need to put an Ice Age scare label on there.
Oh, I certainly didn’t mean that as a criticism of your work, or to diminish its relevance, or to come across as unpleasantly perfectionistic! It was simply an offhand remark… I hope I didn’t offend you.
I’m all the more embarrassed because, not being a scientist in the slightest, I’m in no position to judge the quality of one model or another. (That being said, I care very deeply about intellectual honesty, which those who defend “the consensus” seem to me to be sorely lacking.)
No offense taking Charles, I would love to combine these two into a single model, but they are too different, this is just a hatchet approach. There are some real geniuses out there that could and have produced a true global climate model of the SO2 emissions without the CO2 bias. The truth will come out this decade about the forcings that are the control knob, the sheer volume of data that remains to be analyzed is overwhelming, for instance even though the Aqua satellite is in free fall (out of fuel) it is still churning out data, currently it has produced 10 petabytes. I spent a couple of years pulling some data over Colorado from it, and it’s quite in depth.
Maybe the cure for global warming is all the smoke, aerosols and chemicals spewing into the atmosphere from all the burning oil refineries and storage tanks in Ukraine and Russia. /s….maybe.
How does the temperature rise through increased sunshine due to reductions in SO2 emissions over the last 50 years compare with that from the greenhouse effect from increased CO2 emissions? Has anyone researched this? (Silly question, of course).
That is a tough one, the general consensus is that a 1% reduction in sunlight is equivalent to a globally averaged surface forcing of -0.5 to -1.2 C (there are a few different models out there). One could only deduce that whatever cooling that occurred because of some perturbation of incoming visible and shortwave IR, would be worse without GHG’s.
I guess I didn’t ask quite the right question. I should have added “particulate matter and” before “SO2.” The two work together to produce toxic results from air pollution. Might it not be that they also work together to increase cloudiness or fogs?
I am a geophysicist, I have been dealing with huge volumes of time series / proxies for decades, dealing with horrifically complex papers associated with seismology / geophysics. To answer your question properly, CO2 is not part of the equation, it was a silly notion to begin with based on its radiative properties. SO2 is complex, because it is not SO2 that reflects, it is after it converts to sulfuric acid that it become highly reflective.
I’m not a geophysicist but I took a Geophysics class once in grad school. One of the hardest classes I had. (The fact that the professor was Iranian and had an accent that was hard to understand didn’t help.)
Oh I tell you in the early 90’s when 3D Seismic came out, and we had no software for it, and your boss would come in and throw some paper down and say we just lost a contract because we don’t have this, how long will it take to develop it, it was very difficult, and the version of the internet back then was not very social, but you could download math libraries and such from some of the universities.
Wish I had been able to do some of that stuff (then again, maybe not). My career took a different path. Not too bad, but not too exiting.
You probably made a good choice, turning calculus into code has been trivialized by AI. I first got interested in this AGW debate in the late 90’s on Yahoo Answers with the likes of Dana Nuccitelli arguing about the same chit that people are today. And not too long after that I saw the birth of http://www.wattsupwiththat.com with the first post of how not to measure temperature and I was hooked. Here we are almost 30 years later, billions spent on modeling, data and endless reams of worthless papers about climate models, and nothing is settled.
At the Mauna Loa Obs. in Hawaii, the concentration of CO2 in dry air is currently 429 ppmv. One cubic meter of this air has a mass of 1,290 grams and contains 0.84 grams of CO2. There is too little of this greenhouse gas in the atmosphere to cause any global warming as alleged by corrupt IPCC and the unscrupulous collaborating scientists.
The main process for warming of the air is quite simple: sunlight warms the earth’s surfaces. Air contacts the warm surfaces and heats up by conduction. The warm air rises and by convection heats up the atmosphere.
In some regions the air in nearby areas is heated by advection. A classic example of advection is the Santa Ana winds in California which in late summer and fall come out of the high desert and heat lower California.
For context and explanation, using
https://mynasadata.larc.nasa.gov/basic-page/earths-energy-budget
Heat loss, averaged over a decade or so, from the surface…down here where people live:
conduction/thermals are about 18, evaporation 86, radiation 58…
balancing the surface absorbed sunlight of 163, all Watts/sq.M
Note that of the radiated 58, 40 goes directly to outer space through the atmospheric window…This is somewhat obfuscated by the use of Plank radiative fluxes, 398-340, (instead of “net heat”in the orange part of the energy budget diagram, whereas the other numbers are “net”).
The change due to doubling CO2 is calculated to be 3 to 4 watts at TOA, which might be 6 watts down here at surface if present 1.6 Surface to TOA multiplier (the greenhouse effect) remains about the same ratio…
Whether that 6 watts is an insignificant 1.5% of the Plank 398 Watts, or a significant 10% part of the net 58 Watts…is the basis of much of the global warming issue.
Modtran points to 2xCO2 making about 1.2 degrees difference after integrating many CO2 absorption bands, many atmospheric layers…just sayin’…using clear sky, RH fixed, 400 then 800 ppm CO2
My personal feeling is that sunshine is stronger than in earlier times.
The physics certainly agree with you, there is more energy hitting the ground than at any time during our lives, well unless you were born in the 50’s or before.
1952
The problem we have now based on evidence, is that each time we get on an airplane we are participating in spreading a blanket of H2O around the globe at 40 thousand feet. The physics behind that are quite clear, and last year aviation generated over 120 billion gallons of water vapor because when you combust a hydrocarbon for every molecule of CO2 you produce you also produce an H2O molecule. The SO2 emissions being reduced will amplify this forcing, and you were born before this was a problem, I was born (1966) right at the beginning of it.
All the jet liners in the world at 40,000 feet put an insignificant amount of water vapor into the upper troposphere compared to rising afternoon thunderheads…
No, they do not, they are flying 10,000 feet or more above the convection, (cheating nature) they are in the Tropopause, it is very dry there. Last year aviation generated a minimum of 120 billion gallons alone. Well more than the Honga Tonga eruption, which we are still under the effects. To put 120 billion gallons into perspective, a small puffy cumulous cloud representing 1 cubic kilometer holds approximately 132,000 gallons of water.
1949
1943
didn’t seem much hotter or cooler than the 50’s, and I clearly recall the coming glacier scare, and seems an accompanying theory was that less sea ice pomoted more snow over North America, helping to create those older glaciers…
Gums sends…
WWII was where we saw the first evidence of what venting large amounts of H2O high above the weather, and even in the Stratosphere over the English Channel, we also see the dwell time of aviation exhaust is fairly short, because the interlude of warming between the Korean war, which also put significant amounts, albeit less than WWII. Global aviation took off in the 60’s but you could only see it between Nixons bombing missions, the 52’s hold the prize for particulates. After the air cleared from the smoke trails between Guam and Vietnam, Earths climate leaped to its new radiative master, and a linear warming trend started maintained by an exponential forcing.
Zoomed out with the civil aviation exhaust model, still working on the military contributions to high altitude aviation exhaust. But once upon a time the climate ebbed and flowed with solar output and then humanity started continuously spreading a layer of water vapor around the world at 40,000 feet or higher, and it gets larger almost every year and it never stops. But the pandemic no fly cut aviation in half and temps plummeted and caused a 3-year La-Nina.
If you click on the image, it will expand to full screen and become clear. Click on the “X” in the circle to contract the image and return to Comments.
OMG thank you Harold.
What would the poor hapless visitors to this site do without you?
You have freed us from ignorance.
That’s a big call, Charles 🙂
I post this comment for the benefit of new commers to WUWT. Everyday I see commenter who are new to WUWT and whose are screen names are new to me. I just try to be helpful and friendly for everyone in the WUWT community.
Thank God you’re here to explain how to use browsers and the Internet for our audience. And all for no pay. Maybe we should petition the Vatican for you to get canonized. You’re tech support brilliance is unmatched. I can’t believe OpenAI, Anthropic, or even SpaceXAI hasn’t snapped you up for a board seat.
Canonised, you want to shoot him out of a canon?
Next you’ll want to beautify him!
I knew I should have looked up usage at the time I was writing it. This is the helpful correction/information that is appreciated.
Canonized is usually applied to the process of declaring a deceased person a Saint, presumably Harold is still alive. Beatify is the first step in the process, terming the person ‘blessed’. If you wanted to shoot something it would be with a ‘cannon’ not a ‘canon’. Despite his name, Eng_Ian appears to have some problems with the English language.
I appreciate that Harold, as I did the last time.
The elliptical orbit = +/- 41 W/m^2.
The 100 W/m^2 30% albedo uncertainty = 11 W/m^2.
The tilted axis summer to winter = 700 W/m^2.
Together these decide the climate.
1750 to 2011 2 W/m^2 runs nada.
Annual income twenty pounds, annual expenditure nineteen pounds nineteen and six, result happiness. Annual income twenty pounds, annual expenditure twenty pounds nought and six, result misery
Wilkinson Micawber
Same is true for Earth.
And let us not forget the incoming cosmic rays, and their effect on cloud formation. Yes, I undertsand that is still under investigation, but there is some evidence..
Guess what the models don’t actually model? Clouds (and plenty more, besides)
Cloud properties and their projected changes in CMIP models with low to high climate sensitivity
a realistic representation of clouds remains challenging.
Projected changes in the cloud properties in future scenario simulations are analyzed by the ECS group.
…
In order to investigate the sensitivity of cloud parameters simulated by the three ECS groups to future warming, we compare the changes in selected cloud properties and cloud radiative effects in future simulations from each group.
There isn’t a cat in hell’s chance that the alarmo-establishment is going to give up demonising Carbon dioxide. The Met Office told me so. The money involved is more than eye watering.
I wonder what the woke-world response would be if other groups of minority trace gases started to “identify” as CO2?
Their claims could hardly be “denied” now, could they?
The currency in the term “denier” would tank.
It has never been about climate, environment or weather. Has always been about money and control.
Correct. If evidence mattered there wouldn’t be a problem. It’s really all about the politics. That is where the madness must be faced and defeated.
Wonderful!
When the story-telling gets rough, the smart ones rely on a(n) Historian to handle the writing.
If we accept the premise of this paper—that cloud contraction and albedo act as a massive, independent physical driver of warming—it completely upends the math of standard attribution models.
Attribution models are essentially zero-sum games played beneath a fixed ceiling. Look at how these components are actually stacked:
[The top orange line is the physical reality: the actual observed temperature delta measured by thermometers. Because that ceiling is fixed, the space beneath it is a zero-sum squeeze.If we apply Bellocchi et al.’s findings, the “Total independent physical impact” (the green bar) has to expand significantly to account for the massive influx of absorbed solar radiation from shrinking cloud cover. But here is the mechanical friction point: you can’t just expand the green bar for 2026. The continuous satellite record for global cloud albedo started around 1979/1980.
If you expand that green independent variable across every decade going back to 1980, the “Total CO2 impact” (the blue bar) must shrink proportionately to keep the sum equal to the observed temperature delta.
You can’t have both. If albedo governance takes up more of the zero-sum space under the temperature ceiling over the last four decades, the historical climate sensitivity to CO₂ is mathematically forced to be much lower than the institutional models have claimed.
Interesting study. The cult demands we get rid of aerosols from coal and nitric acid from cars, ie smog, and the reduction than heats the ground since the cloud cover is less
The sun per other studies warmed up a bit starting about 150 years ago but that heating was simply reflected into space by clouds until humans reduced their output of cloud producing material if this study is correct. The hole in this study is the total dependence on satellite data from a tiny slice of time when warm and cold periods of long duration are known from other studies. The last ice age , for example, was unlikely caused by some huge cloud cover that lasted for 103,000 years. The theory it was caused only by shifts in earth’s orbit simply ignores changes in the sun’s output which have been shown to exist. Currently the sun has been more active than it was 300 years ago as shown in a number of different studies. The assumption the sun is steady state is simply an assumption generated most likely by the limitation of a human lifetime to observe changes.
Very interesting! However, I suspect that the decline in SO2 (aerosol-generating) emissions has something to do with it:
Source: https://doi.org/10.5194/essd-12-3413-2020
This appears to be a slightly updated version (with a couple of additional years), with attribution by region instead of by sector:
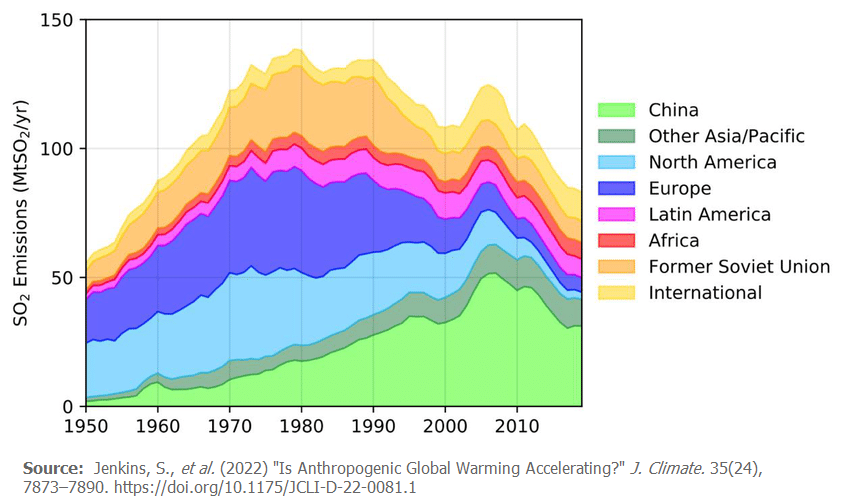
Source: https://doi.org/10.1175/JCLI-D-22-0081.1
At least we all agree it’s not the CO2’s fault
CO2 also has a warming effect. It is modest and benign, but it isn’t zero.
According to that plot, SO2 emissions now are similar to what they were in 1960. But temperatures are warmer. So, what changed?
https://sealevel.info/co2_and_ch4.html
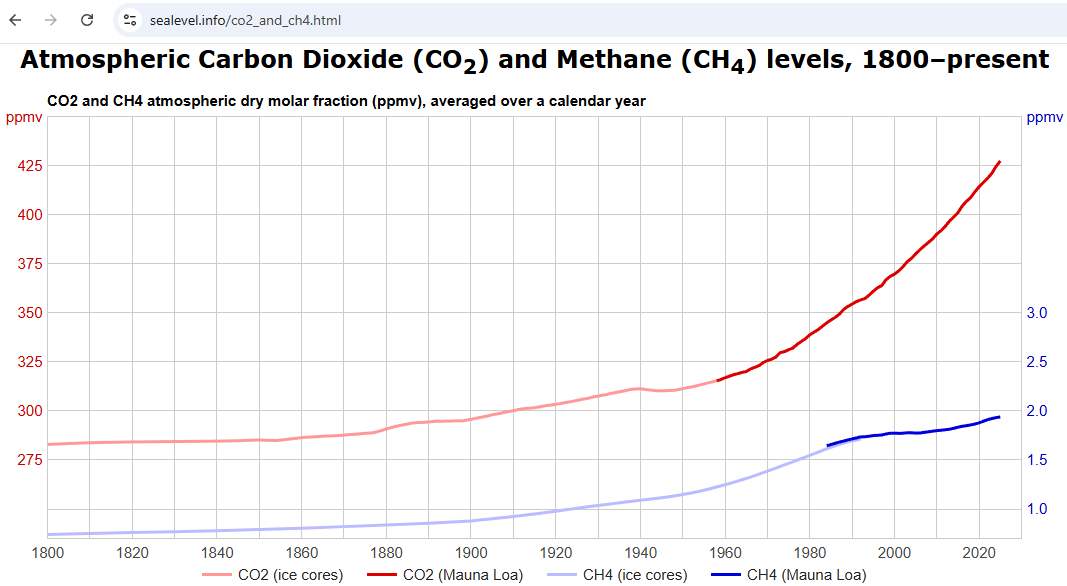
Agree that CO2 has a minor affect. According to Happer a doubling of CO2 equals about a 1 deg of warming. However, CFCs increased and then decreased after the Montreal Protocol. They could have added warming as they interact with different wavelengths to CO2. Then they were reduced. There are papers that look at this but I dont have the links right now. I would argue that reduced cloudiness resulted in a slight sea surface warming and subsequent release of CO2. The palaeo record always has temperature change preceding CO2 change, at least for the last million years where we have reliable ice core data.
From AI search :”Carbon dioxide (\(CO_{2}\)) absorbs infrared radiation strongly at 15 micrometers (bending mode) and 4.26 (asymmetric stretch). In contrast, chlorofluorocarbons (CFCs) absorb strongly in the 8 to 12 range—specifically via C-F and C-Cl stretching vibrations—right inside Earth’s atmospheric “window” where \(CO_{2}\) and water vapor are mostly transparent. [1, 2, 3, 4]”
It’a defined as the Earth’s atmospheric ‘window’ because it doesn’t include the main CO2 absorption band!
What changed indeed, since the 1960’s we have been spreading a layer of water vapor around the world at around 40,000 feet. It happens every second and has been building on an exponential rate almost each year mirroring the global population. It’s an easy fix for me, I don’t need to fly, could the world live with capping upper atmospheric water vapor emissions?
Michael / Dave,
You’ve both hit on the exact mechanical blind spot in modern climate attribution, and Dave’s CEDS/sulfur data points straight to the smoking gun.
The reason mainstream models struggle with paleoclimate baselines (like the ice age shifts Michael rightly brings up) is that establishment climatology treats the industrial era as if it were operating on a clean, single-variable greenhouse dial. It isn’t.
What we lived through from 1850 to 2000 was a dual-engine industrial experiment: we were simultaneously pumping longwave-active CO2 into the atmosphere while flooding the troposphere with a massive, shortwave-reflecting sulfur canopy.
Because atmospheric co2 operates on a logarithmic curve of diminishing returns—meaning its primary absorption bands were already ~80% saturated by 1990 and are pushing ~90% today—additional cO2 yields progressively smaller climatic returns. When Western nations and global shipping regulations (like the IMO 2020 rules Dave references) stripped out the sulfur shield, the planet didn’t experience a runaway co2 ignition; it experienced a brake release.
The steep post-1970 warming spike wasn’t a sudden surge in carbon potency—it was the unmasking of decades of suppressed, latent heat combined with short-wave cloud albedo changes. Until mainstream models separate the greenhouse baseline from the aerosol masking cycle, they’ll keep misattributing the unmasking of industrial pollution to runaway greenhouse gas sensitivity.
Let me put your mind at ease. Climate changes, constantly. Humans are not causing it to change, nothing humans can do will stop it from changing. That it changes is irrelevant, adapting to the changes is all that matters. Gas, coal, oil, hydro and nuclear are the best and most reliable sources of energy to allow humans to adapt to the ever changing climate.
There, feel better now? Good. Go forth and do something useful, because worrying about the weather ain’t it.
FYI, the concentration of CO2 for the saturation of the absorption of IR light is 300 ppmv which occurred in 1920. One cubic meter of air at STP contains a mere O.84 grams of CO2. This small amount of CO2 can only absorb a very small amount of IR light. In winter CO2 hibernates.
Here’s the Earth’s radiance spectrum, see that big notch around 15 microns, that’s the absorbance by CO2, not “a very small amount”!
Putting China at the base of the stack influences the overall shape. The change, or variance should be used as the guide as to where to place a country. Those with the least change should go on the bottom.
Wow. What a waste of a vast amount of capital and man-hours. Any farmer could have explained “clouds/cooler, no clouds/warmer, because Sun”. Someone put that into mathematical equation form and slap it on t shirts, you’ll make a fortune.
More like “Clouds=less temp variation”. No clouds = warm in the daytime, cool at night.
Once again you are over thinking a good line. 😉
Yeah… It reminds me of a saying that I can’t really find an attribution for that: “What is interesting here isn’t new and what is new isn’t interesting.”
But, that said, there is other work out there that actually does a better job at arguing for clouds/temperature and some causal mechanism with one of them being Svensmark’s Cloud Theory.
The point is there is NO REASON to do any of this, beyond curiosity. Climate changes, no reason to obsess about it because there is nothing to be done about it, other than to adapt as humans have been doing for millennia untold.
You don’t even need to be a farmer. Any idiot can feel the difference when on a sunny day the sun slips behind a cloud.
It seems like there’s always a lot more atmospheric high pressure on hemispheric blocking maps. Has it always been that way? Also, I asked Gemini if the Hadley cells have shifted northward (boreal hemisphere) in recent years, and it said “yes”.
SO2 amounts do not explain the cyclical nature of the climate after the Little Ice Age ended.
On three separate occasions the temperatures increased at the same magnitude: From the end of the Little Ice Age to the 1880’s, then temperatures cooled for about three decades, then around 1910 the temperatures started to increase again, and increased at the same magnitude through the 1930’s, then the temperatures cooled again through the 1970’s, and then the temperatures increased again, at the same magnitude as before, culminating in the present day which is no warmer than it was in the 1880’s, or the 1930’s. There has been no net increase in temperatures since the 1880’s.
SO2 concentrations do not explain such cyclical movements.
Bogus Hockey Stick charts do not show such movements. That’s why they are bogus.
The written, regional temperature records DO show such movements.
There was a large growth in atmospheric SO2 starting around 1850-1900 at the beginning of the industrial revolution.. (as measured by GISP)
This coincided with a warming period.
Now we are told that getting rid of SO2 from the atmosphere causes warming.
Something doesn’t add up !
We can also look at SO2 measurements over the USA
(ppb numbers are estimates from the chart above, amounts are from data from someone else, I can’t remember who).
SO2 dropped from 174ppb in 1980 to 89ppb in 1998, (a decrease of about 14.7 million tons)
UAH USA48 shows no warming or cooling over that period.
.
SO2 dropped from 79ppb in 2005 to 24ppb in 2015.. (a decrease of about 8.1 million tons)
According to USCRN and UAH USA48 there was no warming or cooling over that period..
The SO2 cooling conjecture is not supported by measured evidence over the USA.
I have never really looked at the big picture on SO2, I was too focused on this century, but when I zoom out and look at the SO2 forcing curve, the trends kind of match with SST. I put the year of the US record high in the 30’s. which is past the peak of the SO2 depression related slowdown of emissions, but you can see that the reductions of emissions caused a warming bump, that could have played some part in the dustbowl.
What I find odd in this headline is that this isn’t a new concept in the AGW space and that Svensmark’s Cloud Theory involving the strength of the earth’s magnetosphere and the Sun’s heliosphere and the resultant strength of the cosmic rays reaching the correct place in our atmosphere to seed cloud formation isn’t even mentioned in this article.
Although I think Svensmark’s theory is closer to the truth than a lot other theories (and it has a fairly simple temperature regulation mechanism), it’s not that they aren’t building on Svensmark’s work, it’s that they don’t even seem to know that there has been work done before and that they present their basic thesis of cloud cover and temperature changes as a novel discovery.
Just search for “Svensmark’s Cloud Theory” and it should become obvious that his work precedes the ‘findings’ presented in this article.
First the spelling mistake was a distraction, then the “off the cuff” attribution annoyed.
Author please consult the older Svensmark work and Zharkova solar magnetic field later work.
“…Svensmark’s theory is closer to the truth than a lot other theories…”
How is that? Every skeptic ought to know why his cosmic ray cloud theory is falsified.
According to his theory, climate cooling clouds are supposed to increase from more cosmic rays.
Clearly this is false as there were fewer clouds while cosmic rays were higher since 2000.
Furthermore, the climate warmed since 2000, so obviously it did not cool from higher cosmic rays.
At the climate+clouds button of climate4you.com, you can see that the Earth’s cloud cover has been declining for decades. Some prominent climate “scientists” proclaimed a few years ago that this data must be wrong yet still it is there, still declining. That is how the climate consensus deals with contrary information.
The effect of cloud cover on temperature is obvious every day, as you walk around outside.
The effect of CO2 on temperature is contradicted by the temperature reconstructions.
Another article where the ‘CO2 control knob’ commenters have nothing to contribute. Highly amusing.