UPDATE: Live The last radar image from Willis Island added below. The last radar image is truly striking.
Also, see below for the differences between the Australia hurricane scale and the familiar Saffir-Simpson scale used in the USA. They are not equal.
From Australia’s BoM, time to “get outta Dodge” as they say:

Simon at Australian Climate Madness notes this for rebuttal of the inevitable “Yasi caused by global warming” links that will be pushed on the blogs and by the press:
Tropical cyclone Mahina hit on 4 March 1899. It was a Category 5 cyclone, the most powerful of the tropical cyclone severity categories. In addition, Mahina was perhaps one of the most intense cyclones ever observed in the Southern Hemisphere and almost certainly the most intense cyclone ever observed off the East Coast of Australia in living memory. Mahina was named by Government Meteorologist for Queensland Clement Wragge, a pioneer of naming such storms.
Here’s what BoM has to say on their tracking page:
The forecast path shown above is the Bureau’s best estimate of the cyclone’s future movement and intensity. There is always some uncertainty associated with tropical cyclone forecasting and the grey zone indicates the range of likely tracks of the cyclone centre.
Due to the uncertainty in the future movement, the indicated winds will almost certainly extend to regions outside the rings on this map. The extent of the warning and watch zones reflects this.
This product is designed for land-based communities; mariners should read the coastal waters and high seas warnings.
Remarks:
SEVERE TC YASI IS A LARGE AND VERY POWERFUL TROPICAL CYCLONE AND POSES AN EXTREMELY SERIOUS THREAT TO LIFE AND PROPERTY WITHIN THE WARNING AREA, ESPECIALLY BETWEEN CAIRNS AND TOWNSVILLE.
THIS IMPACT IS LIKELY TO BE MORE LIFE THREATENING THAN ANY EXPERIENCED DURING RECENT GENERATIONS.
TC Yasi, CATEGORY 5, will continue to move in a west-southwesterly direction during the day. The cyclone is expected to cross the coast in the Innisfail area at about midnight.
Coastal residents within the warning area, and particularly between Cairns and Ayr are specifically warned of an EXTREMELY DANGEROUS SEA LEVEL RISE [i.e. storm tide] as the cyclone approaches, crosses the coast and moves inland. The sea is likely to steadily rise up to a level which will be VERY DANGEROUSLY above the normal tide, with EXTREMELY DAMAGING WAVES, STRONG CURRENTS and FLOODING of low-lying areas extending some way inland. People living in areas likely to be affected by this flooding should take measures to protect their property as much as possible, and be prepared to follow instructions regarding evacuation of the area if advised to do so by authorities.
DAMAGING WINDS with gusts to 90 km/hr that are currently developing on coastal islands, are forecast to develop about the coast by late morning and about the tropical interior overnight.
Between Cape Tribulation and Ingham these winds will become DESTRUCTIVE with gusts in excess of 125km/hr during the afternoon and early evening and VERY DESTRUCTIVE with gusts up to 300 km/hr between Cairns and Ingham during the evening as the cyclone approaches and crosses the coast. These VERY DESTRUCTIVE winds can also occur on the seaward side of hills to the north of the cyclone and are also forecast to reach the Atherton Tablelands.
Winds are forecast to ease about the east coast during Thursday morning as the cyclone moves inland.
FLOODING RAINS will develop from Cooktown to Sarina during the afternoon and then extend inland overnight.
People between Cape Melville and Sarina, extending inland to Croydon and Richmond should complete preparations quickly and be prepared to shelter in a safe place.
– Boats and outside property should be secured.
– For cyclone preparedness and safety advice, visit Queensland’s Disaster Management Services website (www.disaster.qld.gov.au)
– For emergency assistance call the Queensland State Emergency Service (SES) on 132 500 (for assistance with storm damage, rising flood water, fallen trees on buildings or roof damage).
People about the remaining tropical interior east of Camooweal and north of Winton should consider what action they will need to take if the cyclone threat increases.
– Information is available from your local government
– For cyclone preparedness and safety advice, visit Queensland’s Disaster Management Services website (www.disaster.qld.gov.au)
– For emergency assistance call the Queensland State Emergency Service (SES) on 132 500 (for assistance with storm damage, rising flood water, fallen trees on buildings or roof damage).
Name: Severe Tropical Cyclone Yasi
Details:
| Time (EST) | Intensity Category | Latitude
(decimal deg.) |
Longitude
(decimal deg.) |
Estimated Position
Accuracy (km) |
|
|---|---|---|---|---|---|
| 0hr | 7 am February 2 | 5 | 16.1S | 150.9E | 20 |
| +6hr | 1 pm February 2 | 5 | 16.7S | 149.1E | 45 |
| +12hr | 7 pm February 2 | 5 | 17.2S | 147.5E | 75 |
| +18hr | 1 am February 3 | 4 | 17.8S | 145.8E | 100 |
| +24hr | 7 am February 3 | 2 | 18.5S | 144.1E | 130 |
| +36hr | 7 pm February 3 | 1 | 19.8S | 141.1E | 190 |
| +48hr | 7 am February 4 | tropical low | 20.9S | 138.4E | 250 |
The next Forecast Track Map will be issued by 11:00 am EST Wednesday
===============================================================
UPDATE:
Commenter sHx writes:
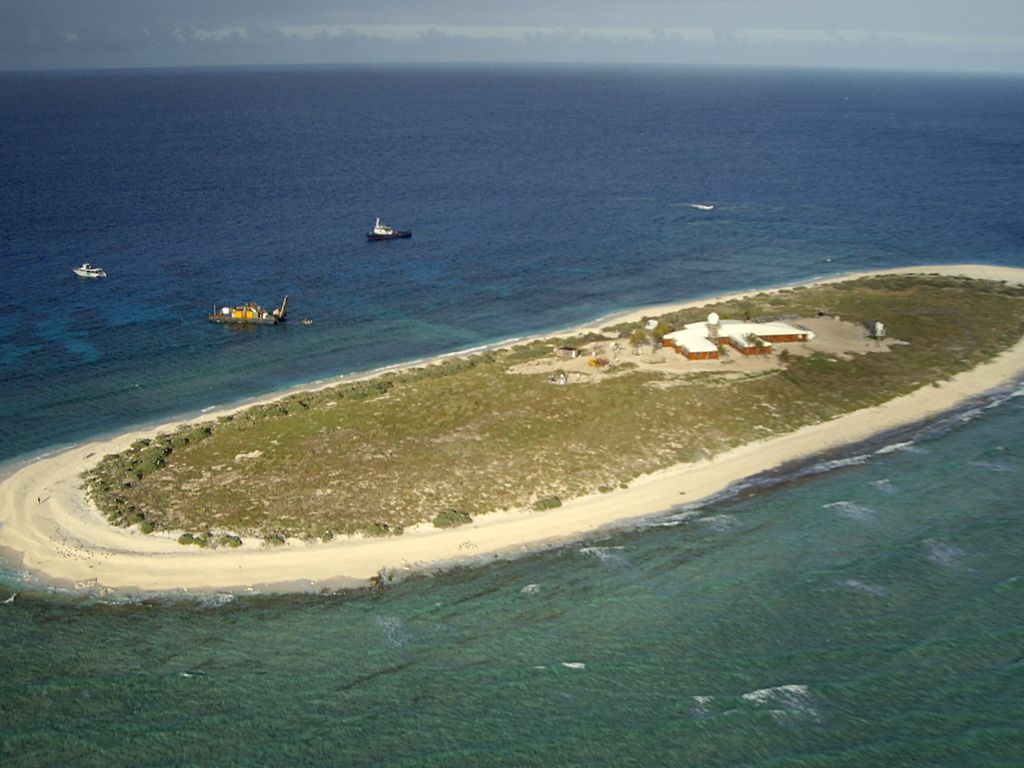
AS of this moment Yasi is right on top of Willis Island. http://en.wikipedia.org/wiki/Willis_Island
Apparently the island has a meteorological post. It even has radar! http://www.bom.gov.au/products/IDR412.loop.shtml

It must be frightening to be that radar operator looking at this, knowing when that eyewall hits you are going to be subject to Cat5 winds and you have a 30meter tall radar tower right next to you, and there’s really no shelter elsewhere on the island and no place to go. I wonder how long we’ll continue to get a signal from the Willis Island’s radar?
UPDATE2: Just about the time I pressed “update” the radar went out, the radar station is offline. The last image from the station is above. We hope for the best for the BoM employees there. The storm surge must be ferocious. Hopefully BoM evacuated them and they left the radar on “auto”. Given the size and composition of the island versus the size of the hurricane, Willis Island may very well be erased by this storm.
===============================================================
Good luck to our friends in Queensland, especially Dr. Bob Carter and Nigel, who helped during my tour in Townsville last year.
===============================================================
UPDATE 3: Hurricane expert Dr. Ryan Maue brings to our attention the differences in tropical cyclone scales. The Saffir-Simpson scale used maximum sustained one-minute winds while the Australian Region scale uses ten-minute averaged sustained winds. The convention to convert is (10-minute)*1.14 = 1-minute sustained (units are knots). This image combined from Wikipedia’s article.

The JTWC advisory intensity at 00Z Feb 2 of 125 knots is a strong Category 4 on the Saffir-Simpson scale. The Australian Bureau of Meteorology reports central pressure of 930 hPa, and backs out Category 5 winds from that. Also, feel free to call Yasi a “willy-willy“.
LMAO We have channel 7 news team talking to ocean going cargo ships asking them “What is it like riding through this storm?”.
Their reply…
“Ah yeah, I see this all the time in heavey seas…” (Or there abouts).
You can just tell from the tone of the pilot/captain that he is wondering why he’s being contacted about this.
“izen says:
February 2, 2011 at 4:59 am”
This would be true if the globe was actually warming (At a rate anythnig other than “normal”), which it doesn’t seem to be, unless or course, you are looking at computer model output or “adjusted” temperature data.
Alarmist BBC is reporting this storm as
“most dangerous storm ever predicted ”
Just what does that mean./
Alarmist BBC is reporting this storm as
“most dangerous storm ever predicted ”
Just what does that mean?
“Ross Brisbane says:
February 2, 2011 at 12:32 am”
Ross, “he” seems to be on perpetual holiday, when natural events occur. Have you seen “The Life of Brian”?
Presenters on ABC NEWS 24 Australia talking to Jonhathan Nott, biased questions trying to extrat confirmation this storm is caused by AGW. Nott says its not proof of AGW, but this is what we expect. Australia certainly is leveraging the Qld floods and wind to support a “price on carbon” in the fight on “climate change”.
ozspeaksup says:
February 2, 2011 at 4:00 am
R Brisbane…hes a serial pest on any sites that express any agw disbelief.
figures he’d show here sooner or later:-(
We do seem to be feeding a troll with a rating of category 5 on the hysteria scale. Pushing the AGW religion at a time when so many lives and livelyhoods may be in mortal danger is a scandalous way to act IMHO.
But then, what do you expect from misanthropes?
Alarmist computer models (GIGO! GIGO!!!!11) have been used to terrify the public of Queensland into irrational and economically costly action.
We must put a stop to these climate scientist lies and their attempt to enforce socialist ‘evacuation orders’ on freedom loving Australians.
Oh the reporting of this storm is shameful on Australian ABC News 24, shameful!!!
I think that I am about to really lose it. This nonsense has to stop. This is the BBC lead now
“Fierce winds and driving rains brought by the most powerful storm ever to hit Queensland are lashing northern coastal areas of the Australian state.’
http://www.bbc.co.uk/news/world-asia-pacific-12342031
Do they really think that we are that stupid. Do they care. Do they know how stupid they are.
Look any hurricane is tough but people live with them, know the score and above has been listed some terrible outcomes of truly massive storms in the past.
Sorry but they have crossed a line with me.
Ross, dont equate prudent advice re building in flood plains with either intelligence or globull warming. Its neither, nor is it rocket science. But it seems that Common Sense is becoming rocket science.
Since TC Tracy wiped out Darwin in the 1970’s, buildings in the cyclonic region, which is a coastal band running along the northern coast from just North of Brisbane in the East around to about Carnarvon in the West (IIRC), have had to be up to a standard to withstand winds of up to 60 m/s (216 km/h or 135mph) in the “worst” topography. Let’s hope that the builders have only “cyclonic” and “non-cyclonic” designs in their repertoire.
Engineered, non-residential structures, which are designed for greater wind load, should survive except in the very worst areas and where they are struck by flying debris. The latter is the greates risk in a cyclone, with properly designed and built structures. Envelope penetration allows the wind to enter; with a pressure difference in excess of 3kPa; which doesn’t sound like much, but applied over the surface of a building, it’s a huge force that will lead to an “explosion” of ceilings, walls and roof.
Design wind speeds are codified in AS1170-X and AS4055-X … where X is some revision with which I’m not completely familiar.
Keep in mind that there are safety factors in designed structures. A structure that’s designed (and constructed) to withstand winds of 60 m/s won’t disintegrate at 60.1 m/s. Chances are that it’ll take 65 m/s winds and a pretty good chance that it’ll survive 70 m/swith only cosmetic damage. It depends where materials are on the strength distribution curve of the critical structural elements.
I have a question for Mr Brisbane.
Mr Brisbane, would you carefully and thoroughly describe what constitutes an “extreme weather event”?
Considering we have cyclone/hurricane scales, to me the definition of extreme would be something exceeding those scales, or at least consistently pegging to the top of them.
A category 1-3 hurricane, to my mind, is not extreme since the earth is quite capable of making them. A category F1-F3 tornado/waterspout, to my mind, are not extreme since they are fairly common particularly in the central US plains. If you believe these are extreme events, then your example of CAGW being exemplified by extreme weather events is meaningless since these are fairly common weather events.
I’m sick and tired of commonplace weather being called “Extreme” and used as an example of that which doesn’t exist.
Ross Brisbane,
There is an article on Joanne Nova’s site you should read . Note: I completely agree with Jo, “As usual, it’s the name-callers who cling to 100 year time-frames and deny the long term evidence, while we cherry-picking denialists gravitate towards long term studies based on real observations.”
Yasi is a monster — but not an unusual one
http://joannenova.com.au/
Ross Brisbane says:
“Is this beginning of what’s normal cycles and events?”
No, Ross. This is a continuation of the exact same kind of weather events that have happened repeatedly in the past. If anything, weather events were more numeous and severe when CO2 was lower. Quit scaring yourself. It’s only natural variability in action.
Grey Lensman says:
February 2, 2011 at 8:28 am
I think that I am about to really lose it. This nonsense has to stop. This is the BBC lead now
“Fierce winds and driving rains brought by the most powerful storm ever to hit Queensland are lashing northern coastal areas of the Australian state.’
————————————————–
The most powerful storms ever … yada, yada – cheer up Grey Lensman. No record breaking storms where I live. Or where most Australians live.
One of the main reasons my (Dutch) parents came here was to get away from the awful weather. I am gobsmacked by those ‘surveys’ that announce that the best place to live in the world is somewhere in Scandinavia.
No offence to WUWT readers in colder climes, apologies for any wounded feelings. But, if global warming (over and above what we might expect) is happening, and it is so bad, how come people who have a choice usually migrate to somewhere warmer?
Looking at the weather stations that report frequently in the Townsville area it looks like Yasi came ashore as a Aus cat 3 cyclone. No gusts recorded over 100kts, no steady winds over 75kts and very varied rainfall rates (eg Woolshed 40mm/hr, Townsville 15mm/hr). Minimum central pressure 977mb – well up on the 940mb recorded at Willis Island.
It could well be, of course that it was worse somehwere without an automatic weatherstation.
Good news: early reports are that the damage from Yasi is generally modest, except in one or two small towns such as Tully. While there has been widespread loss of power through transmission towers coming down, etc, live video from Cairns and Innisfail shows lights on, minimal wind damage, little or no storm surge flood damage. No reports of death or major injury. Still heavy rain over a wide area, which is likely to lead to some flooding given that the ground is saturated from earlier rain.
Whilst Yasi was a strong storm it is farm from unprecedented in QLD’s history. I can think of several storms which have already been mentioned in this thread.
The Bathurst Bay storm of 1899 which generated the highest storm surge ever recorded and the 1918 Mackay cyclone which recorded a central pressure of 932mb but probably had a lower reading as this was the lower measuring limit for the barometer. In the same year Innisfail had a cyclone that had an estimated central pressure of 910mb.
So TC Yasi whilst very strong was certainly not unprecedented.
I picked up this article in The Oz yesterday from Jo Nova’s site and have posted it on a couple of blogs today
http://www.theaustralian.com.au/news/features/queenslands-cycles-of-havoc/story-e6frg6z6-1225998344719
Jonathan Nott is an expert on the incidence of super cyclones. By analysing ridges of broken coral pushed ashore by storm surges, he has catalogued the incidence of super-cyclones over the past 5000 years.
In a paper published in the scientific journal, Nature in 2001 his research shows the frequency of super-cyclones is an order of magnitude higher than previously thought.
Nott’s work puts into perspective current debate about whether climate change is responsible for the extreme weather events in Queensland.
…
What the longer term records show, however, is that the frequency of extreme cyclones follow a predictable long-scale pattern.
“What the record shows is we go through extended periods, hundreds of years, of high activity and extended periods of little activity,” Nott says.
“The past 100 to 150 years has been very quiet in Queensland in terms of what happened in the past. The couple of hundred years prior to that were very active.”
…
here’s the abstract of the paper by Prof Nott to which the Oz article refers
http://www.nature.com/nature/journal/v413/n6855/abs/413508a0.html
Understanding long-term variability in the occurrence of tropical cyclones that are of extreme intensity is important for determining their role in ecological disturbances1, 2, 3, 4, 5, for predicting present and future community vulnerability and economic loss6 and for assessing whether changes in the variability of such cyclones are induced by climate change7. Our ability to accurately make these assessments has been limited by the short (less than 100 years) instrumented record of cyclone intensity. Here we determine the intensity of prehistoric tropical cyclones over the past 5,000 years from ridges of detrital coral and shell deposited above highest tide and terraces that have been eroded into coarse-grained alluvial fan deposits. These features occur along 1,500 km of the Great Barrier Reef and also the Gulf of Carpentaria, Australia. We infer that the deposits were formed by storms with recurrence intervals of two to three centuries8, 9, 10, 11, and we show that the cyclones responsible must have been of extreme intensity (central pressures less than 920 hPa). Our estimate of the frequency of such ‘super-cyclones’ is an order of magnitude higher than that previously estimated (which was once every several millennia12, 13, 14), and is sufficiently high to suggest that the character of rainforests and coral reef communities were probably shaped by these events.
you have to log in to see the paper in total
To All
To the next and next events. The computer models are forward estimates of collateral damage to our climate. I am looking for correctness and for them to have some semblance of reality as when coupled to precedents of specific events. It is to the now present global warming we are seeing many bodies of empirical data emerge. Some of its track record has been fairly consistent with a globally warming world.
It’s best that we all prepare and some how whether you are skeptic/sceptic or understand better the rudimentary laws of physics. This globe we share will get much much warmer not cooler.
Dr Roy Spencer for example is a MAGW (mildest) and would disagree with total denial of the rudimentary laws of physics within the context of radiative forcing. So he is at odds with many here on this forum. It is little wonder to cherry pick his data but then that is your right to do that. I hold this fellow in very high esteem and I am a avid reader of his articles on his web site.
Of course I tend not to agree with him on a few issues. That being his radiative sensitivity theory. So is Plimer/Monckton/Carter/Lindzen etc.
My understanding and its been a long road of some three years of study/understanding of the historical and the present trends. A +1 Celsius shift in global temperature can have a profound effect on our chaotic climate when factored in.
All that has to happen within 10 short years is a shift to the increase of temperatures beyond .5 Celsius and Spencer’s theory in cloud balancing acts is falsified. That is a fact. BTW Lindzen and Spencer are at odds even here as to the specifics of there MAGW theories – that is the minimal effect of radiative forcing as consequence of CO2 upon climate as a free state acting greenhouse effect. That leads to various climate sensitivity hypothesis.
If we shift to 1.5 Celsius rise in temperatures then models predict Super Cyclones by 2050 perhaps exceeding CAT 5 levels.
There seems to be some fascination with past records. Everyone is looking for that record breaker. This is wrong thinking.
All I have done here is to assert that computer modelling is based on two sources – PAST climate and the way it behaves and future projections as it is projected to behave in a global warmer context.
I could go on and on but sadly there are some here who are taking what I am saying badly out of context.
Now as to other things like snow like some are experiencing – don’t cheer when you see that stuff because in the final analysis USA is less then 5% of entire globe when it comes to land surface and global readings of climate. How less then 5% of a land mass can judge accurately the world’s real climate by looking out there window or putting the best warm coat on and gloves is beyond me. Don’t come to me yelling our “world” is cooling cause it’s not.
Try sitting here in soaring heat of 100 degrees and air like pea soup. Try remembering that north of Australia in the Coral sea are oceans recording warm temperatures breaking all records. Try 110 degrees in Sydney.
I get accused of many things – but myopic vision is not one of them.
Ross Brisbane,
Please provide us with testable, real world evidence showing that the rise in CO2 has harmed the planet. Make sure you are able to attribute any putative global “damage” specifically to CO2, as the alarmist crowd tends to assign every natural event to “carbon.”
The scientific method is completely ignored by the alarmists, but we here kinda like it, because it separates the wheat from the chaff; truth from baseless conjecture.
Take your time, I understand that you may have to check back with the realclimate and skepticalscience echo chambers.☺
Smokey
First: The term alarmist is derogatory for starters.
Second: I have never said here you are a denier. I have said quite clearly here that some DENY the physical laws known to exist in the gas CO2 and how it is a weak collector of the suns radiation and holds more in that would normally escape to space at night.
Third: The rest of the amplification is down to water vapor driving real climate.
Fourth: It is not my place here to drive home the science of AGW fundamental laws of physics and radiative forcing. Go to someone like Spencer for that.
Fifth: When a person reads the data he/she sees a warming world. I do not imply all this data is wrong or contrived. Do you? Mistakes yes but not contrived so to be in the domain of fraudulence.
Sixth: When we see an event like a return of large intense Cyclones/Hurricanes we are looking for anomalies consistent with a warmer globe. There size, development and what drivers within the standard climate are either below standard or above standard deviations.
You see Smokey at the end of day – we do get La Nina’s for sure but smaller ones. At present the oceanic currents are churning like a washing tub. Record La Nina = record heat/cold exchange rates are happening in our oceans – THIS IS NOT COOLING. It is our global oceans sequestering the heat build up in the first 70 meter layer in the oceans. Much like a heat pump in a reverse cycle air conditioner. Climate is only on move when extra energy is being placed into the system through some mechanism.
That mechanism is CO2 – much like the ripple effect of a stone disturbing a pond. We have all seen the movie the “Butterfly Effect”. Very slowly the earth is moving through phases of warming. Within those stages there will be sign posts along the way indicative of a world physically warming.
I fear along the way desensitization may set into the thinking of some. In other words we get so used to these events we think they are the normal.
There is of course a fascination with paleoclimate. All this is going to show over greater time frames in the context of warmer globe a far more active climate. It is NOT predicated on record beaters. It is based on attempts to reconstruct climate as it existed in a warmer context. It supports the theory that we may be headed into DAGW time frames for the earth over the next hundred years.
These studies are used in computer modelling. They help us understand climate trends in a warming globe context.
Smokey it is not my place to under cut Mr Watts web site.
Knowing I am at odds with him over many issues I would direct you to Spencer’s web site for a better understanding of the radiative forcing of CO2 in its basic science.
Ross, that is what’s known as a cop out. I simply asked for an example of global damage caused by the rise in CO2. Either you can provide verifiable evidence or you can’t.
Smokey,
I can answer your objection but on terms of what caused the warming.
1. A known mechanism on earth is warming the globe. This is not in dispute.
2. Warming after many empirical science studies has separated NATURAL variability from the base extra energy stored in the climate system. Radiative laws of physics in regards CO2 give an available quantum.
3. Extra energy is being held daily from the sun through this mechanism.
4. The globe is getting warmer.
5. In a warming globe we should see greater weather anomalies as such we are having. floods/droughts/heat waves/Strange hemisphere solace wind currents. That is in a high energy climate state things will be on the move dynamically.
6. Paleoclimate studies indicate in warmer globe context we see greater cyclonic/hurricane activity
7. Studies of the Australian context indicate as globe warms we should see the following events as signs and confirmations from computer modelling based on warmer globe context:
a. Greater EL Nino intensity
b. Greater La Nina intensity
c. Greater prolonged drought seasons/intensifying downpours/more powerful cyclones/ floods / extreme weather events dependent on La Nina/El Nino extremes which will worsen as the planet warms more.
d. The cause of a cyclone event should be verifiable by ANY given hypothesis based on the scientific method. This does mean that cyclones were ALWAYS dependent on Carbon Dioxide being in greater concentrations. It would simply mean that the extra warming mechanism was different at that time as to its causation. Solar/Earth tilt/Earth orbit/Season Air Current shift/Volcanic/Greenhouse gas concentrations*. This is called climate variability.
* Some really bad science is coming out that is simply not science based. Even Spencer baulks at some of this rubbish science.
Wikipedia:
hypothesis (from Greek ὑπόθεσις; plural hypotheses) is a proposed explanation for an observable phenomenon. The term derives from the Greek, ὑποτιθέναι – hypotithenai meaning “to put under” or “to suppose.” For a hypothesis to be put forward as a scientific hypothesis, the scientific method requires that one can test it. Scientists generally base scientific hypotheses on previous observations that cannot satisfactorily be explained with the available scientific theories. Even though the words “hypothesis” and “theory” are often used synonymously in common and informal usage, a scientific hypothesis is not the same as a scientific theory. A working hypothesis is a provisionally accepted hypothesis.
So what do we have – CO2 did not cause directly the storms and it does not work that way.
What CO2 does is create the mechanism and first cause to warming “drift” in climate – its called nudging. The rest is how water vapor/clouds/oceans RESPOND – climate sensitivity.
So what is your answer – simply if you deny that CO2 is first cause the way you perceive the end result will be different.
Finally if want to remove the CO2 as the first cause of global warming or a warming globe then you have to develop another hypothesis of same quality and quantity.
That my friend is why we disagree. Do not come back to me and tell me that this is not sound science – it is and that is why we are having this debate.