UPDATE: Live The last radar image from Willis Island added below. The last radar image is truly striking.
Also, see below for the differences between the Australia hurricane scale and the familiar Saffir-Simpson scale used in the USA. They are not equal.
From Australia’s BoM, time to “get outta Dodge” as they say:

Simon at Australian Climate Madness notes this for rebuttal of the inevitable “Yasi caused by global warming” links that will be pushed on the blogs and by the press:
Tropical cyclone Mahina hit on 4 March 1899. It was a Category 5 cyclone, the most powerful of the tropical cyclone severity categories. In addition, Mahina was perhaps one of the most intense cyclones ever observed in the Southern Hemisphere and almost certainly the most intense cyclone ever observed off the East Coast of Australia in living memory. Mahina was named by Government Meteorologist for Queensland Clement Wragge, a pioneer of naming such storms.
Here’s what BoM has to say on their tracking page:
The forecast path shown above is the Bureau’s best estimate of the cyclone’s future movement and intensity. There is always some uncertainty associated with tropical cyclone forecasting and the grey zone indicates the range of likely tracks of the cyclone centre.
Due to the uncertainty in the future movement, the indicated winds will almost certainly extend to regions outside the rings on this map. The extent of the warning and watch zones reflects this.
This product is designed for land-based communities; mariners should read the coastal waters and high seas warnings.
Remarks:
SEVERE TC YASI IS A LARGE AND VERY POWERFUL TROPICAL CYCLONE AND POSES AN EXTREMELY SERIOUS THREAT TO LIFE AND PROPERTY WITHIN THE WARNING AREA, ESPECIALLY BETWEEN CAIRNS AND TOWNSVILLE.
THIS IMPACT IS LIKELY TO BE MORE LIFE THREATENING THAN ANY EXPERIENCED DURING RECENT GENERATIONS.
TC Yasi, CATEGORY 5, will continue to move in a west-southwesterly direction during the day. The cyclone is expected to cross the coast in the Innisfail area at about midnight.
Coastal residents within the warning area, and particularly between Cairns and Ayr are specifically warned of an EXTREMELY DANGEROUS SEA LEVEL RISE [i.e. storm tide] as the cyclone approaches, crosses the coast and moves inland. The sea is likely to steadily rise up to a level which will be VERY DANGEROUSLY above the normal tide, with EXTREMELY DAMAGING WAVES, STRONG CURRENTS and FLOODING of low-lying areas extending some way inland. People living in areas likely to be affected by this flooding should take measures to protect their property as much as possible, and be prepared to follow instructions regarding evacuation of the area if advised to do so by authorities.
DAMAGING WINDS with gusts to 90 km/hr that are currently developing on coastal islands, are forecast to develop about the coast by late morning and about the tropical interior overnight.
Between Cape Tribulation and Ingham these winds will become DESTRUCTIVE with gusts in excess of 125km/hr during the afternoon and early evening and VERY DESTRUCTIVE with gusts up to 300 km/hr between Cairns and Ingham during the evening as the cyclone approaches and crosses the coast. These VERY DESTRUCTIVE winds can also occur on the seaward side of hills to the north of the cyclone and are also forecast to reach the Atherton Tablelands.
Winds are forecast to ease about the east coast during Thursday morning as the cyclone moves inland.
FLOODING RAINS will develop from Cooktown to Sarina during the afternoon and then extend inland overnight.
People between Cape Melville and Sarina, extending inland to Croydon and Richmond should complete preparations quickly and be prepared to shelter in a safe place.
– Boats and outside property should be secured.
– For cyclone preparedness and safety advice, visit Queensland’s Disaster Management Services website (www.disaster.qld.gov.au)
– For emergency assistance call the Queensland State Emergency Service (SES) on 132 500 (for assistance with storm damage, rising flood water, fallen trees on buildings or roof damage).
People about the remaining tropical interior east of Camooweal and north of Winton should consider what action they will need to take if the cyclone threat increases.
– Information is available from your local government
– For cyclone preparedness and safety advice, visit Queensland’s Disaster Management Services website (www.disaster.qld.gov.au)
– For emergency assistance call the Queensland State Emergency Service (SES) on 132 500 (for assistance with storm damage, rising flood water, fallen trees on buildings or roof damage).
Name: Severe Tropical Cyclone Yasi
Details:
| Time (EST) | Intensity Category | Latitude
(decimal deg.) |
Longitude
(decimal deg.) |
Estimated Position
Accuracy (km) |
|
|---|---|---|---|---|---|
| 0hr | 7 am February 2 | 5 | 16.1S | 150.9E | 20 |
| +6hr | 1 pm February 2 | 5 | 16.7S | 149.1E | 45 |
| +12hr | 7 pm February 2 | 5 | 17.2S | 147.5E | 75 |
| +18hr | 1 am February 3 | 4 | 17.8S | 145.8E | 100 |
| +24hr | 7 am February 3 | 2 | 18.5S | 144.1E | 130 |
| +36hr | 7 pm February 3 | 1 | 19.8S | 141.1E | 190 |
| +48hr | 7 am February 4 | tropical low | 20.9S | 138.4E | 250 |
The next Forecast Track Map will be issued by 11:00 am EST Wednesday
===============================================================
UPDATE:
Commenter sHx writes:
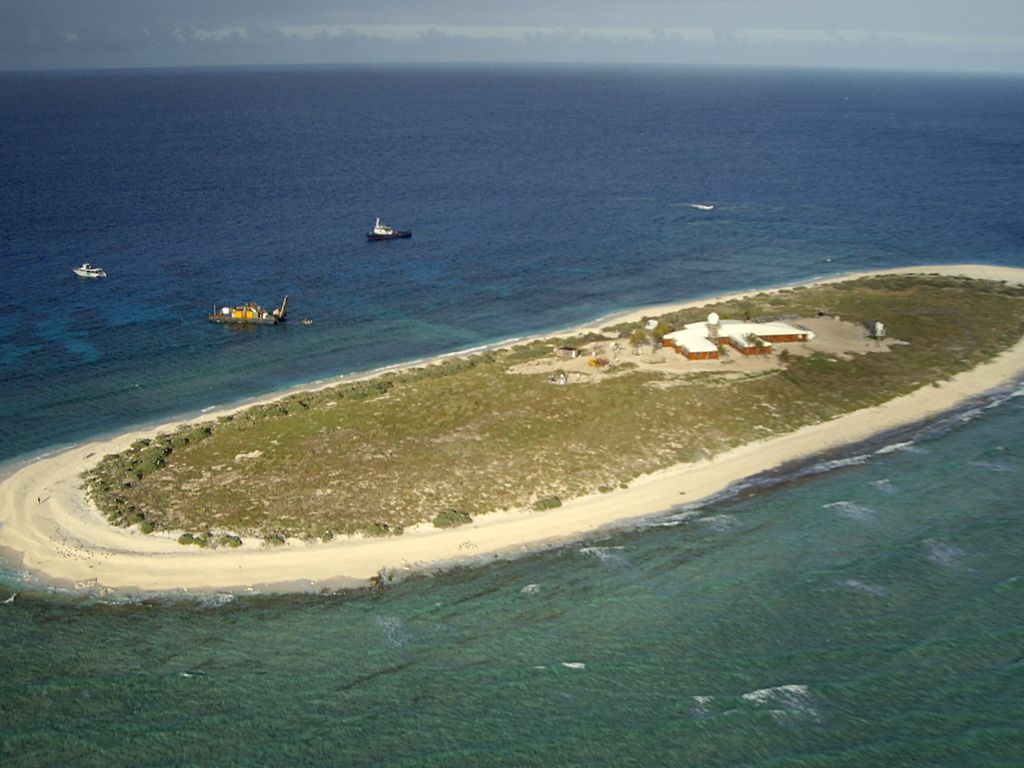
AS of this moment Yasi is right on top of Willis Island. http://en.wikipedia.org/wiki/Willis_Island
Apparently the island has a meteorological post. It even has radar! http://www.bom.gov.au/products/IDR412.loop.shtml

It must be frightening to be that radar operator looking at this, knowing when that eyewall hits you are going to be subject to Cat5 winds and you have a 30meter tall radar tower right next to you, and there’s really no shelter elsewhere on the island and no place to go. I wonder how long we’ll continue to get a signal from the Willis Island’s radar?
UPDATE2: Just about the time I pressed “update” the radar went out, the radar station is offline. The last image from the station is above. We hope for the best for the BoM employees there. The storm surge must be ferocious. Hopefully BoM evacuated them and they left the radar on “auto”. Given the size and composition of the island versus the size of the hurricane, Willis Island may very well be erased by this storm.
===============================================================
Good luck to our friends in Queensland, especially Dr. Bob Carter and Nigel, who helped during my tour in Townsville last year.
===============================================================
UPDATE 3: Hurricane expert Dr. Ryan Maue brings to our attention the differences in tropical cyclone scales. The Saffir-Simpson scale used maximum sustained one-minute winds while the Australian Region scale uses ten-minute averaged sustained winds. The convention to convert is (10-minute)*1.14 = 1-minute sustained (units are knots). This image combined from Wikipedia’s article.

The JTWC advisory intensity at 00Z Feb 2 of 125 knots is a strong Category 4 on the Saffir-Simpson scale. The Australian Bureau of Meteorology reports central pressure of 930 hPa, and backs out Category 5 winds from that. Also, feel free to call Yasi a “willy-willy“.
According to a comment on Jennifer Marohasy’s blog:
Just asking, but how does anybody know what the wind speeds are? 295 km/hr? Where was that measured and how was it measured? If it was measured from the air, how do we know what the speed at sea level is?
Willis island, the only weather station in the cyclone path, reached 185 km/hr gust, 140 continuous, very close to the eye wall. That is extreme, but there is a huge difference still between that and 295.
To Graeme W
You are correct, the data from Willis Island should have the lowest error bands of possible temperature measurement error over a reasonable historical period.
It is a small island with no UHI. Also, note the narrow temperature range between min and max on a daily and yearly basis. That means less stress on the thermometer measuring system, regardless of the thermometer used, hence less frequent calibrations needed.
Their temp data should be some of the most reliable in the world.
Philip Bradley
Mate your far from being neutral.
The drought intensification is coupled to stronger then normal El Nino events driven by increased ocean temperatures.
The rain intensification is coupled to stronger La Nina events driven by ocean turn over of surface energy heat descending into the cooler depths and the uprising of colder oceanic in a process of climate equilibrium.
The models predict in a warming globe extreme events at both ends of the scale. The report was die accurate!
The US for example is experiencing extreme events. The snow represents climate shifting and on the move. That snow and ice got into the atmosphere in the first place by the earth’s climate storing more energy from the sun. Its “solar cells” gathering this extra energy is the minor radiative CO2 forcing. There is a strong correlation. Very strong. Models many of them produce and can predict these bizarre weather patterns as climate shifts in real time. We depend on the observation as much as we do when we warn of catastrophe through climate modelling.
Water vapour on the move and in many forms is sign of a warming globe producing bizarre out of the ordinary aberrant climate.
It was predicted along with the drought durations intensifying and the rains intensifying in 24 to 36 extreme events. It also clearly shows in the document to avoid flood areas when considering building or re-locating.
The QLD report is the most practical document I’ve ever read as it applies to my daily quality of life and our climate. Only a fool would ignore such information.
The records are accurate and I am no new kid here in regards to BOM historical data.
Cherry picking is another thing. Oh its snowing, drought or raining or flooding – all these are of course climate on the move.
It is obvious where I stand on this issue – and those of us who are convinced – do not need to be babied by cherry picked data.
Ross Brisbane says:
February 1, 2011 at 3:45 pm
===========================
Nonsense! You are falling into the trap: “the climate models predict….”
The disastrous and tragic weather events in Queensland this season are related to a VERY strong and unrelenting La Nina and, see here, the highest Southern Oscillation Index reading in 92 years.
http://www.guardian.co.uk/world/2011/feb/01/cyclone-yasi-head-towards-queensland-australia
Stay safe there mate. You ‘stralians are made of steel…and you will rebuild after any disaster, I am confident.
Chris
Norfolk, VA, USA
Ross Brisbane says:
“It is obvious where I stand on this issue – and those of us who are convinced – do not need to be babied by cherry picked data.”
==============================
Yes it is quite obvious where you stand.
As to the UNconvinced.
Many of us will not be “babied” by cherry-picked model outputs…model outputs that [still] have NO grasp whatsoever on the extremely complex and chaotic nature of climate.
Sorry mate.
You wanna put forth a fantastic theory….then the BURDEN of proof, rests solely upon you.
Let’s see it.
Chris
Norfolk, VA, USA
Graeme W says:
February 1, 2011 at 7:34 pm
Graeme what that info tells me is that the weather of Willis Island is totally controlled by the tropical ocean it resides in.
As such, one would expect very little variations in Ts. The highest min. Ts are during the strong El Nino years of 1998 and 2010. the very narrow T range is also consistent with that.
A plot comparing SSTs of the area to Willis Island Ts should confirm that.
Ross Brisbane
So, Ross, the BOM bring out a Report “sort of” predicting more rainfall at the end of October 2010, when the forming La Nina was obvious and the rains had already started to fall.
How clever of them.
Here is a link to what they were predicting for now, back in 2007.
http://www.csiro.au/news/ClimateChangeInAustraliaReport.html
Here is a link to what they were predicting for now, back in 2008.
http://www.daff.gov.au/__data/assets/pdf_file/0007/721285/csiro-bom-report-future-droughts.pdf
Here is a link to what they were predicting for now, back in 2009.
http://www.bom.gov.au/inside/eiab/State-of-climate-2010-updated.pdf
Here’s a heads-up Ross. Try a simple word count in each document on the words “drought” and “flood”.
You wouldn’t happen to be a recent arrival here from Sydney or Melbourne would you Ross?
OT and in another hemisphere and season….check out the University of Chicago webcams right now.
http://ctscam.uchicago.edu/view/
http://buscam.uchicago.edu/view/index.shtml
Michael says:
February 1, 2011 at 4:42 pm
if u want… go to another planet
where there aren’t cyclones, droughts, what ever…
The last returns seem to show that Yasi is undergoing an ever so slight intensification phase?
Am I wrong or is that dry air “outta there” and we are looking at a more concentric CDO?
http://www.wunderground.com/tropical/tracking/sp201111_sat.html#a_topad
Chris
Norfolk, VA, USA
Ross Brisbane,
While certainly Yasi will be “a good blow” in FNQ terms, and there will be a lot of heartbreak and clen-up afterwards – this is not unusual.
I recently was heartbroken to leave FNQ after 10 years (job reasons), but the recent cyclone seasons have been very quiet – Larry in 2006 was the only stand-up performer doing the regular 30 year odd run of flattening Innisfail.
You may be from Brisbane (or even further south in the past), however I grew up and lived in SEQ and the far north for 40 years – none of the recent flooding (15 years in Toowoomba too) is “unprecedented”. Particularly the Toowoomba creek flooding – I remember them being just as high-running during major storms about 25 years ago, the difference this time is the short-term memory of elected officials building parks and bridges, narrowing the normal watercourse and creating the ideal environment for a fast-running flash flood.
I suggest studying the yearly records of BOM data for FNQ, neither the rain or the frequency of cyclones has changed at all. The extraordinary claims from some representatives of BOM and CSIRO require extraordinary evidence to back them up – and it’s not there.
Cheers
Looks like an eyewall replacement cycle, too.
~Chris
To Baa Humbug
Sure, yes, it is a proxy for SST.
However, the Willis Island data is a better absolute temperature measurement for SST than historical SST data made of the water itself.
Historical SST data is fraught with errors, comprising of a lot of data by taking a bucket of sea water up from the sea and sticking a mercury thermometer in it…
And recent satellite measurements are OK for yearly temp difference magnitudes, temp differences from one location to another, comparisons, if you will, but not for absolute measurement (I have a 20 yr professional background in IR temp measurement).
Willis Island type data is about the best you can expect to get over a near 100 yr period.
Addendum..
Price of bananas will skyrocket again though…. Maybe the trees replanted along the North NSW coast after Larry in 2006 are producing enough now….
Here’s wishing and hoping all the best for the residents of Townsville, OZ. Looks like a beautiful place. God be with them.
Chris
Norfolk, VA, USA
Ross Brisbane,
Here’s the tropical cyclone trend 1970 – 2005:
http://www.bom.gov.au/cyclone/climatology/trends.shtml
La Nina is the reason.
During 1974 queenland was devestated by floods from ex TC’s Wanda and Zoe and then of course the big one – TC Tracey hit Darwin on Dec 24. All of this weather was linked to a strong La Nina.
With the strong La Nina now it was almost inevitable that a big TC would develop. Let’s just hope that Yasi misses the major population areas.
Strong La Niña event persists in the Pacific
Issued on Wednesday 2 February 2011
Australia continues to feel the effects of one of the strongest La Niña’s on record.
http://www.bom.gov.au/climate/enso/
The Flinder’s Reef station is still reporting every 30 minutes (then a few minutes for data upload to the website).
http://www.bom.gov.au/products/IDQ60801/IDQ60801.94290.shtml
Here is the map of stations to retrieve current measurements.
http://www.bom.gov.au/qld/qld-observations-map.shtml
savethesharks says:
“Here’s wishing and hoping all the best for the residents of Townsville, OZ. Looks like a beautiful place. God be with them.”
That says it for me, too. There are no folks I admire more than Australians. It wouldn’t bother me at all if they ruled the world.
Smokey says:
February 1, 2011 at 10:01 pm
That says it for me, too. There are no folks I admire more than Australians. It wouldn’t bother me at all if they ruled the world.
===========================
Agreed. They are tough as nails.
Chris
Norfolk, VA, USA
OT again but look at what Nature can do and how our species (even with our tech advances) can STILL be so stupid:
From Chicago NWS:
… Blizzard creating life threatening situation for motorists…
Reports from media and local law enforcement officially indicate
that hundreds if not thousands of vehicles have gone off the
roads. The governor has activated the National guard who are
currently rescuing stranded motorists.
The blizzard conditions will continue tonight… particularly in
open areas where white out conditions will make travel
impossible. Local law enforcement officials are telling people to
stay off the roads as not a single Road is passable in rural and
open areas. They are asking people to stay in a safe place and not
to leave home tonight.
This is a potentially life threatening situation. Do not travel
unless absolutely necessary overnight.
Here’s the latest webcam from the University of C:
http://buscam.uchicago.edu/view/index.shtml
Wow.
Chris
Norfolk, VA, USA
Good luck Oz. Kiwi’s are praying for you.
savethesharks says:
February 1, 2011 at 10:10 pm
Thanks guys (from someone who felt he was born an Aussie, but in the wrong country, but has now rectified the matter permanently). I agree totally.