Some people cite scientists saying there is a “CO2 control knob” for Earth. No doubt there is, but due to the logarithmic effect of CO2, I think of it like a fine tuning knob, not the main station tuner. That said, a new data picture is emerging of an even bigger knob and lever; a nice bright yellow one.

A few months back, I found a website from NOAA that provides an algorithm and downloadable program for spotting regime shifts in time series data. It was designed by Sergei Rodionov of the NOAA Bering Climate and Ecosystem Center for the purpose of detecting shifts in the Pacific Decadal Oscillation.
Regime shifts are defined as rapid reorganizations of ecosystems from one relatively stable state to another. In the marine environment, regimes may last for several decades and shifts often appear to be associated with changes in the climate system. In the North Pacific, climate regimes are typically described using the concept of Pacific Decadal Oscillation. Regime shifts were also found in many other variables as demonstrated in the Data section of this website (select a variable and then click “Recent trends”).
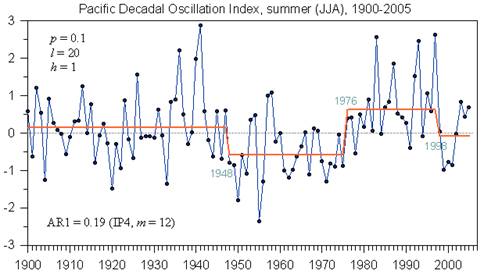
But data is data, and the program doesn’t care if it is ecosystem data, temperature data, population data, or solar data. It just looks for and identifies abrupt changes that stabilize at a new level. For example, a useful application of the program is to look for shifts in weather data, such as that caused by the PDO. Here we can clearly see the great Pacific Climate Shift of 1976/77:
Another useful application is to use it to identify station moves that result in a temperature shift. It might also be applied to proxy data, such as ice core Oxygen 18 isotope data.
But the program was developed around the PDO. What drives the PDO? Many say the sun, though there are other factors too. It follows to reason then the we might be able to look for solar regime shifts in PDO driven temperature data.
Alan of AppInSys found the same application and has done just that, and the results are quite interesting. The correlation is well aligned, and it demonstrates the solar to PDO connection quite well. I’ll let him tell his story of discovery below. – Anthony
=================================
Climate Regime Shifts
The notion that climate variations often occur in the form of ‘‘regimes’’ began to become appreciated in the 1990s. This paradigm was inspired in large part by the rapid change of the North Pacific climate around 1977 [e.g., Kerr, 1992] and the identification of other abrupt shifts in association with the Pacific Decadal Oscillation (PDO) [Mantua et al., 1997].” [http://www.beringclimate.noaa.gov/regimes/Regime_shift_algorithm.pdf]
Pacific Regime Shifts
Hare and Mantua, 2000 (“Empirical evidence for North Pacific regime shifts in 1977 and 1989”): “It is now widely accepted that a climatic regime shift transpired in the North Pacific Ocean in the winter of 1976–77. This regime shift has had far reaching consequences for the large marine ecosystems of the North Pacific. Despite the strength and scope of the changes initiated by the shift, it was 10–15 years before it was fully recognized. Subsequent research has suggested that this event was not unique in the historical record but merely the latest in a succession of climatic regime shifts. In this study, we assembled 100 environmental time series, 31 climatic and 69 biological, to determine if there is evidence for common regime signals in the 1965–1997 period of record. Our analysis reproduces previously documented features of the 1977 regime shift, and identifies a further shift in 1989 in some components of the North Pacific ecosystem. The 1989 changes were neither as pervasive as the 1977 changes nor did they signal a simple return to pre-1977 conditions.”
[http://www.sciencedirect.com/science?_ob=ArticleURL&_udi=B6V7B-41FTS3S-2…]
Overland et al “North Pacific regime shifts: Definitions, issues and recent transitions”
[http://www.pmel.noaa.gov/foci/publications/2008/overN667.pdf]: “climate variables for the North Pacific display shifts near 1977, 1989 and 1998.”
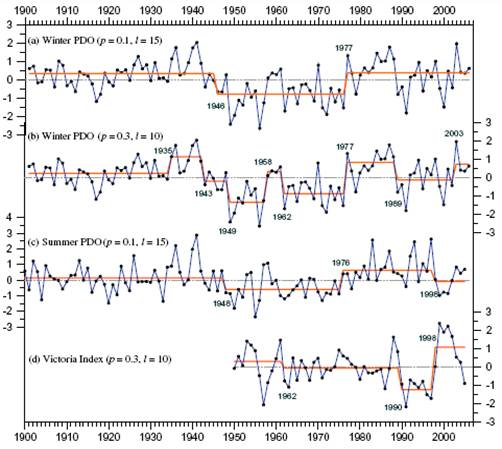
The following figure from the above paper show analysis of PDO and Victoria Index using the Rodionov regime detection algorithm. A regime shift is also detected around 1947-48.
The following figure shows regime shift detection for the summer PDO, showing shifts at 1948, 1976 and 1998.
[http://www.beringclimate.noaa.gov/data/Images/PDOs_FigRegime.html]
(For detailed information on the 1976/77 climate shift,
see: http://www.appinsys.com/GlobalWarming/The1976-78ClimateShift.htm)
Regime Shift Detection in Annual Temperature Anomaly Data
The NOAA Bering Climate web site provides the algorithm for regime shift detection developed by Sergei Rodionov [http://www.beringclimate.noaa.gov/regimes/index.html]. The following analyses use the Excel VBA regime change algorithm version 3.2 from this web site.
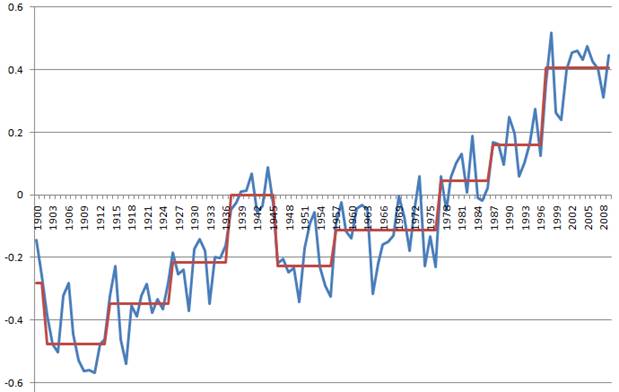
The following figure shows the regime analysis of the HadCRUT3 annual global annual average temperature anomaly data from the Met Office Hadley Centre for 1895 to 2009 [http://hadobs.metoffice.com/hadcrut3/diagnostics/global/nh+sh/annual].
The analysis was run based on the mean using a significance level of 0.1, cut-off length of 10 and Huber weight parameter of 2 using red noise IP4 subsample size 6. Regime changes are identified in 1902, 1914, 1926, 1937, 1946, 1957, 1977, 1987, and 1997. Running the analysis based on the variance rather than the mean results in regime changes in the bold years listed above.
Regime Shift Relationship to Solar Cycle
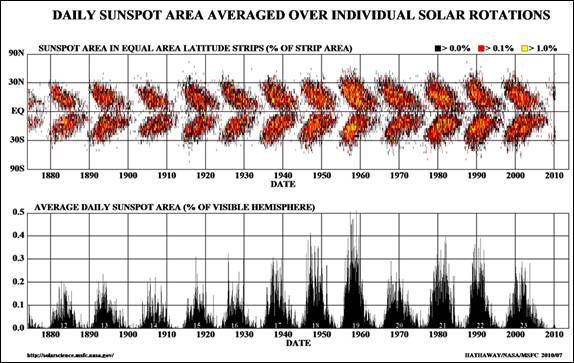
The NASA Solar Physics web site provides the following figure showing sunspot area.
[http://solarscience.msfc.nasa.gov/SunspotCycle.shtml]
The following figure compares the Hadley (HadCrut3) monthly global average temperature (from [http://hadobs.metoffice.com/hadcrut3/diagnostics/global/nh+sh/]) overlaid with the regime change line (red line) shown previously, along with the sunspot area since 1900. The sunspot cycle is approximately 11 years. The sun’s magnetic field reverses with each sunspot cycle and thus after two sunspot cycles the magnetic field has completed a cycle – a Hale Cycle – and is back to where it started. Thus a complete magnetic sunspot cycle is approximately 22 years. The figure marks the onset of odd-numbered cycles with a vertical red line, even-numbered cycles with a green line.
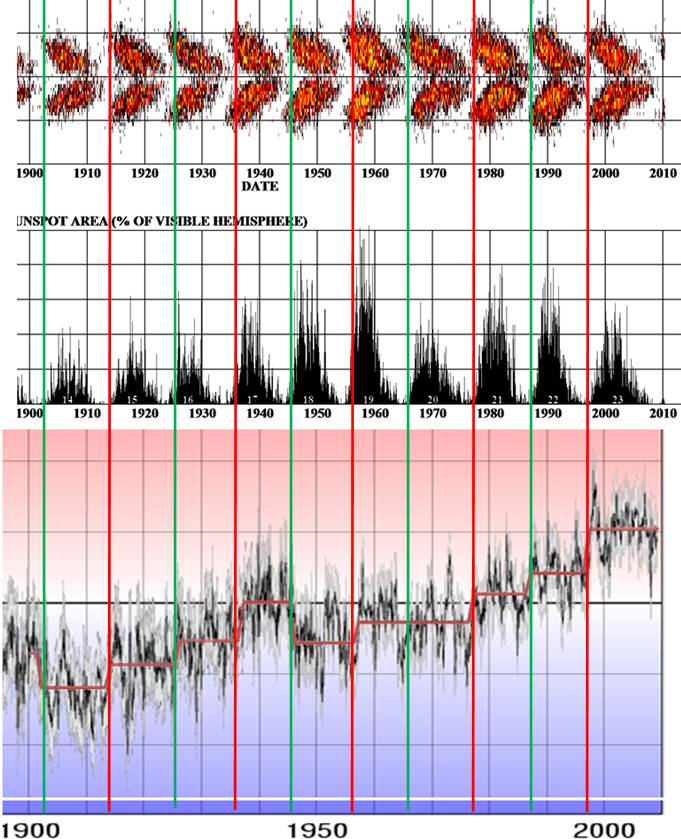
From the figure above it can be seen that the regime changes correspond to the onset of solar cycles and occur when the “butterfly” is at its widest. The most significant warming regime shifts occur at the start of odd-numbered cycles (1937, 1957, 1977, 1997). Each odd-numbered cycle (red lines above) has resulted in a temperature-increase regime shift. Even-numbered cycles (green lines above) have been inconsistent, with some resulting in temperature-decrease regime shifts (1902, 1946) or minor temperature-increase shifts (1926, 1987).
An unusual one is the 1957 – 1966 cycle, which in the monthly data shown above visually looks like a temperature-increase shift in 1957 followed by a temperature-decrease shift in 1964 but the regime detection algorithm did not identify it. This is likely due to the use of annually averaged data in the regime detection algorithm.
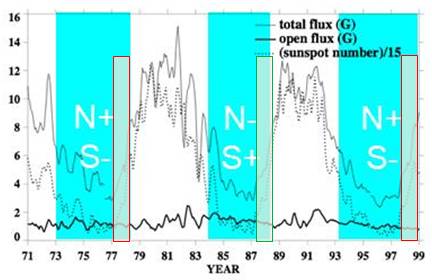
The following figure shows the relative polarity of the Sun’s magnetic poles for recent sunspot cycles along with the solar magnetic flux [www.bu.edu/csp/nas/IHY_MagField.ppt]. The regime change periods are highlighted by the red and green boxes. Each one occurs on as the solar cycle is accelerating. The onset of an odd-numbered sunspot cycle (1977-78, 1997-98) results in the relative alignment of the Earth’s and the Sun’s magnetic fields (positive North pole on the Sun) allowing greater penetration of the geomagnetic storms into the Earth’s atmosphere. “Twenty times more solar particles cross the Earth’s leaky magnetic shield when the sun’s magnetic field is aligned with that of the Earth compared to when the two magnetic fields are oppositely directed” [http://www.nasa.gov/mission_pages/themis/news/themis_leaky_shield.html]
The following figure shows the longitudinally averaged solar magnetic field. This “magnetic butterfly diagram” shows that the sunspots are involved with transporting the field in its reversal. The Earth’s temperature regime shifts are indicated with the superimposed boxes – red on odd numbered solar cycles, green on even.
[http://solarphysics.livingreviews.org/open?pubNo=lrsp-2010-1&page=articlesu8.html]
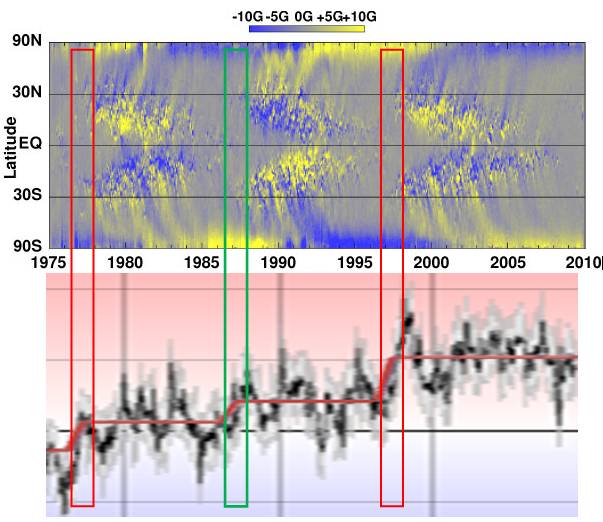
The Earth’s temperature regime shift occurs as the solar magnetic field begins its reversal.
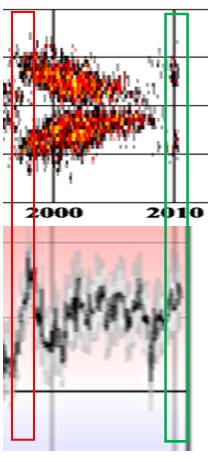
Solar Cycle 24
Solar cycle 24 is in its initial stage after getting off to a late start. An El Nino occurred in the first part of 2010. This may be the start of the next regime shift.
Climate Regime Shifts
[last update: 2010/07/04]
|
“The notion that climate variations often occur in the form of ‘‘regimes’’ began to become appreciated in the 1990s. This paradigm was inspired in large part by the rapid change of the North Pacific climate around 1977 [e.g., Kerr, 1992] and the identification of other abrupt shifts in association with the Pacific Decadal Oscillation (PDO) [Mantua et al., 1997].” [http://www.beringclimate.noaa.gov/regimes/Regime_shift_algorithm.pdf]
|
|
Pacific Regime Shifts
Hare and Mantua, 2000 (“Empirical evidence for North Pacific regime shifts in 1977 and 1989”): “It is now widely accepted that a climatic regime shift transpired in the North Pacific Ocean in the winter of 1976–77. This regime shift has had far reaching consequences for the large marine ecosystems of the North Pacific. Despite the strength and scope of the changes initiated by the shift, it was 10–15 years before it was fully recognized. Subsequent research has suggested that this event was not unique in the historical record but merely the latest in a succession of climatic regime shifts. In this study, we assembled 100 environmental time series, 31 climatic and 69 biological, to determine if there is evidence for common regime signals in the 1965–1997 period of record. Our analysis reproduces previously documented features of the 1977 regime shift, and identifies a further shift in 1989 in some components of the North Pacific ecosystem. The 1989 changes were neither as pervasive as the 1977 changes nor did they signal a simple return to pre-1977 conditions.” [http://www.sciencedirect.com/science?_ob=ArticleURL&_udi=B6V7B-41FTS3S-2…]
Overland et al “North Pacific regime shifts: Definitions, issues and recent transitions” [http://www.pmel.noaa.gov/foci/publications/2008/overN667.pdf]: “climate variables for the North Pacific display shifts near 1977, 1989 and 1998.”
The following figure from the above paper show analysis of PDO and Victoria Index using the Rodionov regime detection algorithm. A regime shift is also detected around 1947-48.
The following figure shows regime shift detection for the summer PDO, showing shifts at 1948, 1976 and 1998. [http://www.beringclimate.noaa.gov/data/Images/PDOs_FigRegime.html]
(For detailed information on the 1976/77 climate shift, see: http://www.appinsys.com/GlobalWarming/The1976-78ClimateShift.htm)
|
|
Regime Shift Detection in Annual Temperature Anomaly Data
The NOAA Bering Climate web site provides the algorithm for regime shift detection developed by Sergei Rodionov [http://www.beringclimate.noaa.gov/regimes/index.html]. The following analyses use the Excel VBA regime change algorithm version 3.2 from this web site.
The following figure shows the regime analysis of the HadCRUT3 annual global annual average temperature anomaly data from the Met Office Hadley Centre for 1895 to 2009 [http://hadobs.metoffice.com/hadcrut3/diagnostics/global/nh+sh/annual].
The analysis was run based on the mean using a significance level of 0.1, cut-off length of 10 and Huber weight parameter of 2 using red noise IP4 subsample size 6. Regime changes are identified in 1902, 1914, 1926, 1937, 1946, 1957, 1977, 1987, and 1997. Running the analysis based on the variance rather than the mean results in regime changes in the bold years listed above.
|
|
Regime Shift Relationship to Solar Cycle
The NASA Solar Physics web site provides the following figure showing sunspot area. [http://solarscience.msfc.nasa.gov/SunspotCycle.shtml]
The following figure compares the Hadley (HadCrut3) monthly global average temperature (from [http://hadobs.metoffice.com/hadcrut3/diagnostics/global/nh+sh/]) overlaid with the regime change line (red line) shown previously, along with the sunspot area since 1900. The sunspot cycle is approximately 11 years. The sun’s magnetic field reverses with each sunspot cycle and thus after two sunspot cycles the magnetic field has completed a cycle – a Hale Cycle – and is back to where it started. Thus a complete magnetic sunspot cycle is approximately 22 years. The figure marks the onset of odd-numbered cycles with a vertical red line, even-numbered cycles with a green line.
From the figure above it can be seen that the regime changes correspond to the onset of solar cycles and occur when the “butterfly” is at its widest. The most significant warming regime shifts occur at the start of odd-numbered cycles (1937, 1957, 1977, 1997). Each odd-numbered cycle (red lines above) has resulted in a temperature-increase regime shift. Even-numbered cycles (green lines above) have been inconsistent, with some resulting in temperature-decrease regime shifts (1902, 1946) or minor temperature-increase shifts (1926, 1987).
An unusual one is the 1957 – 1966 cycle, which in the monthly data shown above visually looks like a temperature-increase shift in 1957 followed by a temperature-decrease shift in 1964 but the regime detection algorithm did not identify it. This is likely due to the use of annually averaged data in the regime detection algorithm.
The following figure shows the relative polarity of the Sun’s magnetic poles for recent sunspot cycles along with the solar magnetic flux [www.bu.edu/csp/nas/IHY_MagField.ppt]. The regime change periods are highlighted by the red and green boxes. Each one occurs on as the solar cycle is accelerating. The onset of an odd-numbered sunspot cycle (1977-78, 1997-98) results in the relative alignment of the Earth’s and the Sun’s magnetic fields (positive North pole on the Sun) allowing greater penetration of the geomagnetic storms into the Earth’s atmosphere. “Twenty times more solar particles cross the Earth’s leaky magnetic shield when the sun’s magnetic field is aligned with that of the Earth compared to when the two magnetic fields are oppositely directed” [http://www.nasa.gov/mission_pages/themis/news/themis_leaky_shield.html]
The following figure shows the longitudinally averaged solar magnetic field. This “magnetic butterfly diagram” shows that the sunspots are involved with transporting the field in its reversal. The Earth’s temperature regime shifts are indicated with the superimposed boxes – red on odd numbered solar cycles, green on even. [http://solarphysics.livingreviews.org/open?pubNo=lrsp-2010-1&page=articlesu8.html]
The Earth’s temperature regime shift occurs as the solar magnetic field begins its reversal.
|
|
Solar Cycle 24
Solar cycle 24 is in its initial stage after getting off to a late start. An El Nino occurred in the first part of 2010. This may be the start of the next regime shift.
|
Ulric Lyons says:
July 12, 2010 at 2:52 am (Edit)
Here are two; http://wattsupwiththat.com/2010/06/04/new-scafetta-paper-his-celestial-model-outperforms-giss/#comment-405845
http://wattsupwiththat.com/2010/05/15/hey-dude-where%e2%80%99s-my-solar-ramp-up/#comment-391923
Hi Ulric, I asked on one of those threads where you got the 17 year cycle from.
@tallbloke says:
July 12, 2010 at 12:06 am
“12 occurred within a year of minimum
8 occurred on the declining part of the cycle
4 occurred near the peak of the cycle. 2 of these were low cycles following high ones.”
I make it 8 within a year of minimum
9 on the declining part of the cycle
7 near the peak of the cycle (within 1 year)
That leaves 2 on the rising portion that are not within a year of max or min (both within 2 years of min and max)
Not may El Nino`s on the rising side of solar cycles then tallbloke!
In 2007, I forecasted an El Nino from July 2009, and the next El Nino from late 2013.
Stephen Wilde replied to Leif and me, “I have said several times that the response of the polar oscillations to the changes in solar activity is also affected by the oceanic oscillations.”
Then the way your NCM is presented in your post…
http://wattsupwiththat.com/2010/04/06/a-new-and-effective-climate-model/
…needs to be rewritten. And you should exclude all of the details you can’t document.
You wrote, “Whether I am right or not remains to be seen and I am entitled to put it out there so that it can be compared with future real world events.”
The real world events are documented via satellite-based data and that data disagrees with your proposals, so even if by luck your proposals agree with the weather for a few years, you’ve still got the periods beforehand when they don’t agree and those periods falsify your proposals.
You wrote, “My impression is that it is always to the north because most of the oceans are to the south and their effect pushes it north of the equator.”
The ITCZ accompanies the warmest waters. The Northern Hemisphere location of the warmest waters and ITCZ is a function of the geometries of the continents. Refer to Philander et al (1996) “Why The ITCZ Is Mostly North Of The Equator”. They write in their abstract, “The explanation for asymmetries that favor the Northern rather than Southern Hemisphere with the warmest waters and the ITCZ- involves the details of the local coastal geometries: the bulge of western Africa to the north of the Gulf of Guinea and the slope of the western coast of the Americas relative to meridians. ”
http://journals.ametsoc.org/doi/abs/10.1175/1520-0442%281996%29009%3C2958%3AWTIIMN%3E2.0.CO%3B2
Note the greatest flaw in the Sachs et al (2009) summation (last paragraph before methods) is the assumption that the change in radiative forcing from Downward Shortwave Radiation (which Leif has noted is based on an outdated reconstruction) is the same as a change in radiative forcing from Downward Longwave Radiation.
@tallbloke says:
July 12, 2010 at 12:06 am
Looking at the proportions of El Nino`s on rising and falling sides of the solar cycle, but not less than 1 year from min or max (2.5yr rising and 4.5yr falling), I make it 6 on the rising side and 13 on the falling side since 1902.
Around 1.25 more events on the rising side would give equal distribution when looked at from this point of view.
You’ll have to explain that more clearly to me so I can comment Ulric. I don’t see how 7.25=11.75 or how you can have a quarter of an El Nino. 🙂
Where does your 17 year coronal hole cycle come from? I’m still looking on the net but everyone else seems to think it’s 11 years but out of phase with the solar cycle.
@tallbloke says:
July 12, 2010 at 6:13 am
“Where does your 17 year coronal hole cycle come from? I’m still looking on the net but everyone else seems to think it’s 11 years but out of phase with the solar cycle.”
I mailed these to you last August:
http://adsabs.harvard.edu/full/2003ESASP.517..275G
http://www.springerlink.com/content/p00955r885255112/
http://adsabs.harvard.edu/abs/1998SoPh..183..201J
http://wattsupwiththat.com/2010/05/03/wuwt-arctic-sea-ice-news-3/#comment-383898
http://wattsupwiththat.com/2010/05/03/wuwt-arctic-sea-ice-news-3/#comment-383058
@tallbloke says:
July 12, 2010 at 6:11 am
You’ll have to explain that more clearly to me so I can comment Ulric. I don’t see how 7.25=11.75 or how you can have a quarter of an El Nino. 🙂
______________________________________________
So if average cycle rise time is 4.5yrs, that gives 6.5yrs fall time (4.5+6.5=11).
Ignore 1yr BOTH sides of max and min, leaves 2.5yr and 4.5yr. 2.5/4.5=0.5555.
With my quick tally (which I will check) there were 6 on the rise side (but not less than a year from min/max) and 13 on the decay (but not less than a year from min/max).
6/13=0.46, so if there were 7 on the rise side in this sample, 7/13=0.538, almost even stevens year for year.
Ulric Lyons says:
July 12, 2010 at 2:52 am
“I’ve never heard of the “17yr coronal hole cycle (and half cycle)”. I don’t believe I’ve ever heard Leif discuss it or seen it discussed on a thread in which he is commenting.”
Here are two …
Those two are just you claiming there is such a cycle.
There is no 17yr cycle in anything solar.
Tallbloke,
have you considered seasonal factors with El Nino? such that a cooler Jan/Feb helps to calm the trade winds (look at CET for Jan/Feb temp`s as an indicator of the solar signal).
Ulric Lyons says:
July 12, 2010 at 7:20 am (Edit)
@tallbloke says:
July 12, 2010 at 6:11 am
You’ll have to explain that more clearly to me so I can comment Ulric. I don’t see how 7.25=11.75 or how you can have a quarter of an El Nino. 🙂
______________________________________________
So if average cycle rise time is 4.5yrs, that gives 6.5yrs fall time (4.5+6.5=11).
Ignore 1yr BOTH sides of max and min, leaves 2.5yr and 4.5yr. 2.5/4.5=0.5555.
With my quick tally (which I will check) there were 6 on the rise side (but not less than a year from min/max) and 13 on the decay (but not less than a year from min/max).
6/13=0.46, so if there were 7 on the rise side in this sample, 7/13=0.538, almost even stevens year for year.
Your sum needs to be 6/19 compared to 13/19. not 7/13.
Therefore El nino is around twice as frequent on the downslope of the solar cycle. But the downslope is longer so that has to be considered.
Ulric Lyons says:
July 12, 2010 at 4:01 am (Edit)
I make it 8 within a year of minimum
9 on the declining part of the cycle
7 near the peak of the cycle (within 1 year)
I’ll post my graphic soon so we can argue the toss some more. 😉
Ulric is correct. One of the major periods of the solar system is 16.946 years.
Here is calculation:
Jupiter period = 11.862 years; or its frequency Fj = 1/11.862yr = 0.084303/yr
Saturn period = 29.657 years; or its frequency Fs = 1/29.657yr = 0.033719/yr
If these two frequencies resonate, as these do, then one of 2 sidebands is
F1=(Fj +Fs)/2 = (0.084303+0.033719)/2 = 0.118021668/2 = 0.059010834
Or corresponding period P1 = 1/F1 = 1/0.059010834 = 16.9460408 =~17 years
The other sideband is twice the J/S conjunction period.
In maths it is one of the basic trigonometric identities:
cos A + cos B = 2 cos ½ (A + B) cos ½ (A − B)
@tallbloke says:
July 12, 2010 at 8:14 am
“Your sum needs to be 6/19 compared to 13/19. not 7/13.”
No it does not, it is 7.2222/13 to achieve the same number of events per year for 2.5yr/4.5yr. The result since 1902 is 6/13, very slightly less on the rising side.
Vuk etc. says:
July 12, 2010 at 9:13 am
Ulric is correct.
No, he isn’t and you are not either. He cites Juckett who used the direction of the IMF [its polarity] to assert a 17yr cycle. Here is the power spectrum of the IMF direction since 1926: http://www.leif.org/research/FFT%20of%20IMF%20Direction.png
There are three periods: the rotation at 27 days [and at 14, 9, 7 days, corresponding to 2, 3, and 4 sectors]. The annual peak, which is split into two because the dominant polarity changes at every solar maximum [the amount of splitting is just what a solar cycle change of phase would give]. and a broad, fuzzy peak around the solar cycle period. This last ‘peak’ is poorly resolved [only 15 data points out of the 30850 total] and its various sub-peaks are not statistically significantly different from each other.
But perhaps you can find planetary combinations for the other 5 sub-peaks.
@Leif Svalgaard says:
July 12, 2010 at 7:24 am
Ulric Lyons says:
July 12, 2010 at 2:52 am
“I’ve never heard of the “17yr coronal hole cycle (and half cycle)”. I don’t believe I’ve ever heard Leif discuss it or seen it discussed on a thread in which he is commenting.”
Here are two …
Those two are just you claiming there is such a cycle.
There is no 17yr cycle in anything solar.
_________________________________________
Yes there is, do see my comments on the WUWT thread links regarding tree rings, Cicada ad the strongest monthly strings on CET ;
http://adsabs.harvard.edu/full/2003ESASP.517..275G
http://www.springerlink.com/content/p00955r885255112/
http://adsabs.harvard.edu/abs/1998SoPh..183..201J
http://wattsupwiththat.com/2010/05/03/wuwt-arctic-sea-ice-news-3/#comment-383898
http://wattsupwiththat.com/2010/05/03/wuwt-arctic-sea-ice-news-3/#comment-383058
This leaves me in a postion where I cannot trust your word when you say something does not exist in solar activity, you should have known about this.
Hi Ulric, sorry, with you now. I was confused by your whole number of events and your comparison of the lengths of upswing and downswing. I’m still seeing a lot more near the minimum than maximum though.
Vuk, nice thanks, but does this J/S period correlate with coronal holes? Where’s the evidence? Ulric?
Ulric Lyons says:
July 12, 2010 at 10:25 am
“There is no 17yr cycle in anything solar.”
Yes there is, do see my comments on the WUWT thread links regarding tree rings, Cicada ad the strongest monthly strings on CET
tree rings, Cicada and monthly strings have nothing to do with the Sun, coronal holes, or the IMF.
http://adsabs.harvard.edu/full/2003ESASP.517..275G etc
This leaves me in a postion where I cannot trust your word when you say something does not exist in solar activity, you should have known about this.
These claims are not substantiated by the data, so the period is not accepted as valid by the solar community. There are always lots of claims about cycles of every conceivable periods, but the data just isn’t there. See my reply upthread: Leif Svalgaard says: July 12, 2010 at 10:19 am
Tallbloke (A.2)
Coronal holes? I know nothing , I’m from Barcelona !
Dr Svalgaard (A.2)
Doc do yourself a favour and reed the content, beyond the first sentence. It is the secondary school maths, and one of the basics of harmonic oscillations!
Vuk etc. says:
July 12, 2010 at 10:43 am
Doc do yourself a favour and read the content, beyond the first sentence. It is the secondary school maths, and one of the basics of harmonic oscillations!
So what? It has nothing to do with the sun and is not present in the data.
Leif Svalgaard says:
July 12, 2010 at 10:52 am (Edit)
It has nothing to do with the sun and is not present in the data.
Where is the data on coronal holes?
I wouldn’t bet on that one. Take a look at its 3rd sub-harmonic, 51 years exactly.
http://www.vukcevic.talktalk.net/FFT-Power-Spectrum-SSN.png
tallbloke says:
July 12, 2010 at 11:04 am
Where is the data on coronal holes?
Let those who claim a period supply the data 🙂
There is some here: http://www.ngdc.noaa.gov/stp/solar/corona.html
http://iopscience.iop.org/0004-637X/716/1/693
Vuk etc. says:
July 12, 2010 at 11:09 am
I wouldn’t bet on that one. Take a look at its 3rd sub-harmonic, 51 years exactly.
http://www.vukcevic.talktalk.net/FFT-Power-Spectrum-SSN.png
But no significant one at 17 years or 34 years. You can hardly have a 3rd sub-harmonic without the other ones.