By Steven Goddard
The topic this week is verification of data sources. NSIDC reports :
At the end of the month, extent fell near the level recorded in 2006, the lowest in the satellite record for the end of May
That sounds bad! Let’s see how 2010 compares with ten, twenty and thirty years ago :

Ice looks healthier than 10 years ago

Ice looks healthier than 20 years ago

Ice looks healthier than 30 years ago
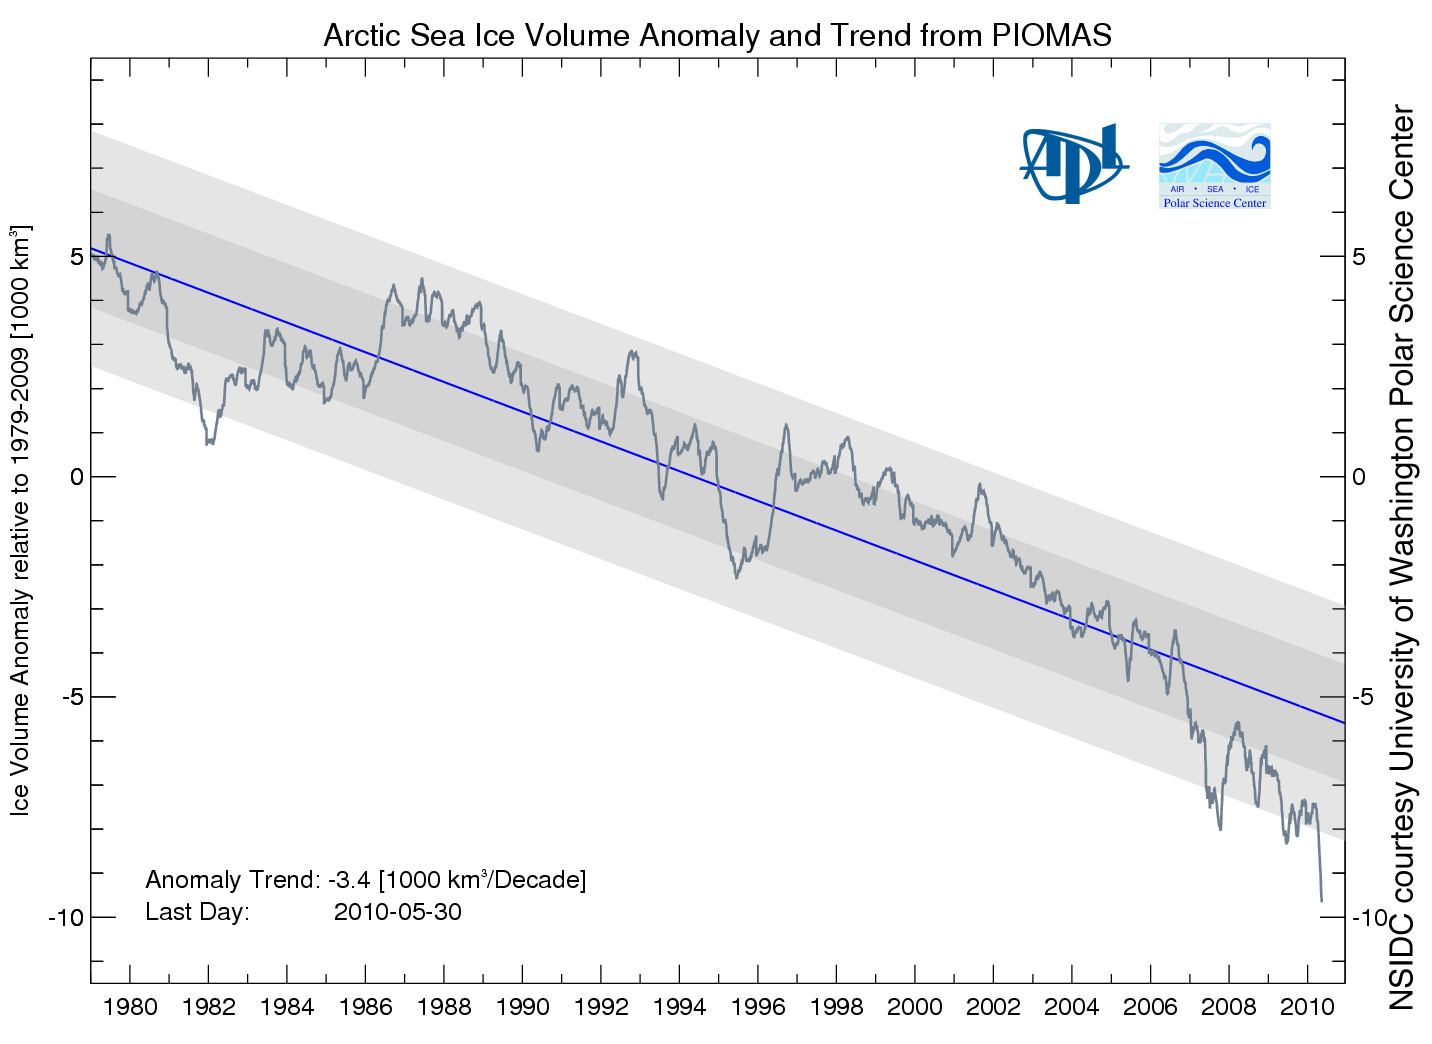
Then NSIDC discussed my favorite graph from PIOMAS, showing a record low anomaly of Arctic ice volume.

PIOMAS shows an anomaly nearly 50% greater than 2008. If that is correct, then surely we will have a record minimum this summer. However, the PIOMAS data seems inconsistent with PIPS2 data, which shows thicker ice covering a much larger area in 2010. My guess is that PIOMAS is looking at only a small region of the Arctic interior.
Next data source to look at are the Arctic Ice Concentration maps. UIUC has archived lower resolution maps since the start of the satellite record, such as the one below for June 11, 2010.

Their newer maps appear to show a lot more detail.
")
Note that the newer map shows a lot of low concentration ice in the Beaufort Sea (green, yellow, light pink.) Let’s see how that compares with a current satellite photo.

I must be missing something, because I don’t see much of that low concentration (green) ice in the satellite photo. The two videos below compare satellite vs new and old concentration maps. New comparison first :
The old concentration maps correlate much more closely with the satellite photo.
You can also see in the video below how erratic the bands of yellow and green are in the newer maps. They appear one day and disappear the next.
In the low colour version of the video, it appears that they may be having trouble differentiating between cloud cover and low concentration ice. We see large areas of open water switching to saturated ice overnight, and vice-versa.
It appears that the precision of the newer maps is much greater than their accuracy. Better to use a low precision map which is matched correctly with its accuracy.
Moving on, Barrow Sea Ice is starting to show first signs of thinning. By June 16, 2007 the ice had already broken up.
.
http://seaice.alaska.edu/gi/observatories/barrow_sealevel/brw2010/BRW_MBS10_overview_complete.png
Temperatures in the Arctic have continued below normal and below freezing for the last few weeks.
")
http://ocean.dmi.dk/arctic/meant80n.uk.php
NCEP is forecasting below freezing temperatures for much of the Arctic Basin during the next week.

This week, the sun reaches its highest point in the sky. Next week it starts its decline towards winter.
Now, the really interesting stuff. Arctic Basin sea ice volume (calculated from PIPS maps) remains close to the 2006 track, and well above the last three years

Area is slightly below 2006 and 2009.

Thickness is nearly identical to 2006 and 2007.

Conclusion : 2010 minimum extent is on track to come in just below 2006. With the cold temperatures the Arctic is experiencing, the likelihood of a big melt is diminishing.
NSIDC shows extent lower than 2007. The modified NSIDC map below shows where they believe the gaps are (in red.)

On the surface, this appears to disagree with my measurement above that Arctic Basin ice area is greater than 2007. The difference is that I am only considering regions that have perennial ice – i.e my PIPS calculations assume that there is no summer ice in Hudson Bay or the Barents Sea, and that they are a “don’t care” for estimating minimum extent. You can see in my PIPS ROI (Region of Interest) maps for June 14 below, that there is excellent agreement between PIPS and NSIDC. 2007 had less ice in the Chukchi and Laptev Sea, and more in the Beaufort Sea.

PIPS June 14, 2010

PIPS June 14, 2007
The modified NSIDC image below shows ice loss since June 3.

The modified NSIDC image below shows ice loss since early April.

And finally, the modified NSIDC image below shows regions which have below normal ice extent.

My analysis indicates the highest late summer extent since 2006. In discussing, please remember that the regions in red above normally have no ice in September. They don’t figure in to the summer minimum.
Oops, I meant to say above that I bet 5.1 *10^6 km^2, not 5.1^6 km^2.
stevengoddard says:
June 14, 2010 at 10:10 pm
AndyW
“I should probably attach units to the graphs. My measurements are in pixels, and I haven’t calculated the relationship to km2. You can’t compare my numbers to JAXA or NSIDC anyway this early in summer, because my ROI is smaller.”
Sorry, completely misled you there, I was taking about summer minima in my first post? You seemed from your piece to be edging towards thinking about that range for it.
Andy
1) Ice Age in the 70s
The link I gave lists 42 scientific papers published between 1965 and 1978 suggesting Co2 could warm the Earth (mind it, they were far less certain then they are now). Over the same time period, a total of 7 scientific papers claiming impending cooling were published.
If you want to claim the Ice Age scare of the ’70s had support from a majority of scientists, you should find at least 40 scientific papers published in the period stating an Ice Age was in the making. I will be more than happy to change my mind if presented with sufficient evidence. I am, after all, a skeptic.
2) Ships crossing the Arctic.
No ship sailed accross the Arctic in one season before the melt the 2000s. They all overwintered. And no commercial ship made it through before the melt of the 2000s – the St. Roch wasn’t a little wooden ship, it was a fortified shooner built specifically to withstand ice pressure. What’s remarkable of the recent melt is that it allowed commercial ships to make it through without ice breakers. That had never happened before.
3) Alarmism.
Suggesting that mankind modifying climate could have an harmful impact on civilization -> alarmism
Suggesting a tax on carbon will disrupt the world’s economies and kill millions -> coolheaded rationalism
It’s a wonder how the world managed to survive the oil shocks! Besides, the persistently high oil prices in the second half of the 2000s and the current disaster in the GOM should convince everyone that regardless of AGW, relying on fossil fuels isn’t a good receipt for the economic health of a country.
Anu says:
June 15, 2010 at 9:12 pm
There we go again. Boorish and tiresome trolls. There are many other blogs where this childish type of posting can be found in spades, but this blog has until recently avoided them and remained an arena for grown up and civilised discussion.
Those who predicted on earlier threads that the revelations of climategate and the subsequent debunking of the myths of CC/AGW would create a vituperative backlash from disappointed adherents have been proven correct in short order!
Hypnos,
The St Roch traversed the passage in one season. What this proves, or disproves, about Arctic Ice Extent is another story, but the basic fact is not up for debate and it does not advance your argument when you begin it with factually incorrect statements.
As for the cooling vs warming trends in the 1970s, the Newsweek cover stories of the day captured the popular beliefs of the day, just as they do now. The popular beliefs were fed by a combination of scientific research and publicity, just as they are today. Speaking as someone who was there, and paying attention, I am here to say that the climatologists who were getting attention were telling the world the ice age was imminent, and it was all our fault. Those climatologists who expressed a skeptical or opposite view somehow failed to get equal time in the popular media.
Some things don’t change much.
AndyW
Seems like JAXA 5.5 Mkm2 is a decent WAG at this point.
June 6:
Steve Goddard: “Based on current ice thickness, we should expect September extent/area to come in near the top of the JAXA rankings (near 2003 [6.1 Mkm2] and 2006 [5.9 Mkm2].)”
June 16:
Steve Goddard: “Seems like JAXA 5.5 Mkm2 is a decent WAG at this point.”
Steve’s estimates of the minimum extent are dropping almost as fast as the arctic ice itself is melting.
Steve,
From what I have seen about 2007, the currents were the most important factor for the heavy melt that year, with heavy flushing of multi-year ice into the Atlantic. You need to present more information about the historic paterns of the arctic winds and currents, particularly the strength of the East Greenland Current. I think the rest is just noise.
This is rhetoric. Have you nothing to say about sources and data problems that I outlined in my post? The graphs at CT that you have used are clearly labeled as lacking information on sea ice at less than 30% concentration. You don’t see this as problematic regarding your conclusions? Why didn’t you alert us to the disclaimer in your original post? And have you yet contacted PIOMAS to determines whether or not they confine their analysis to a small are North of Greenland as you speculate?
As we all know by now, weather conditions (like wind patterns), have a large influence on final sea ice extent. Betting on a record-breaking year, even with low-volume indicators, is chancy. For the record, I will state that I am very confident this year’s minimum sea ice extent will be amongst the four lowest in the satellite record – i’d wager money on that. I am slightly less confident that it will be lowest or second lowest, and think it’s 50/50 that the record will be broken this year. That’s the best I can do. I don’t bet on the weather months in advance. But I’m willing to make bets based on longer-term trends.
I look forward to your post at sea-ice minimum.
(Thanks to the mods for explaining they regularly check the spam filter. I’ve lost posts before and didn’t know that this occurred)
Halfwise, the stuff posted by Hypnos alleging to “refute” the ice age scare of the 70s appears to be standard cut-and-paste from several of the warmist sites. Apparently the ice age scare is to be given the MWP treatment and erased from history. In many cases it is the exact same “climatologists” making the proclamations, too. Wrong then, wrong now. Eventually they will figure out what a sine wave looks like.
A remarkable oddity is the persistence of the ice in the SW corner of the Sea Of Okhotsk.
stevengoddard says:
June 15, 2010 at 9:27 pm
Anu
In Hawaii, the leaders met regularly to decide how to stop those awful volcanic eruptions.
They recognized that a sacrifice had to be made, and threw thousands people into the volcano.
And the people of Rapa Nui wiped out the trees on their island worshiping their deified ancestors by erecting the Moai – what’s your point, before Science people were ignorant, superstitious, and made bad policy decisions ?
Yes, I agree.
Far fewer deaths than the number which will be killed by similarly useless carbon taxes.
So you’ve thrown off the skeptic hat and declared global warming over, have you ? No more wait and see ? The antonym of “skeptic” is “believer” – is that what you are, Steven ?
I see why the Arctic sea ice melting away worries you…
http://nsidc.org/images/arcticseaicenews/20091005_Figure3.png
roger says:
June 16, 2010 at 2:53 am
There are many other blogs where this childish type of posting can be found in spades, but this blog has until recently avoided them and remained an arena for grown up and civilised discussion.
There we go again – gleefully attacking official “enemies” while imagining it to be “grown up and civilised discussion”, e.g.:
http://wattsupwiththat.com/2010/01/10/mann-erisms-where-did-we-get-that-idea/
http://wattsupwiththat.com/2010/06/09/climate-change-have-we-reached-the-irreversible-stage/
and whining when someone voices an opinion you don’t agree with.
Those who predicted on earlier threads that the revelations of climategate and the subsequent debunking of the myths of CC/AGW would create a vituperative backlash from disappointed adherents have been proven correct in short order!
Climategate revealed little, AGW has not been “debunked”, the moderator saves people like you from my vituperation, I’m neither disappointed nor an adherent – but I do appreciate you putting all your errors in one succinct sentence.
SteveSadlov says:
June 16, 2010 at 9:35 am
A remarkable oddity is the persistence of the ice in the SW corner of the Sea Of Okhotsk.
Or maybe not too odd.
http://arctic.atmos.uiuc.edu/cryosphere/IMAGES/recent365.anom.region.14.html
“Climategate revealed little, AGW has not been ‘debunked’, the moderator saves people like you from my vituperation…”
How can one guy get everything so completely wrong?
Answer: Cognitive dissonance. When the flying saucers don’t arrive on schedule, it doesn’t mean there are no flying saucers. It just means their arrival has to be re-scheduled.☺
Just like Mrs. Keech’s flying saucers, seemingly breakthrough CAGW findings have all vanished, every one of them, after independent replication proved impossible. CAGW has now been downgraded from a hypothesis to an unsupported conjecture; a pseudo-scientific opinion kept on life support only by large infusions of grant money. Time to re-schedule.
They’ve got ’em at Intrade.
Roger Knights says:
June 15, 2010 at 7:39 pm
The latest odds on this year being icier than last are 43% at https://www.intrade.com
————————-
Know what you are talking about. It is not 43%, it is the the price of the bet at $43.00 on a volume of trading of 48 since the start in April. I dare you to eplain how that came to be a percentage.
In any case, the September sea ice extent will be lower than 2009, perhaps lower than 2008, or even coming close to 2007. Don’t forget that there has only be a partial recovery (as expected) of the massive 2007 loss, remaining about 500,000 sq km’s below the average (don’t confuse with normal). 2008 and 2009 recovered about 1/3rd each leaving 1/3rd unrecovered. In order to return to average, 2010 needs to recover another 500,000 sq/km’s, yet as of today (May 16) 2009 trails the 2010 melt by nearly 700,000 sq/km’s. Hence, as of today the ice melt would have to slow dramatically, which is highly unlikely, nor do past records show that it has done so during the time of credible record keeping. In that context 1979 is a good starting point
Tom P
Given that 5.5 was the first numeric estimate I have made for this year, I would have to say that you are being quite dishonest.
Smokey says:
June 16, 2010 at 1:28 pm
“Climategate revealed little, AGW has not been ‘debunked’, the moderator saves people like you from my vituperation…”
How can one guy get everything so completely wrong?
Answer: Cognitive dissonance. When the flying saucers don’t arrive on schedule, it doesn’t mean there are no flying saucers. It just means their arrival has to be re-scheduled.☺
————————-
Good grief, the astonishing logic floors me. Just because pigs don’t fly by my window, doesn’t mean there are no flying pigs; just reschedule their departure! I’ll call the nearest pig farm asap. (not sarcasm but an analogy)
———————–
Just like Mrs. Keech’s flying saucers, seemingly breakthrough CAGW findings have all vanished, every one of them, after independent replication proved impossible. CAGW has now been downgraded from a hypothesis to an unsupported conjecture; a pseudo-scientific opinion kept on life support only by large infusions of grant money. Time to re-schedule.
————————–
All vanished after independent replication? Downgraded from a hypothesis to unsupported conjecture? Pseudo scientific opinion? The latter I am quite familiar with just by reading this blog. There are some people here that argue from a scientific basis but in between there is a lot of garbage too. I test Steven Goddard’s hypothesis, just like some others (gratefully) do and judge it on it’s merits. Sometimes he does indulge in sarcasm, as in; Amino Acids in Meteorites says: June 15, 2010 at 5:54 pm
stevengoddard says: June 15, 2010 at 4:38 pm, which is not becoming.
Putting a self-calculated ice volume curve on an ice extent chart was deceptive and silly. Maintaining the “arctic recovered” claim, smells of having painted oneself into a corner as is the “global cooling” claim. I nevertheless appreciate his knowledge of scientific data and use and/or manipulation thereof. We can always counter argue the right and wrong.
Steve,
I mention that you had written on June 6 “Based on current ice thickness, we should expect September extent/area to come in near the top of the JAXA rankings (near 2003 [6.1 Mkm2] and 2006 [5.9 Mkm2].)”, with my addition of the relevant values, as I had done when you first reached this conclusion earlier in June.
Now you call me dishonest! How, exactly?
“All vanished after independent replication? Downgraded from a hypothesis to unsupported conjecture? Pseudo scientific opinion?”
Yep.
CO2
I can’t be responsible for whatever is going on inside your head.
Tom P says:
June 16, 2010 at 6:49 am
June 6:
Steve Goddard: “Based on current ice thickness, we should expect September extent/area to come in near the top of the JAXA rankings (near 2003 [6.1 Mkm2] and 2006 [5.9 Mkm2].)”
June 16:
Steve Goddard: “Seems like JAXA 5.5 Mkm2 is a decent WAG at this point.”
Steve’s estimates of the minimum extent are dropping almost as fast as the arctic ice itself is melting.
Ah, but like a seasoned politician, Steve left himself some wiggle room:
http://wattsupwiththat.com/2010/06/06/wuwt-arctic-sea-ice-news-8/
Conclusion : Based on current ice thickness, we should expect September extent/area to come in near the top of the JAXA rankings (near 2003 and 2006.)
The word “near” might not mean what you think it means. To a normal person, it would mean “near 6 million sq. km.”:
http://www.ijis.iarc.uaf.edu/seaice/extent/AMSRE_Sea_Ice_Extent_L.png
Certainly above 2009.
But to a person with an agenda, “near” will mean whatever it has to mean, come October: $4.2 billion is very near $6 billion.
Seems like JAXA 5.5 Mkm2 is a decent WAG at this point.
5.5 is just a wild ass guess – come October, that can be hand waved away as unimportant/very-approximate, and besides, Arctic sea ice melting away in the summer is no big deal.
Tom P
Given that 5.5 was the first numeric estimate I have made for this year, I would have to say that you are being quite dishonest.
Yes Tom P., how dare you hold Steve to his non-numeric predictions which merely used the years 2003 and 2006 ? (sure, the Year is a number, but you know what he means… he never said “near 6.1 Mkm2 and 5.9 Mkm2”)
As for my prediction of Arctic sea ice minimum extent being less than 2009 – maybe I meant 2009 * 10^6 sq. km.
I’ll let you know at the end of September.
Smokey says:
June 16, 2010 at 8:10 pm
“All vanished after independent replication? Downgraded from a hypothesis to unsupported conjecture? Pseudo scientific opinion?”
Yep.
They don’t call him “Smokey” for nothing:
http://blogs.ocweekly.com/navelgazing/arnold_smoking-pot.jpg
It just looks that way, and looks can be deceiving. All betting is done in terms of contracts that each pay out $10 to the winner when they are settled. The 43 means (absurdly) that it will cost a bettor $4.30 to buy a $10 “contract” affirming the truth of the contract’s wording. If he wants to buy 10 contracts, it will cost him $43, if he wants five it’ll be $21.50, etc. Hence a contract selling for 43 is offering odds of 43%. (IMO Intrade should not have employed such a confusing arrangement; it took me quite a bit of betting there for me to wrap my head around their way of doing things.)
See above.
(Here’s more detail, which I skipped because I just wanted to indicate approximately what the odds are without an extraneous tangent. The 43 means only that the “last” trade occurred at that price. At any moment there are actually two prices, a lower (bid) price that you can sell at and a higher (ask) price that you can buy at, as on the stock market. Or you can place a bid or make an offer yourself in between the two, and hope someone will make a contract with you later.)